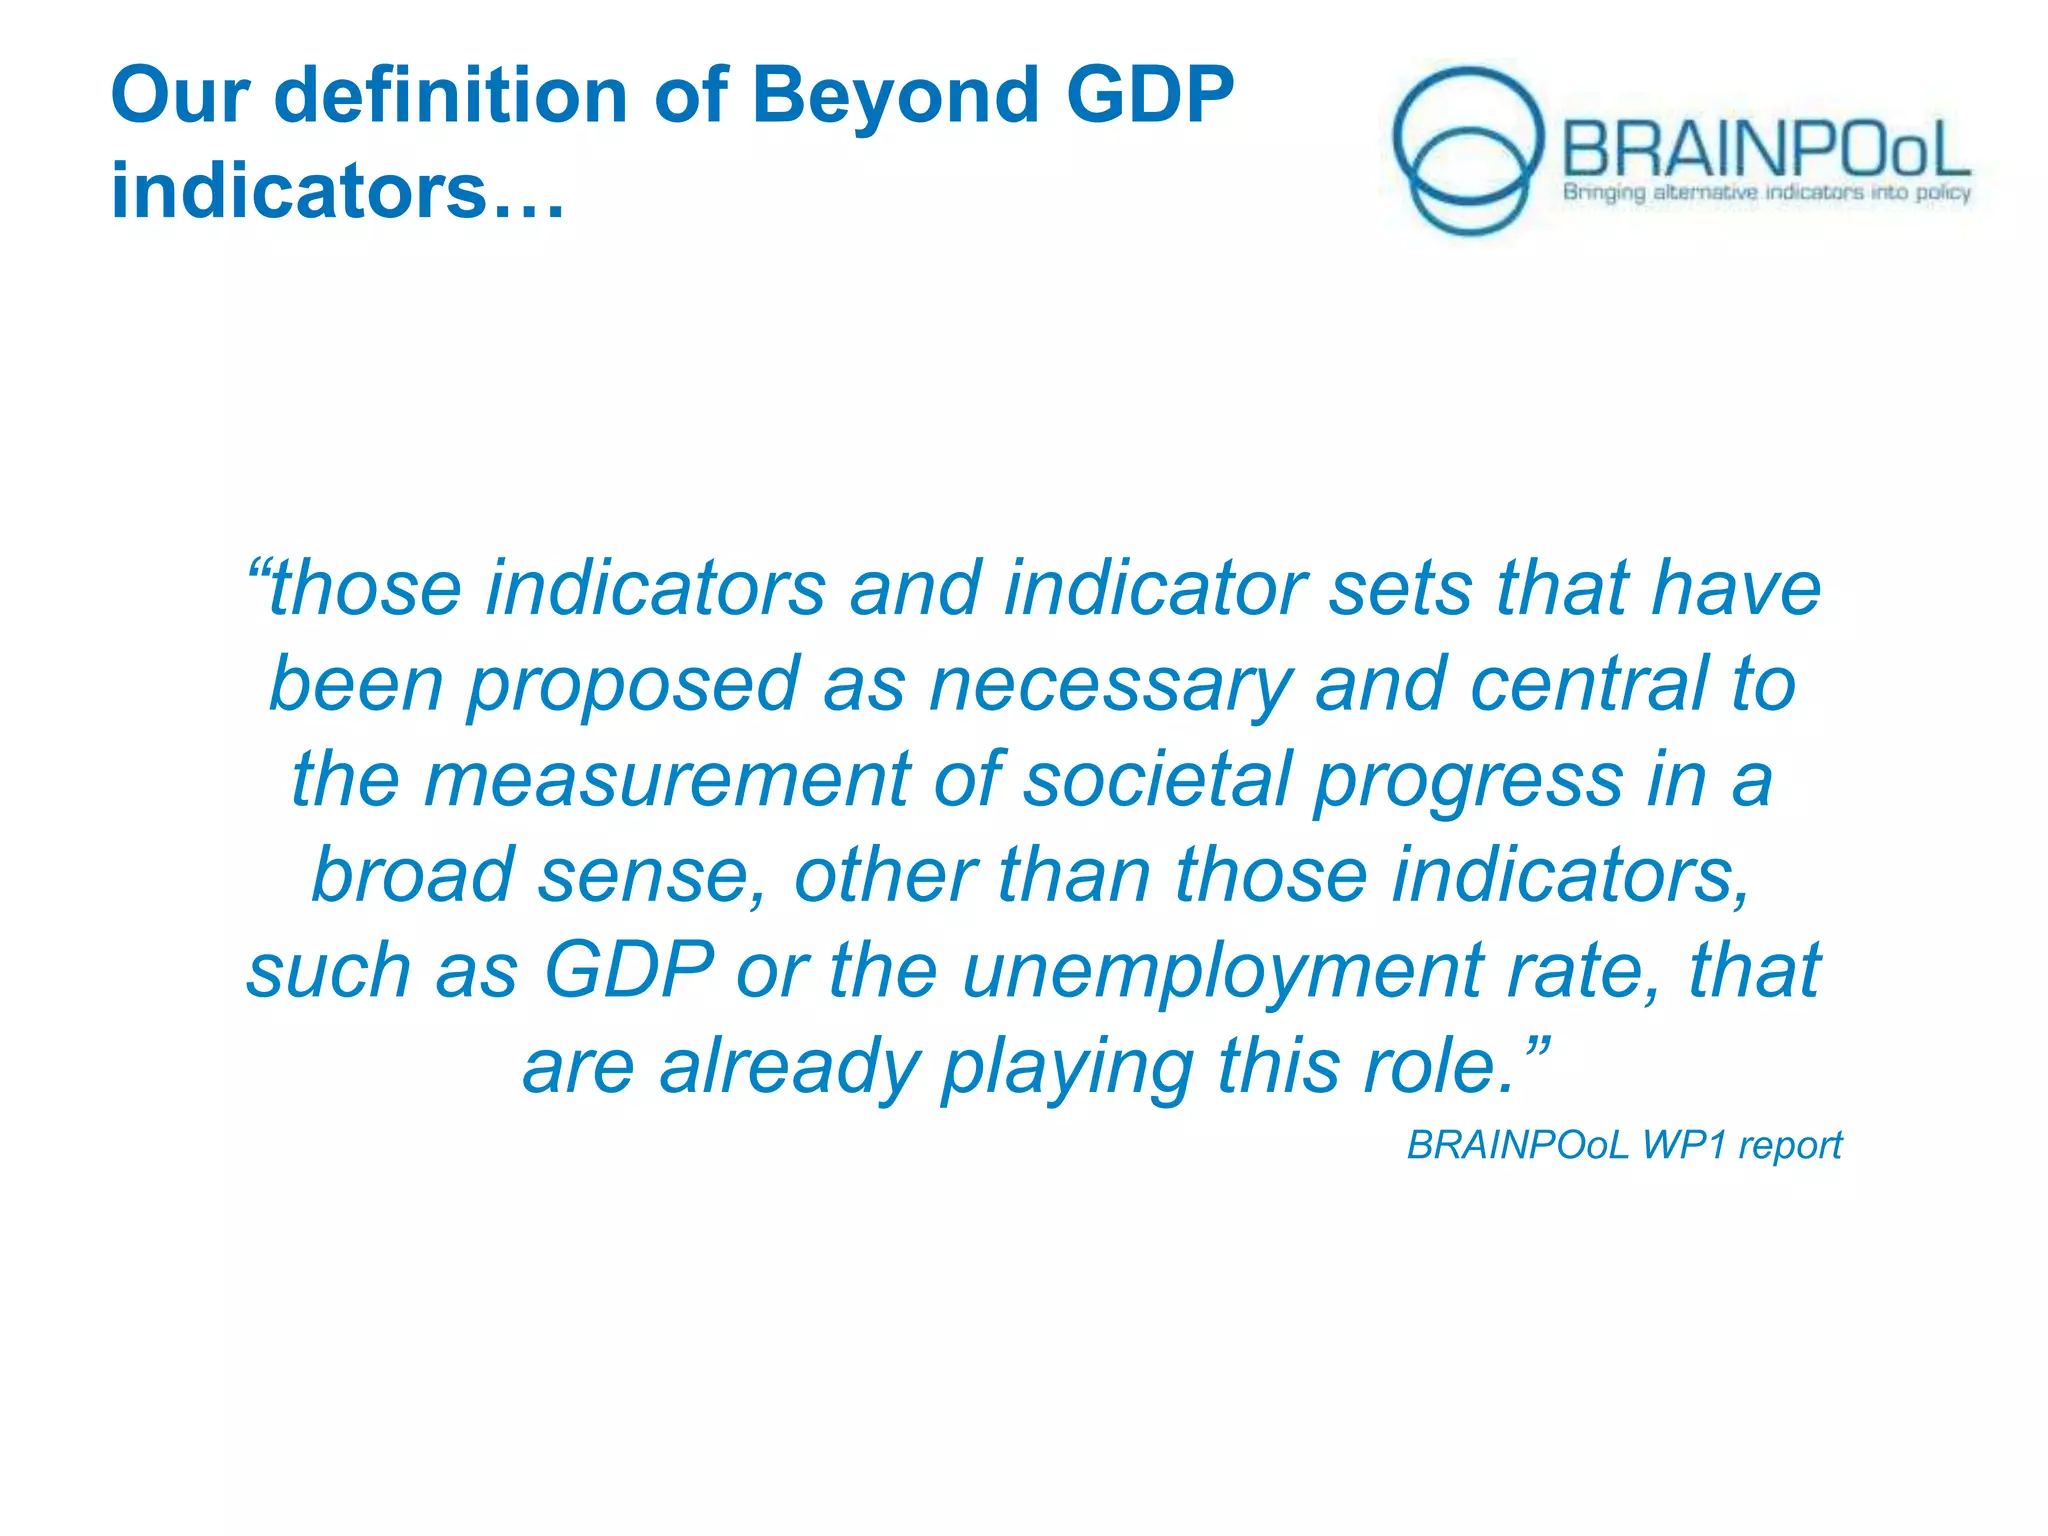
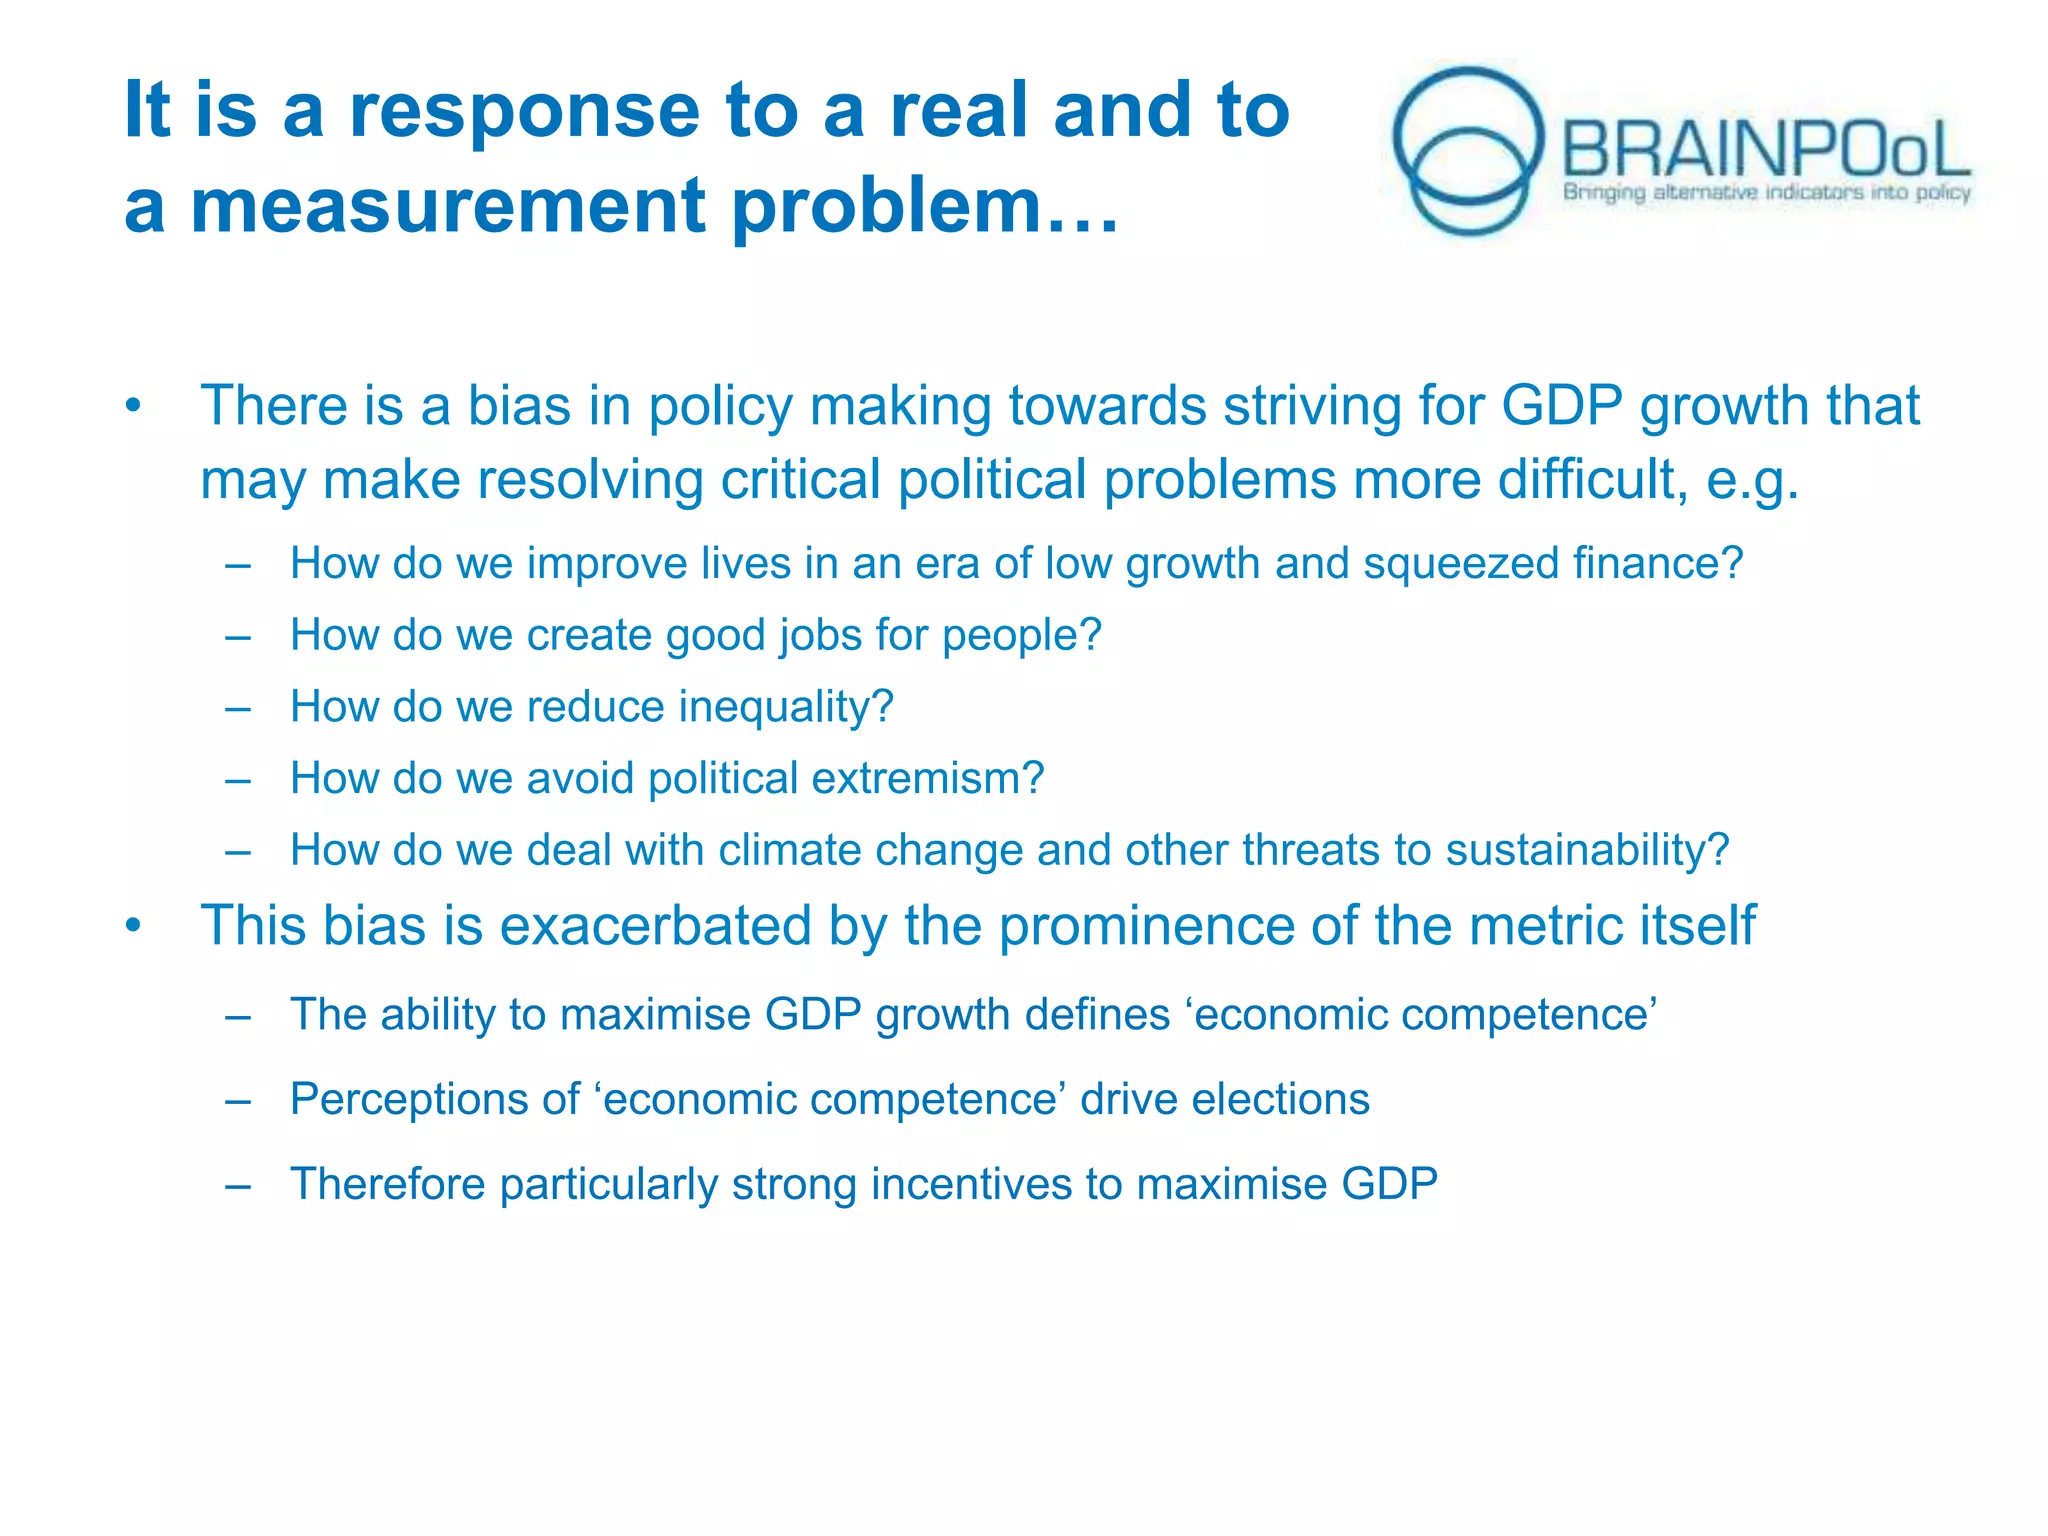
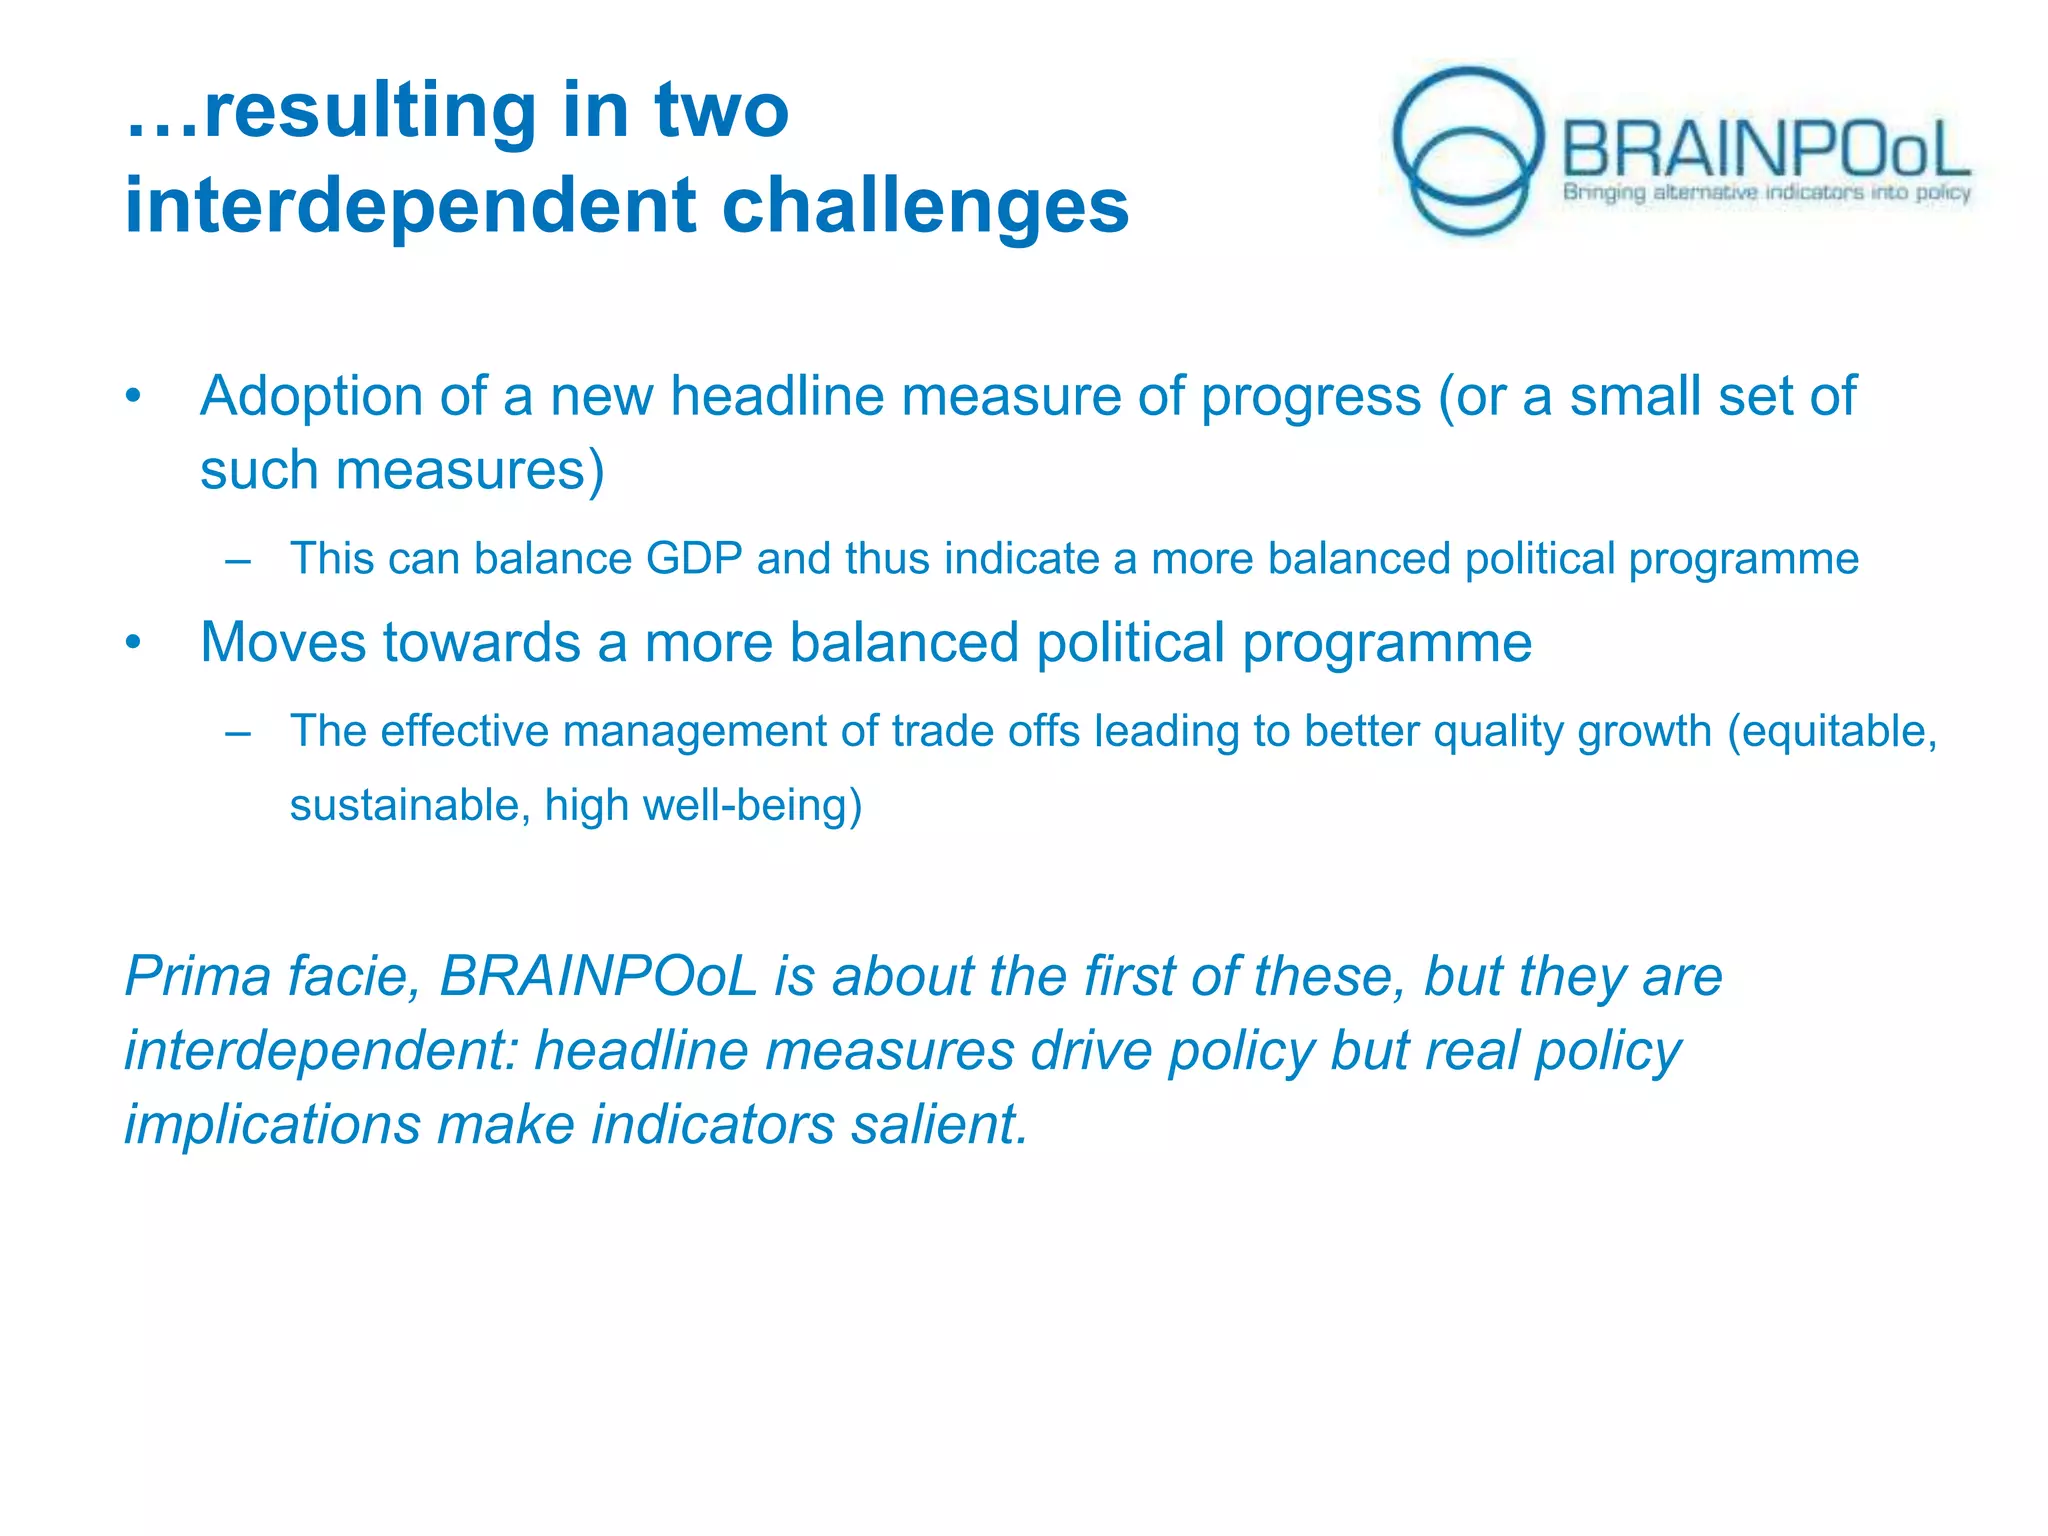
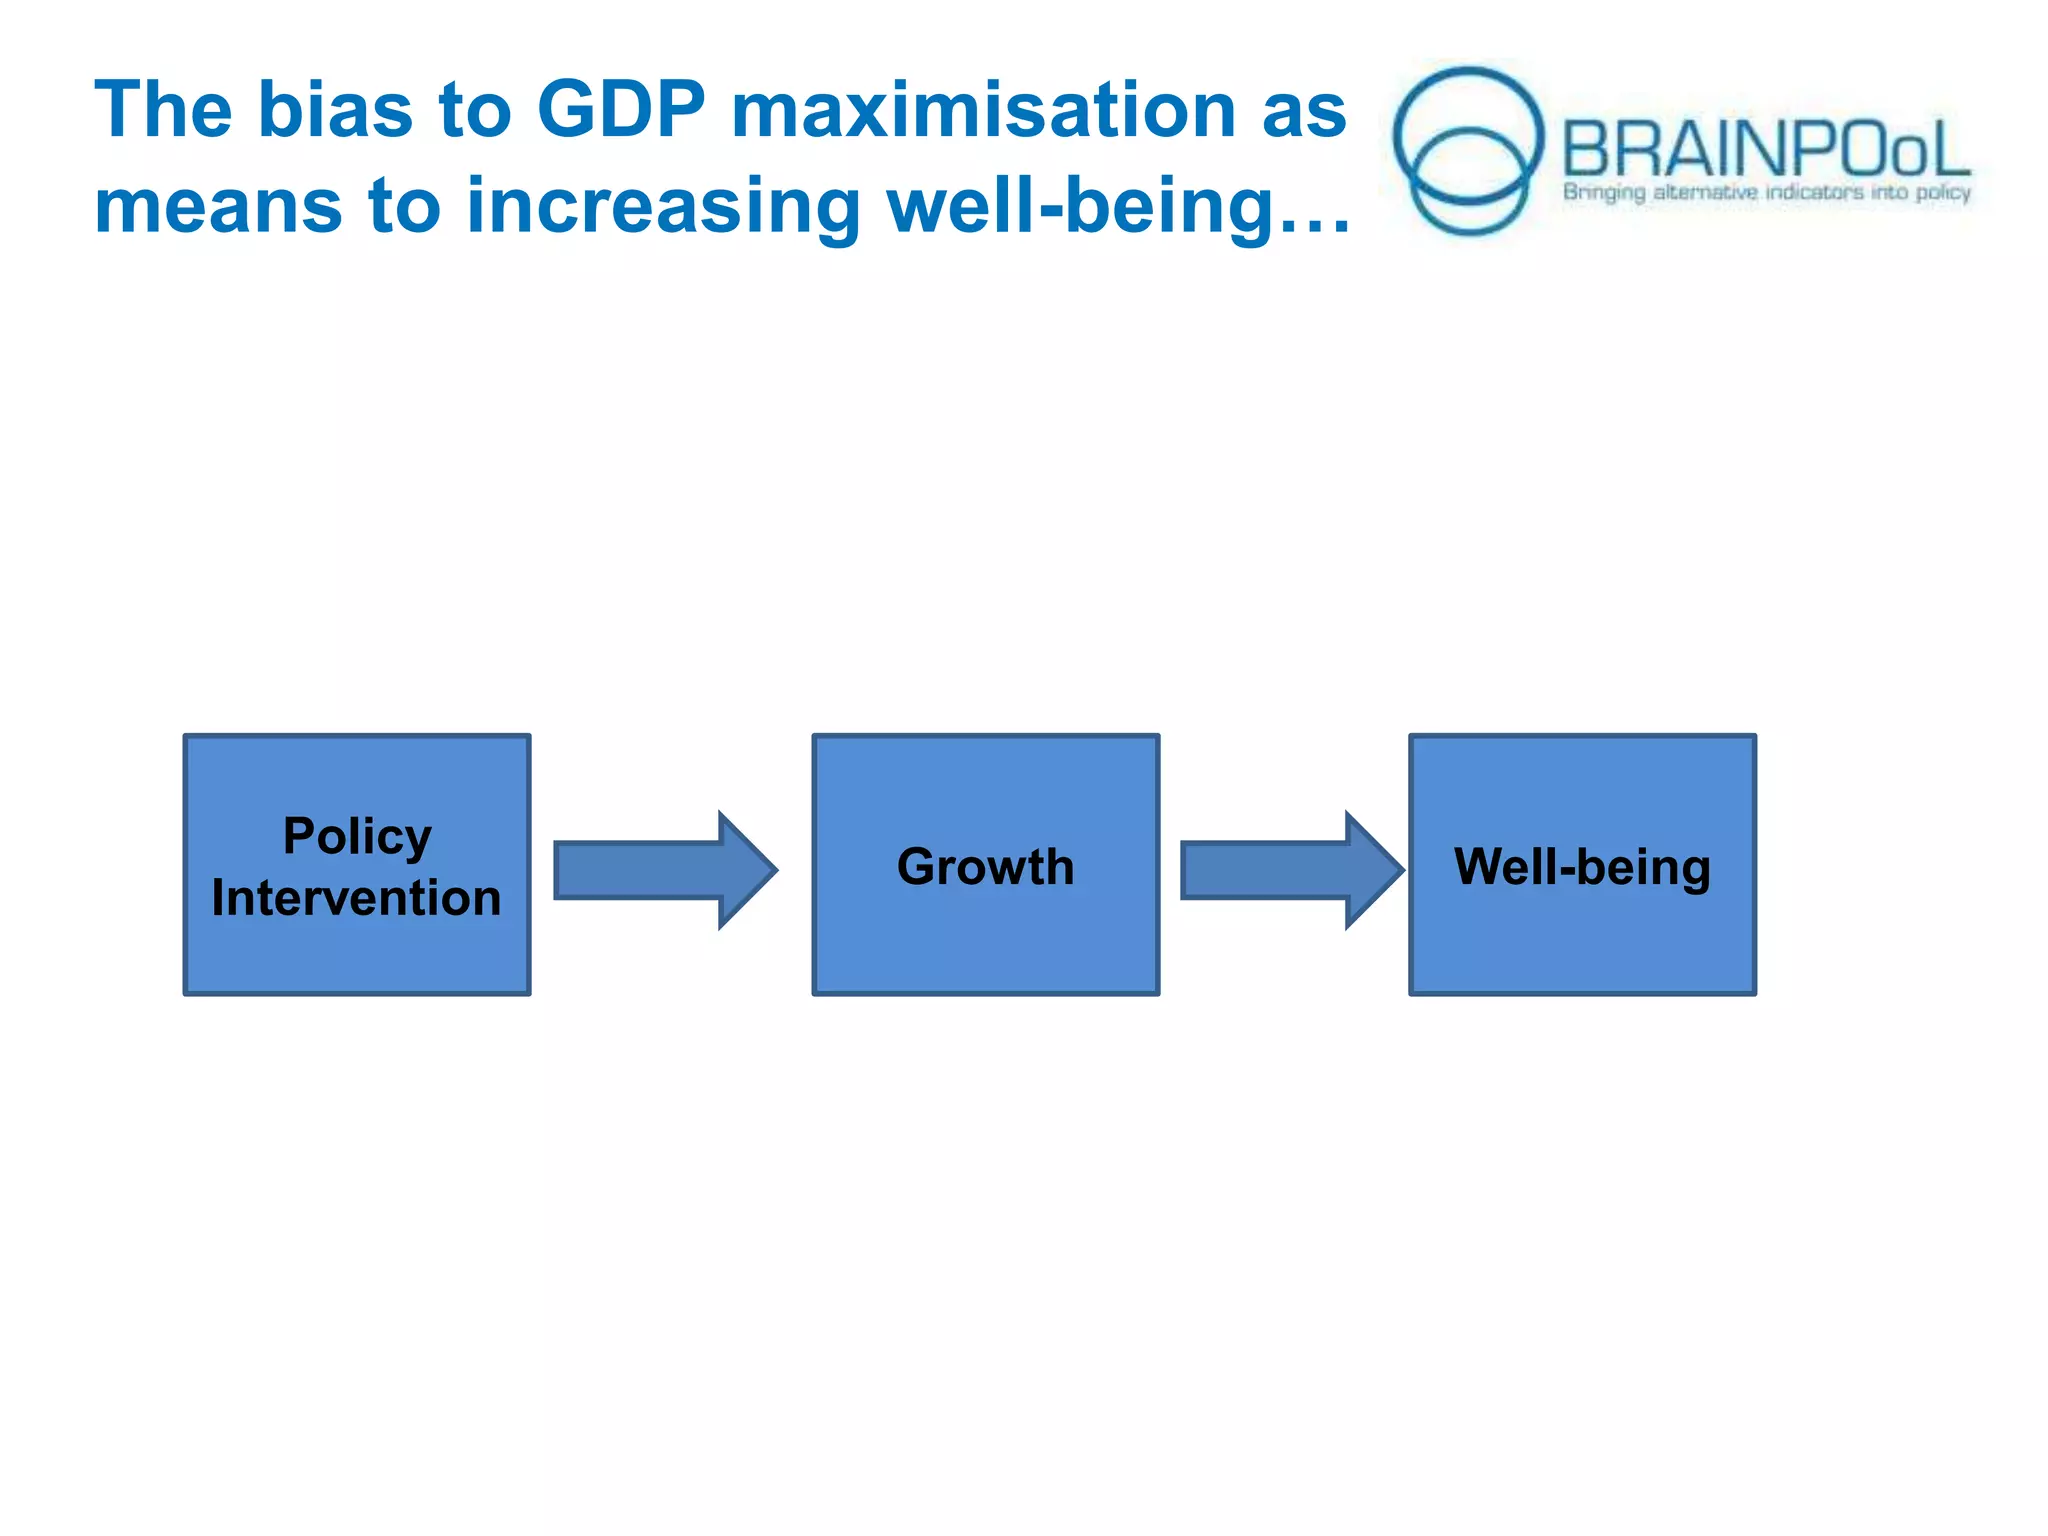
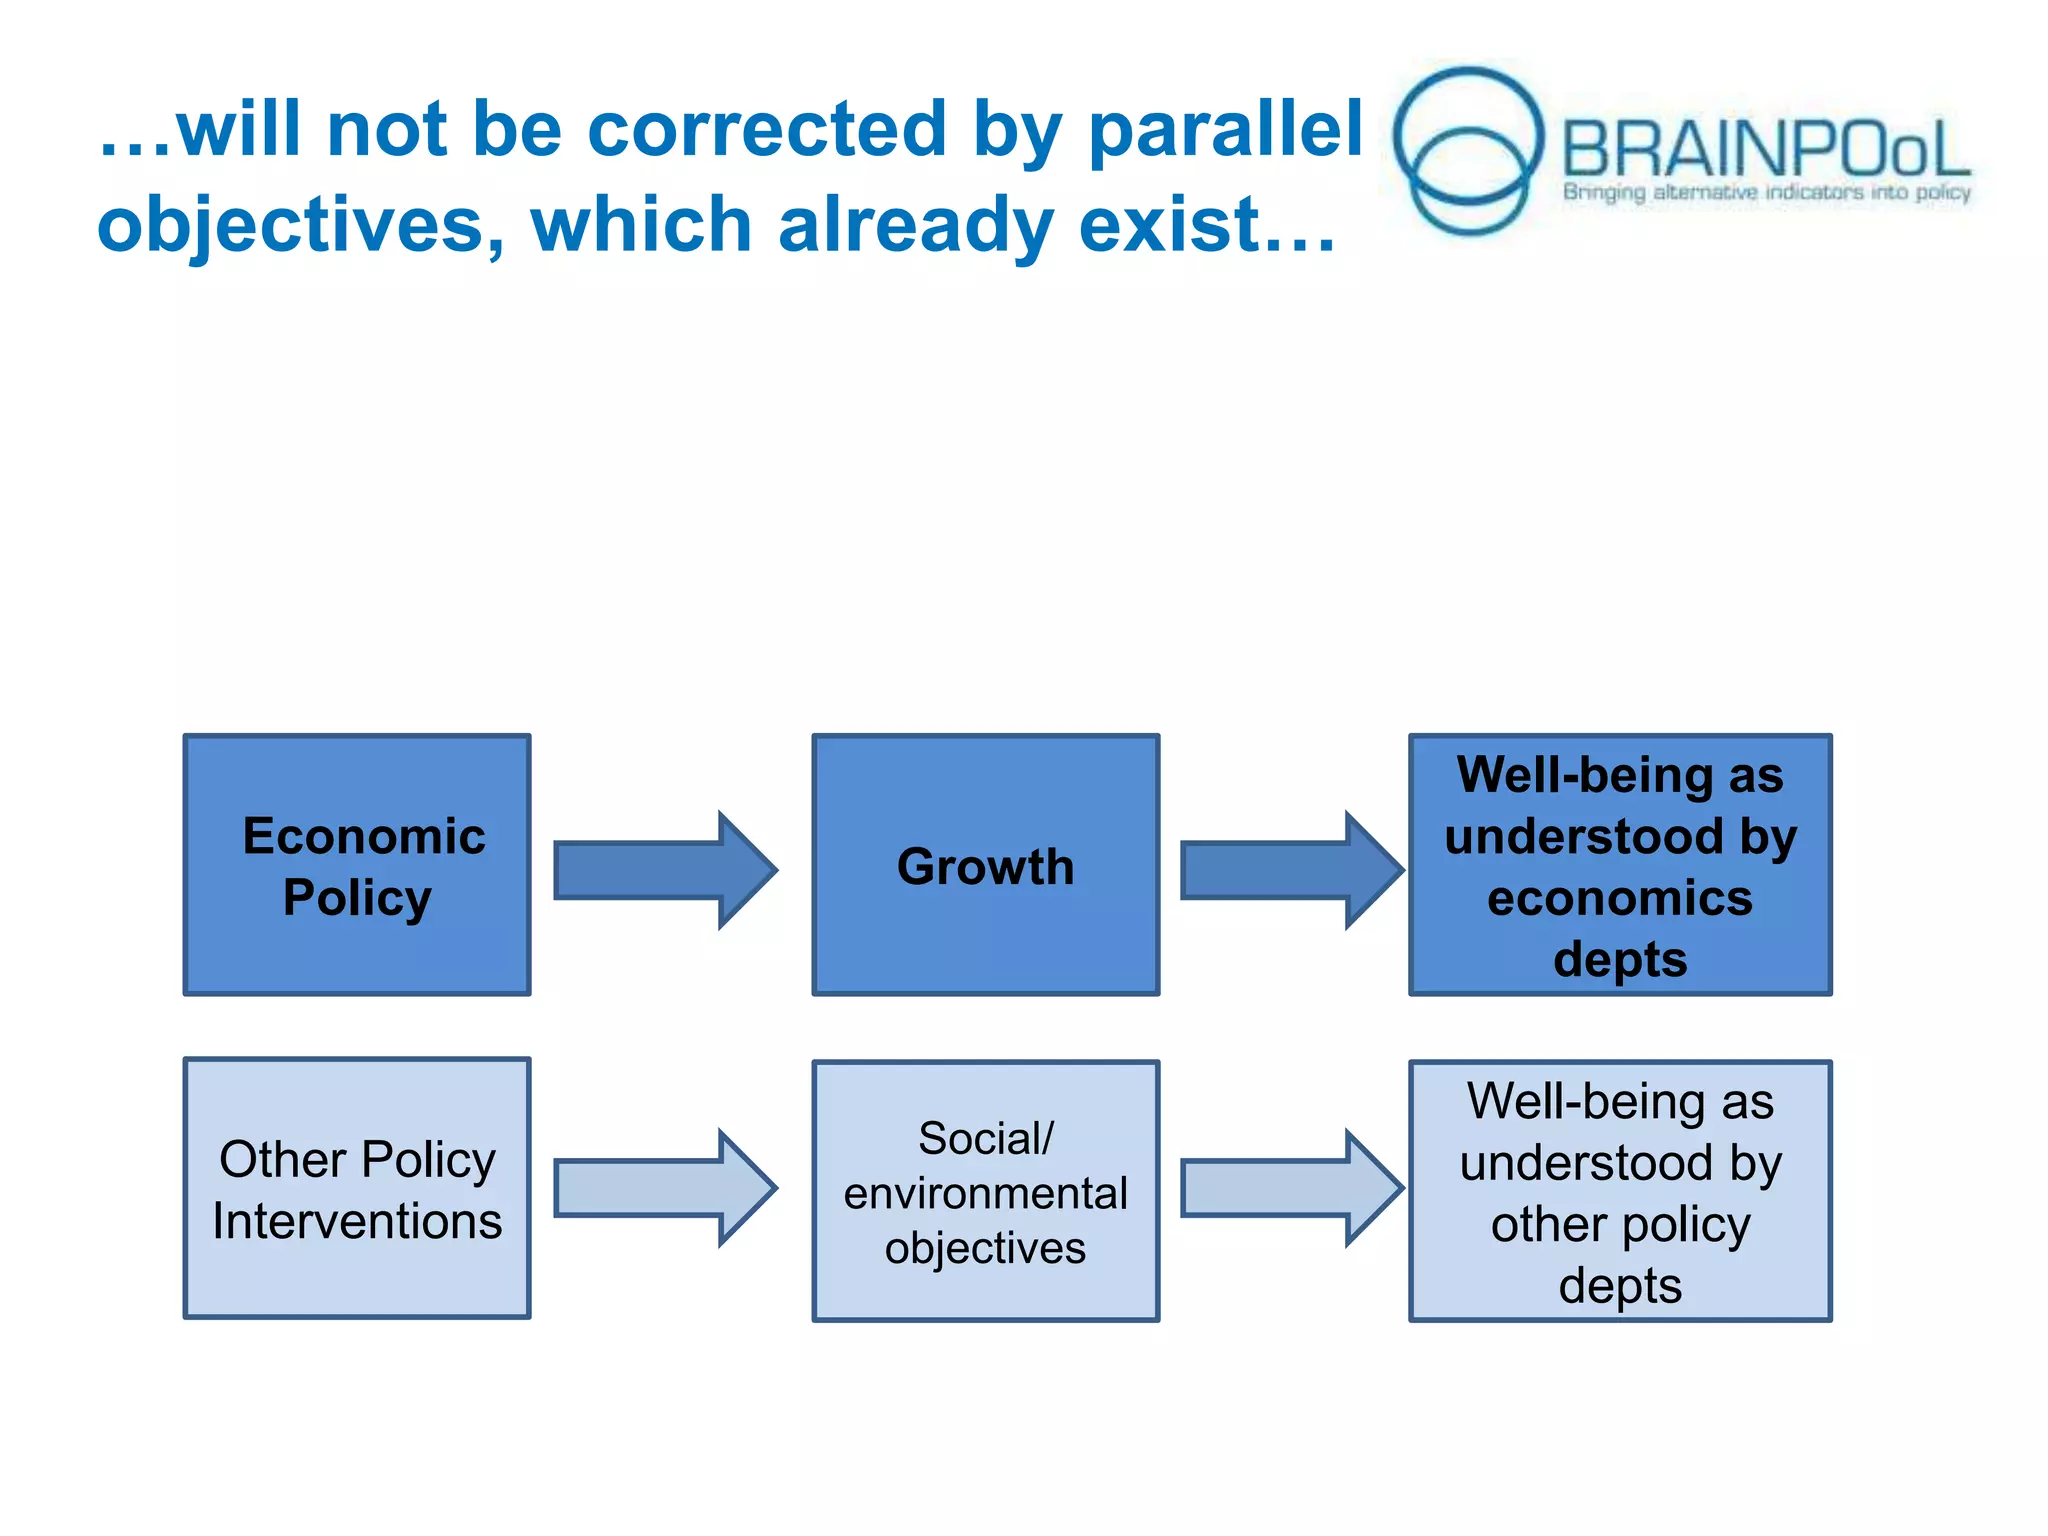
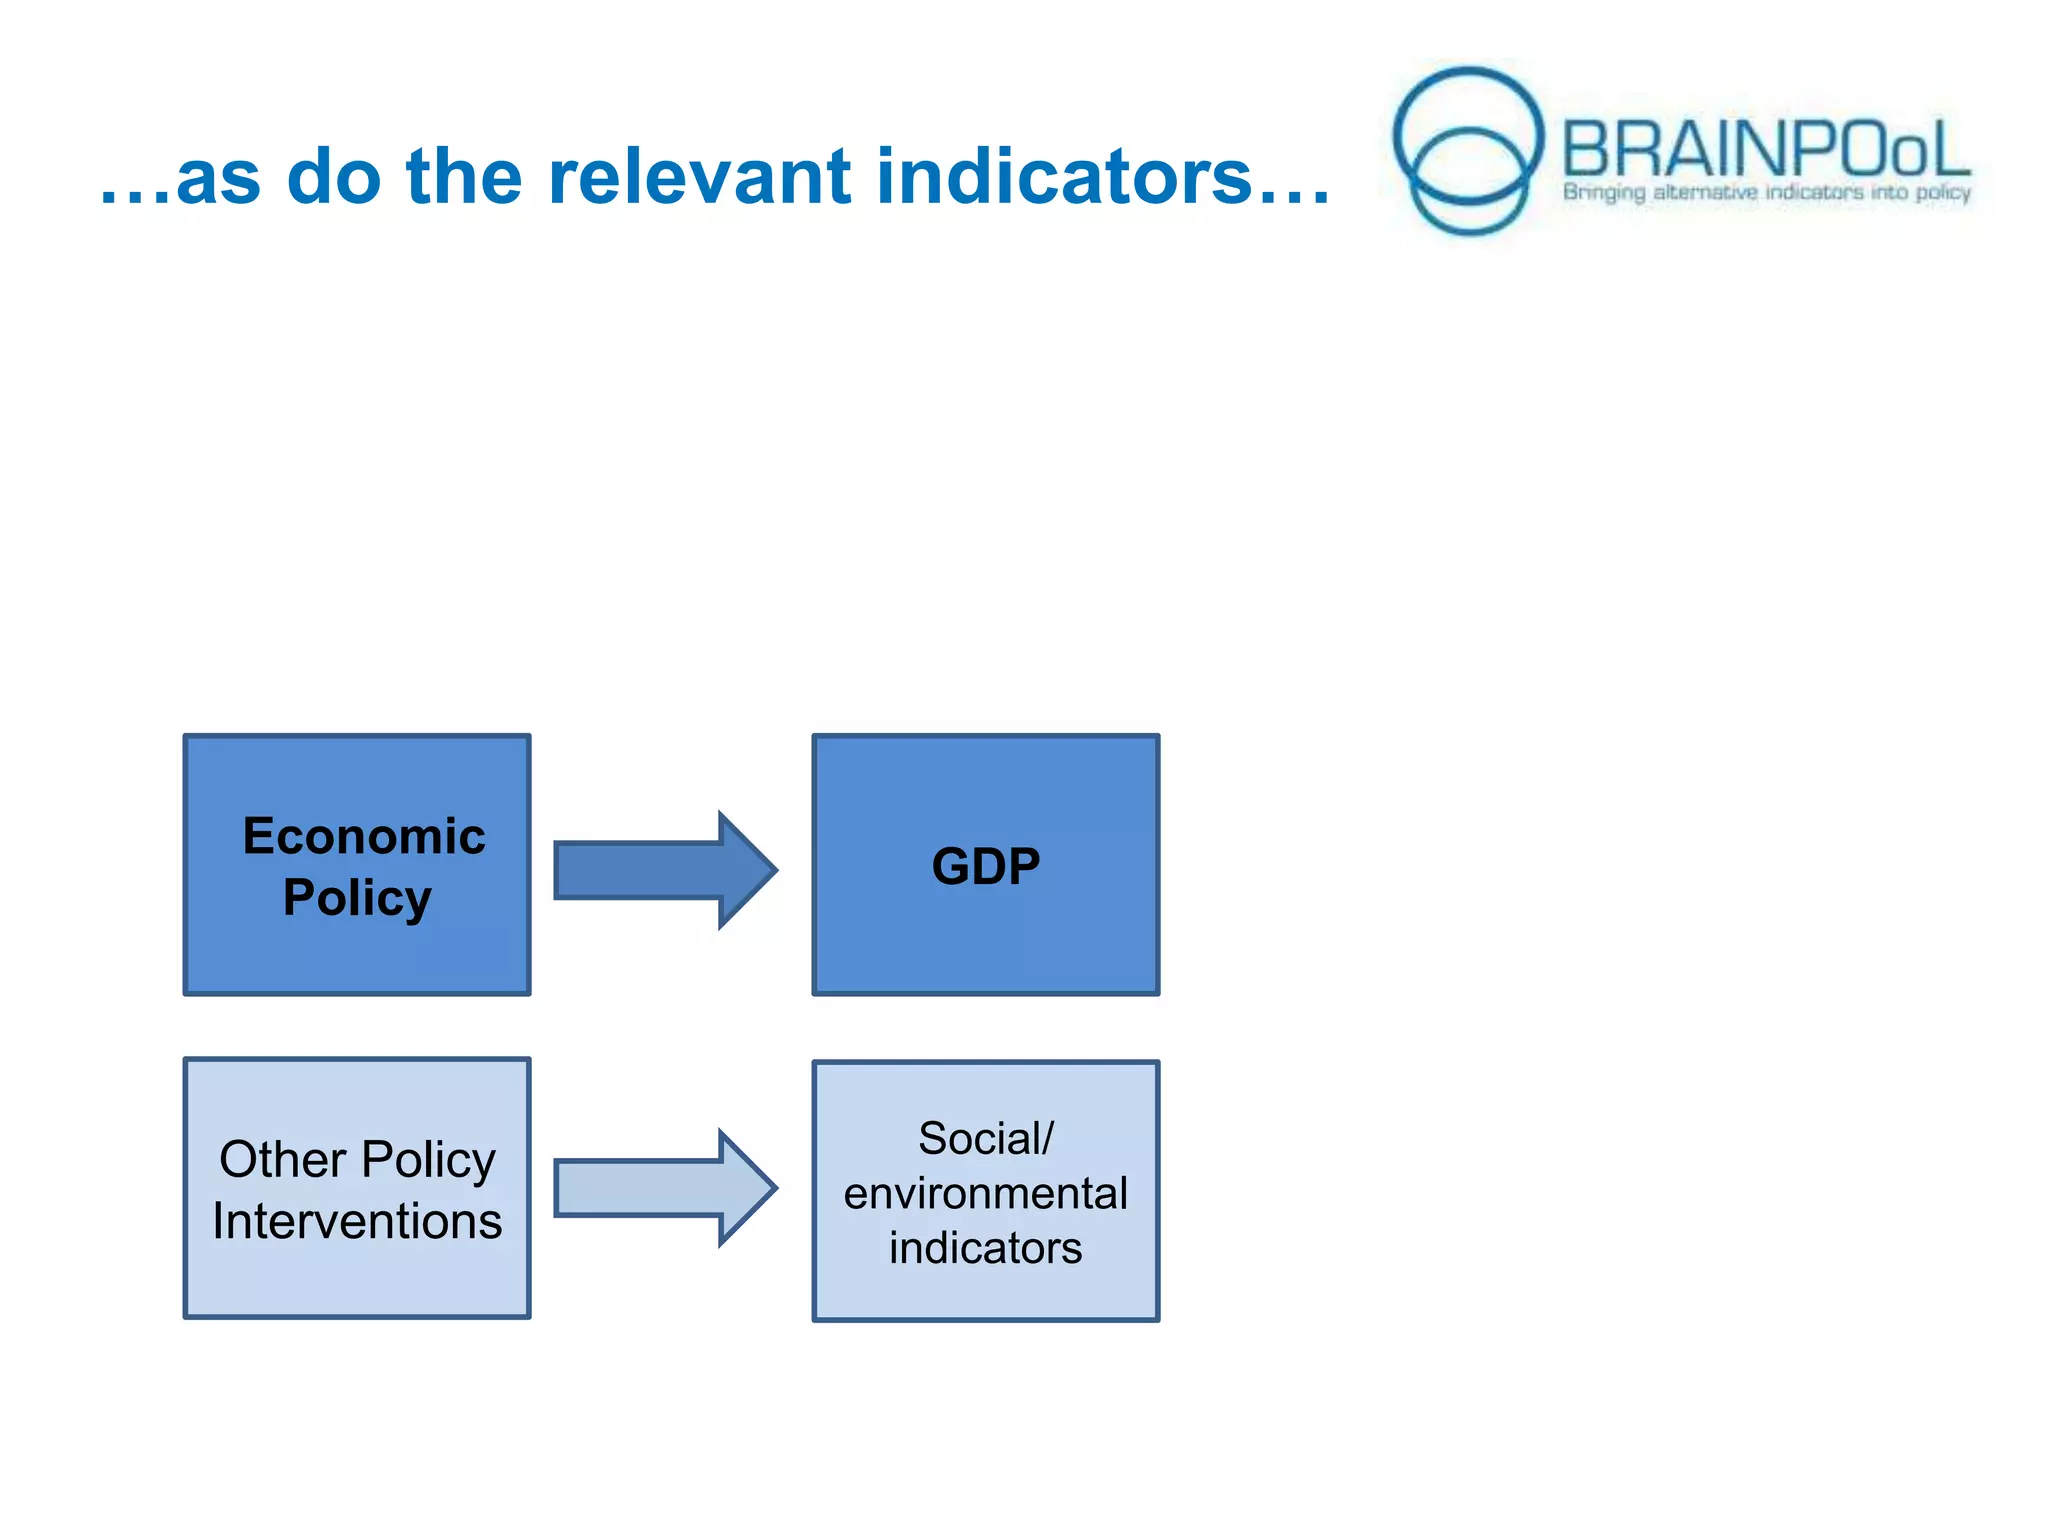
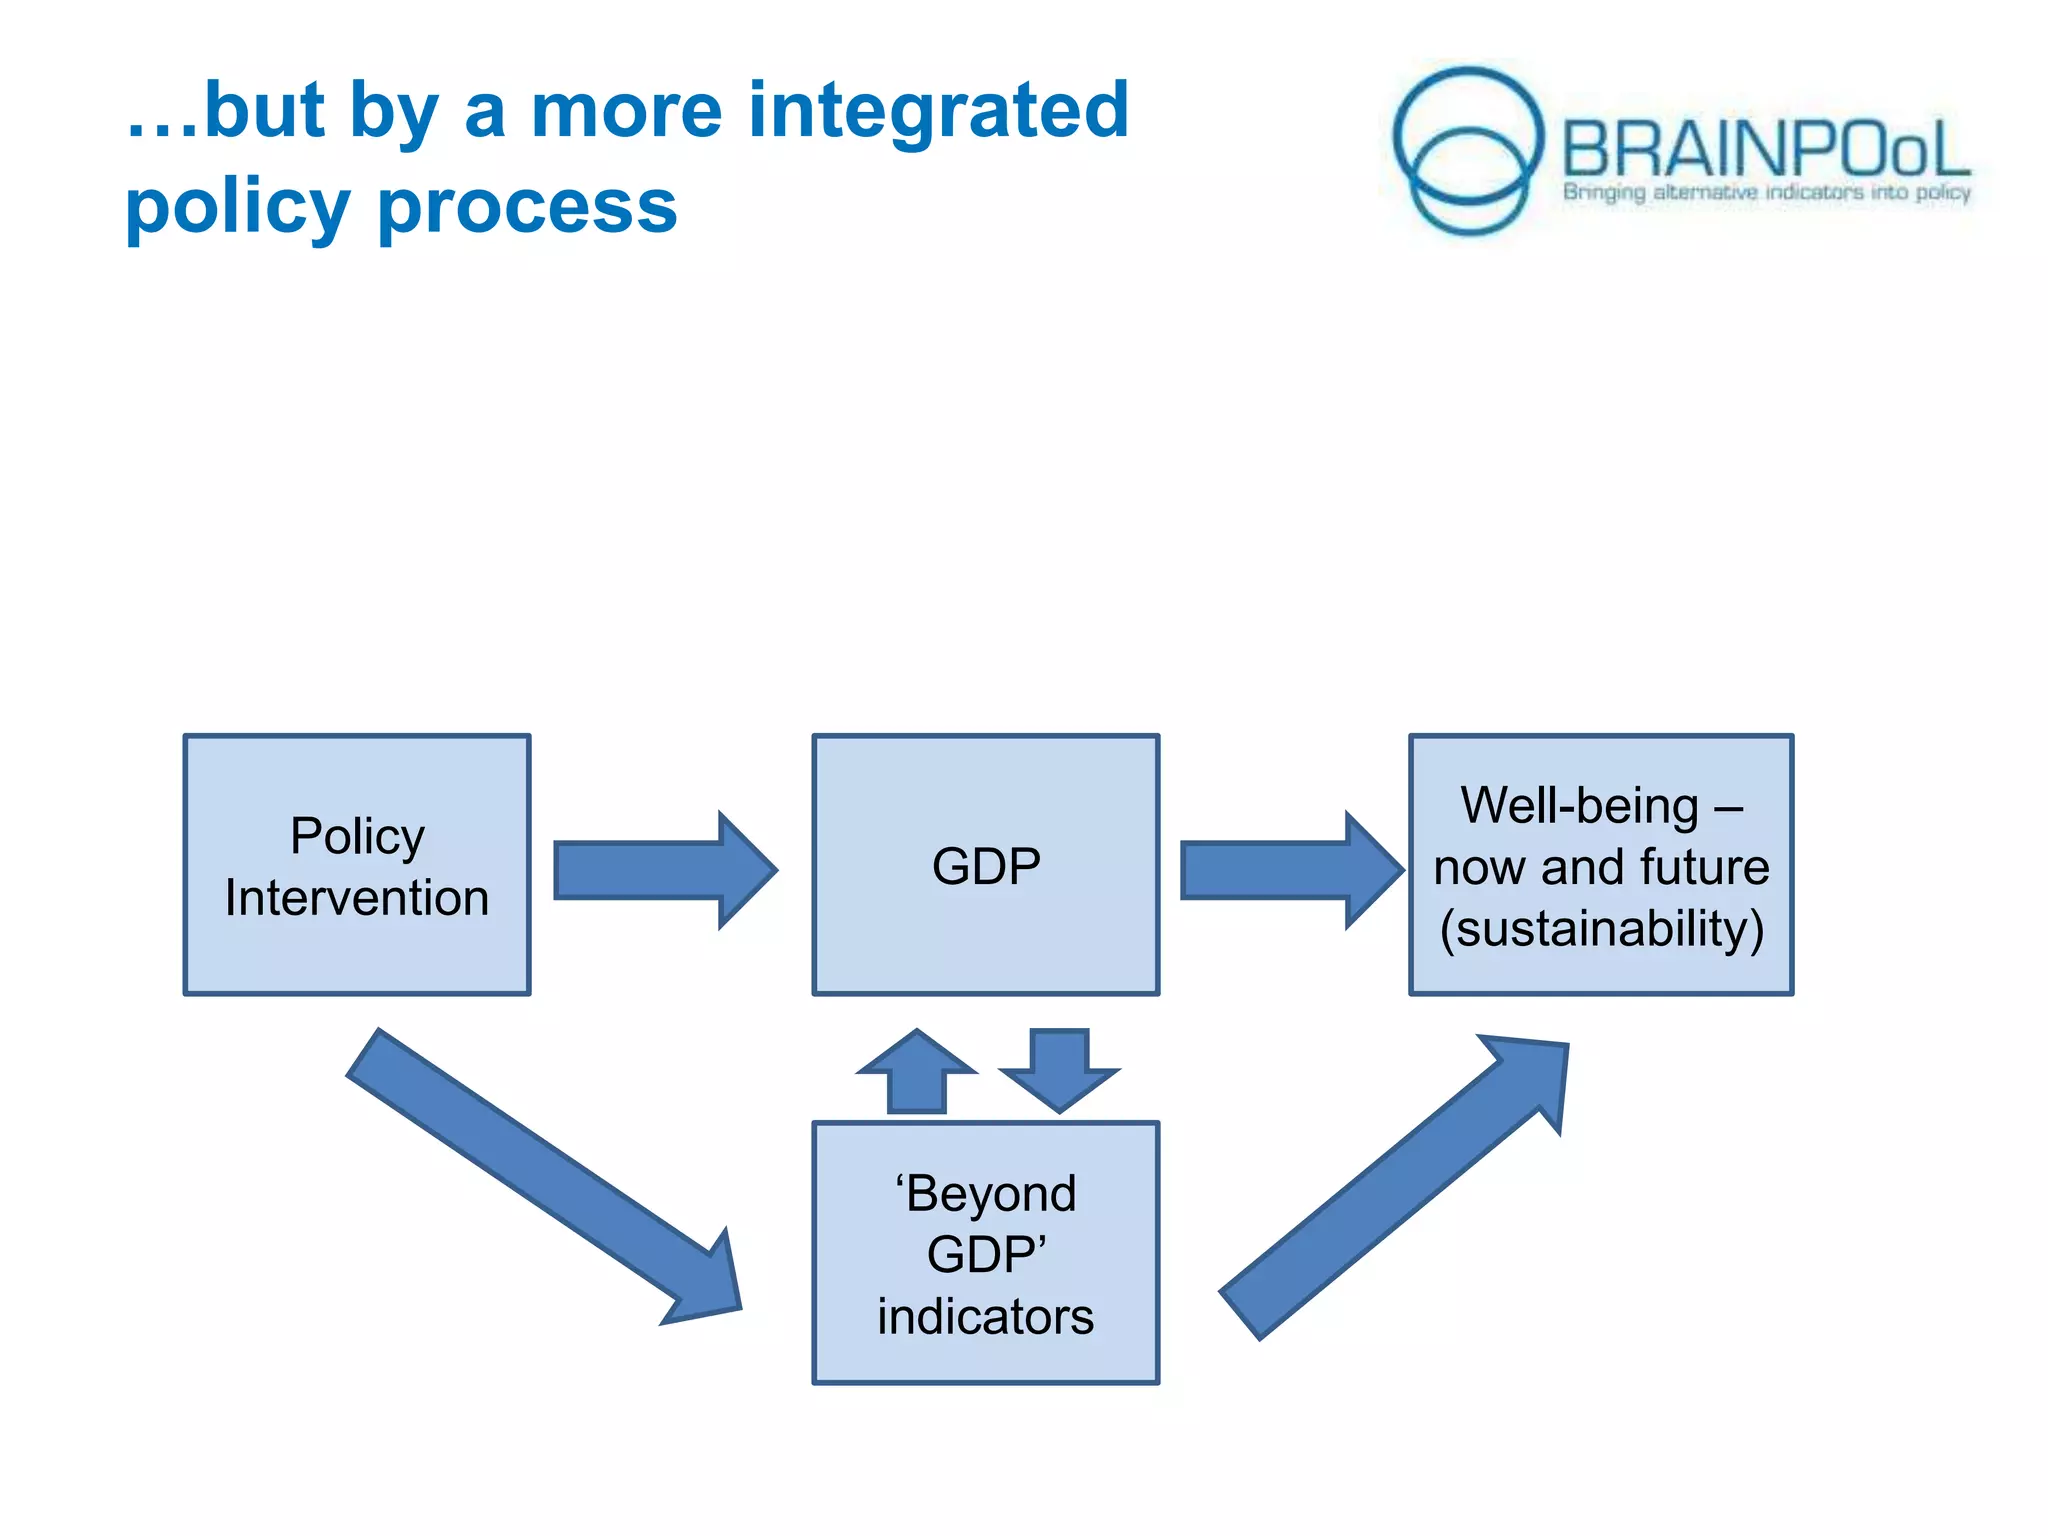
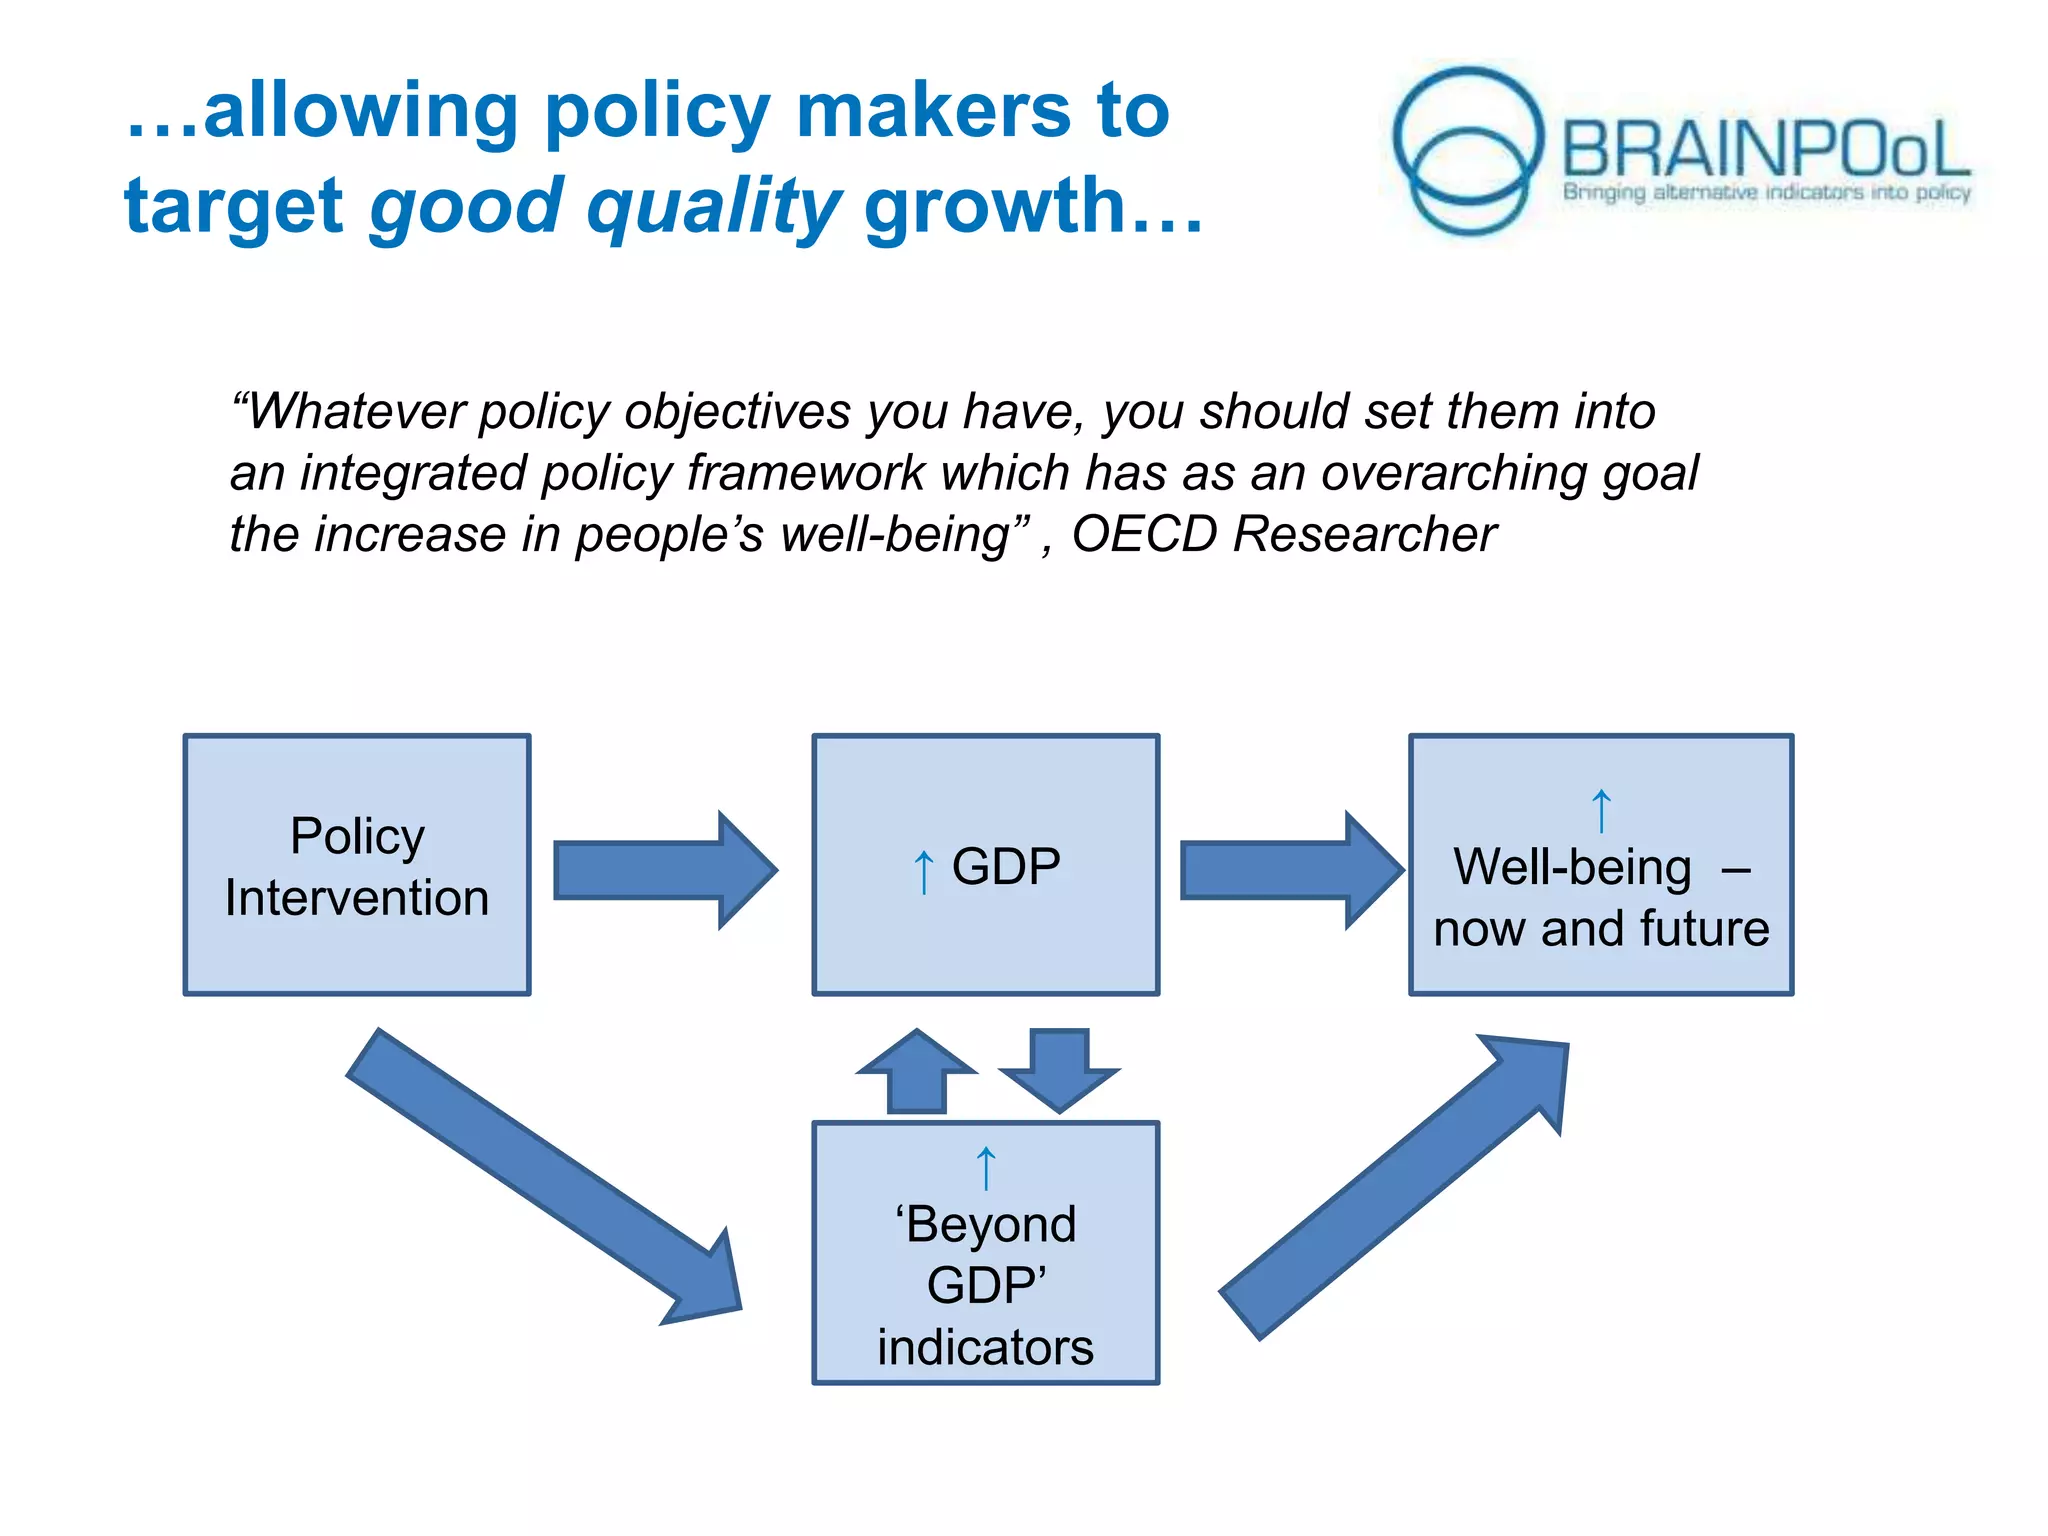
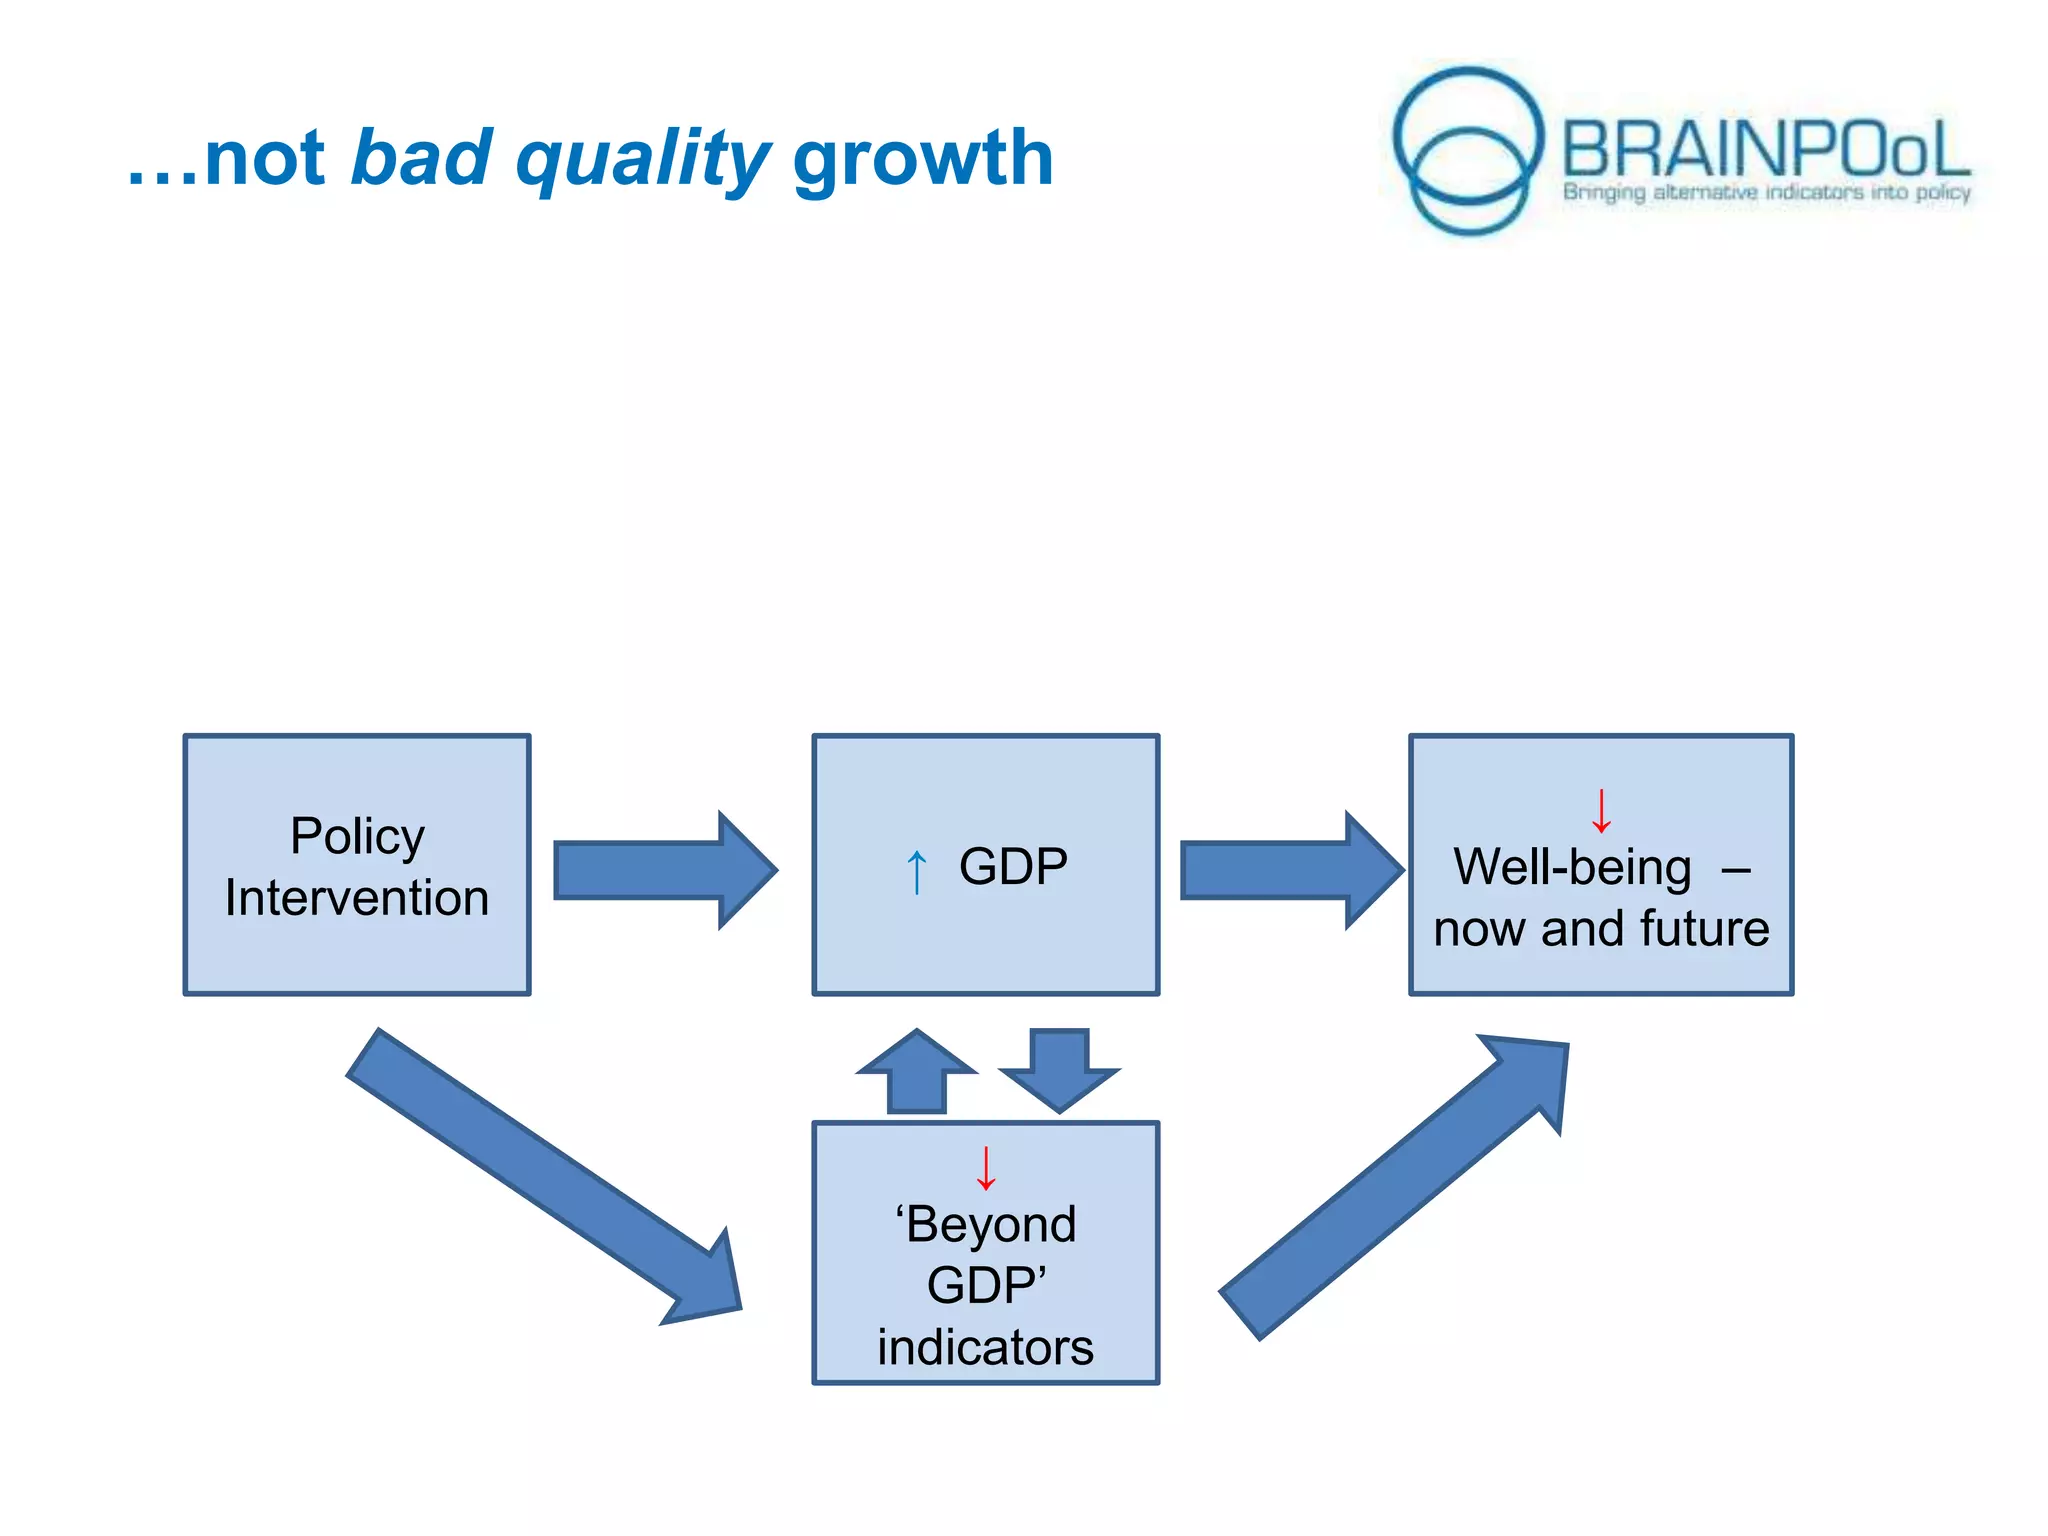
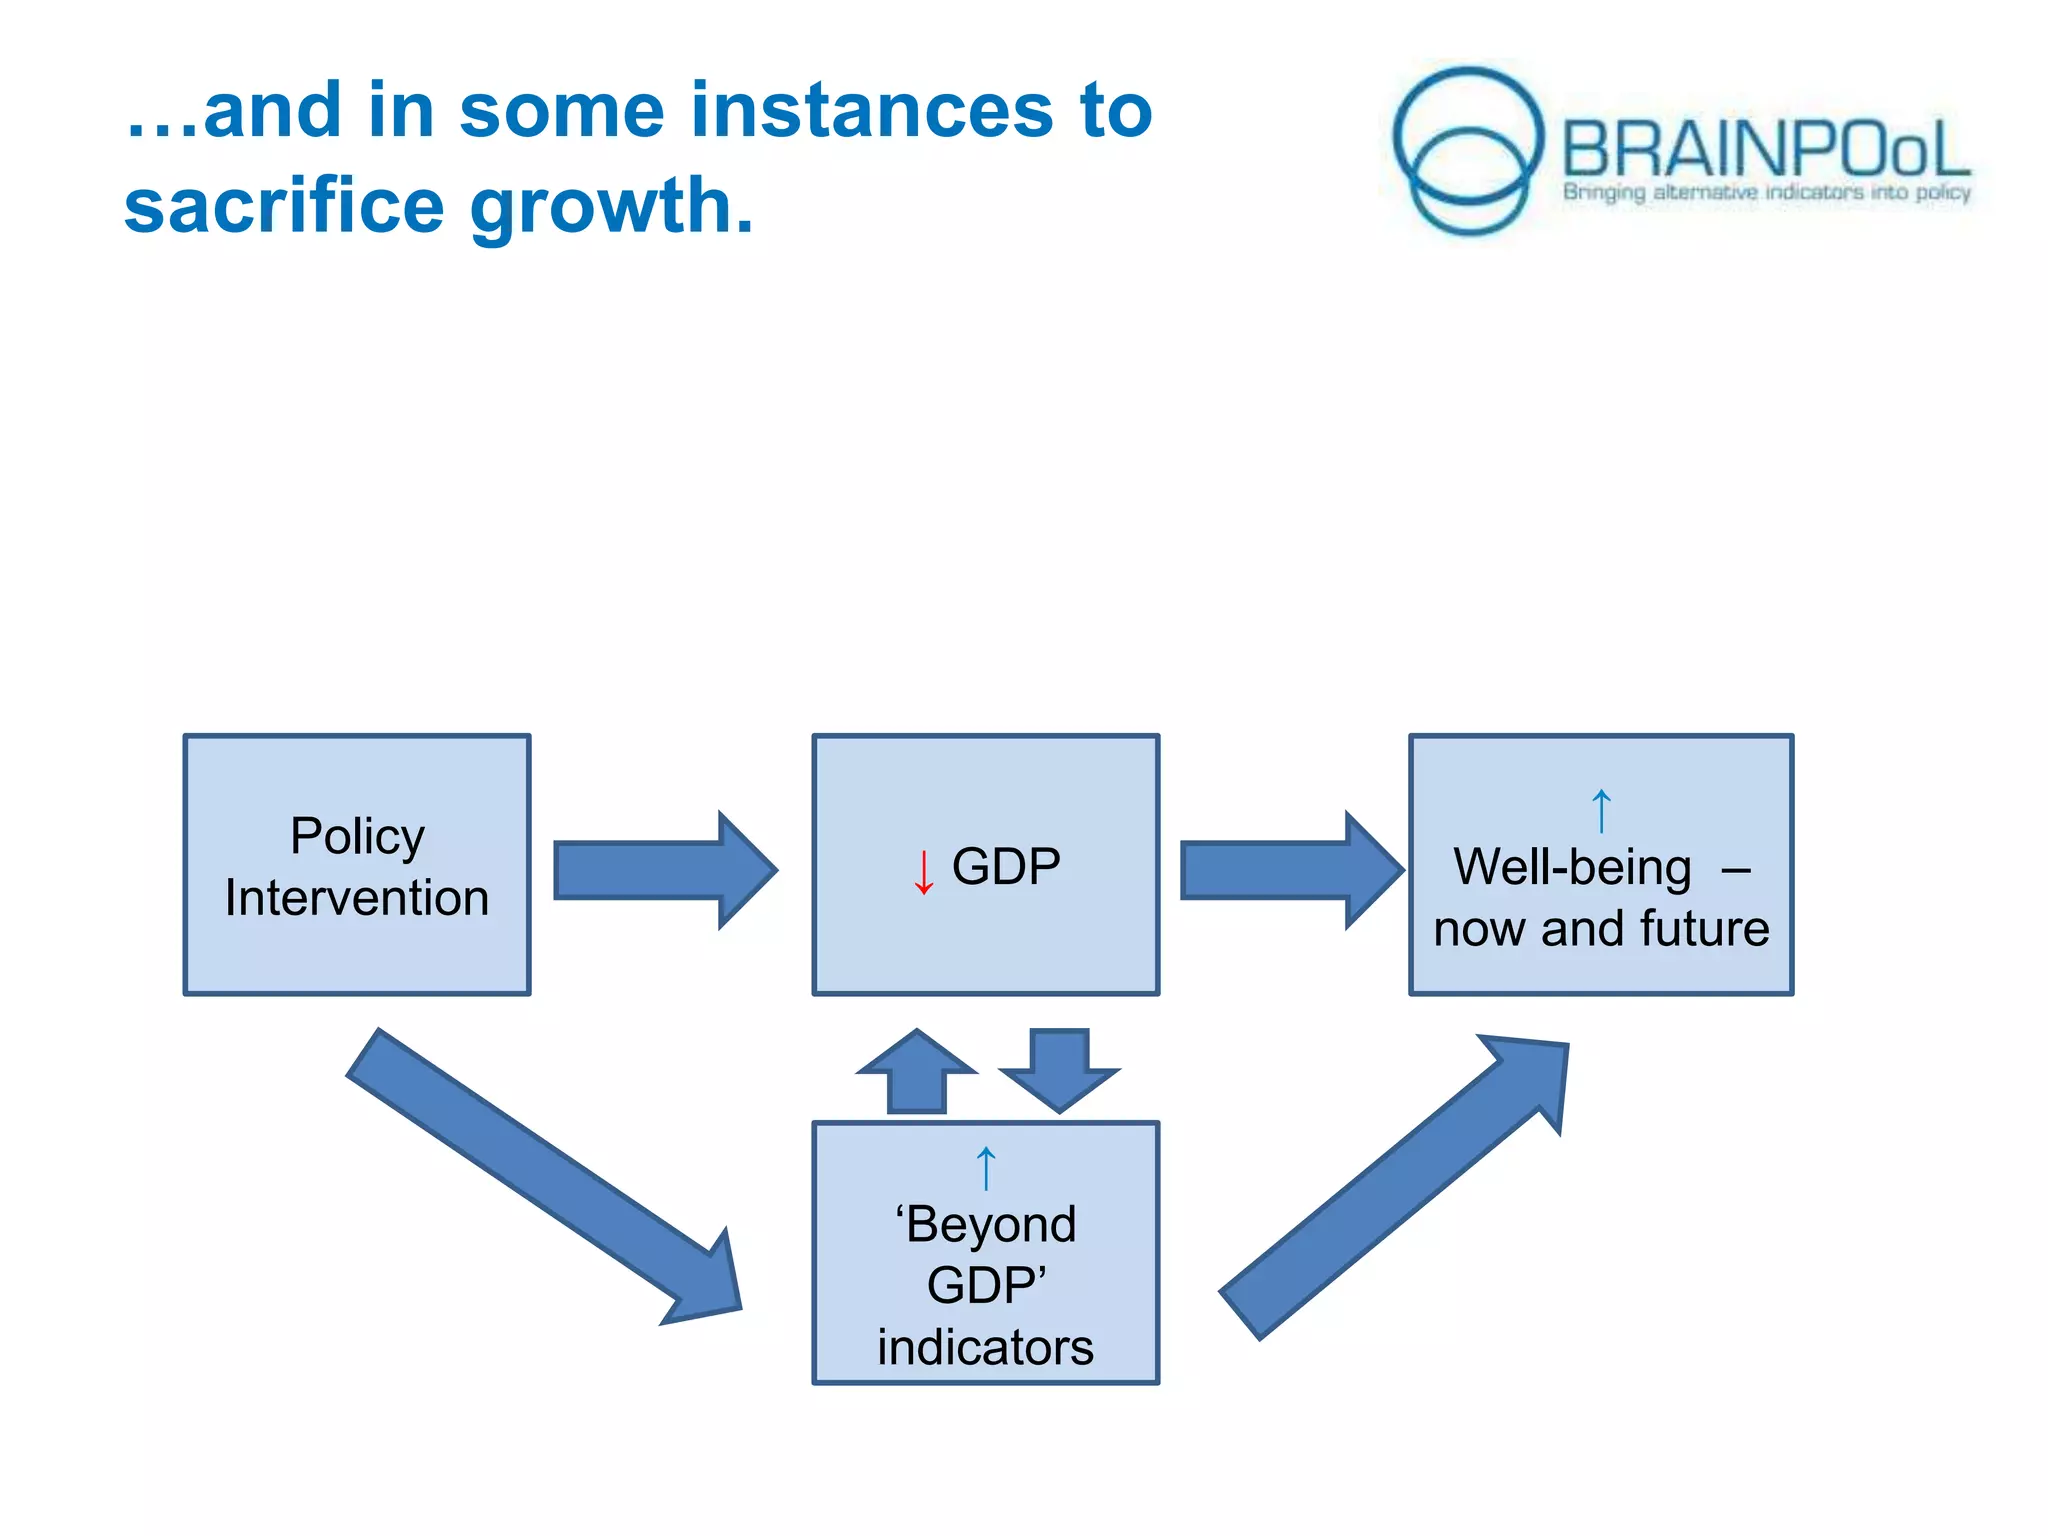
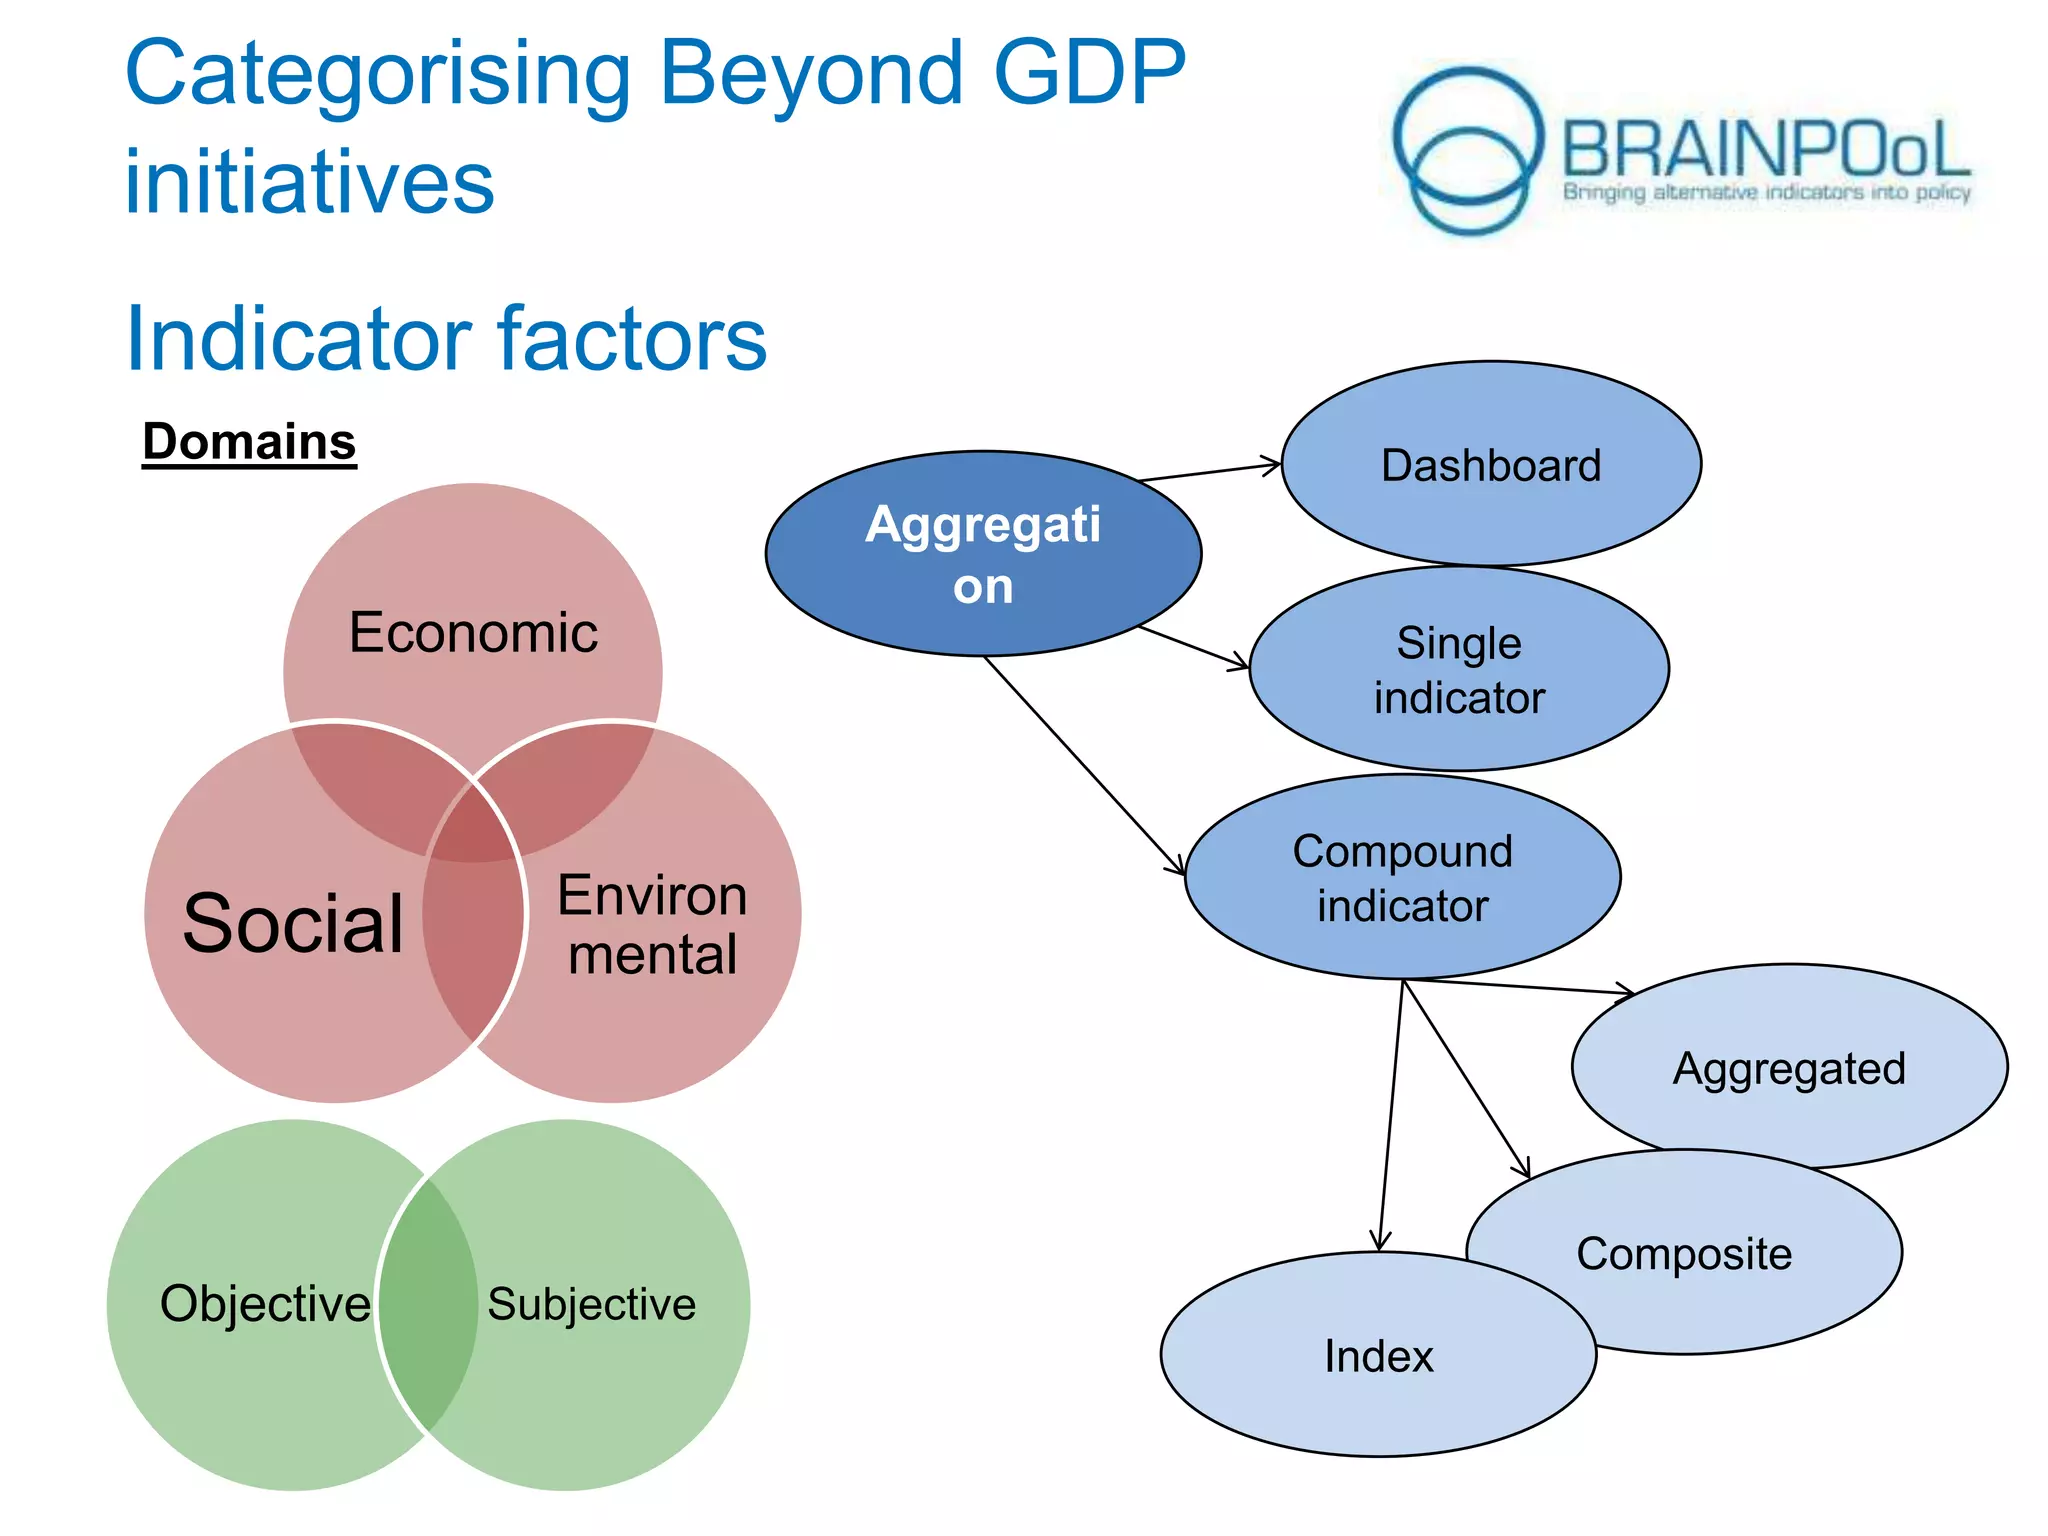
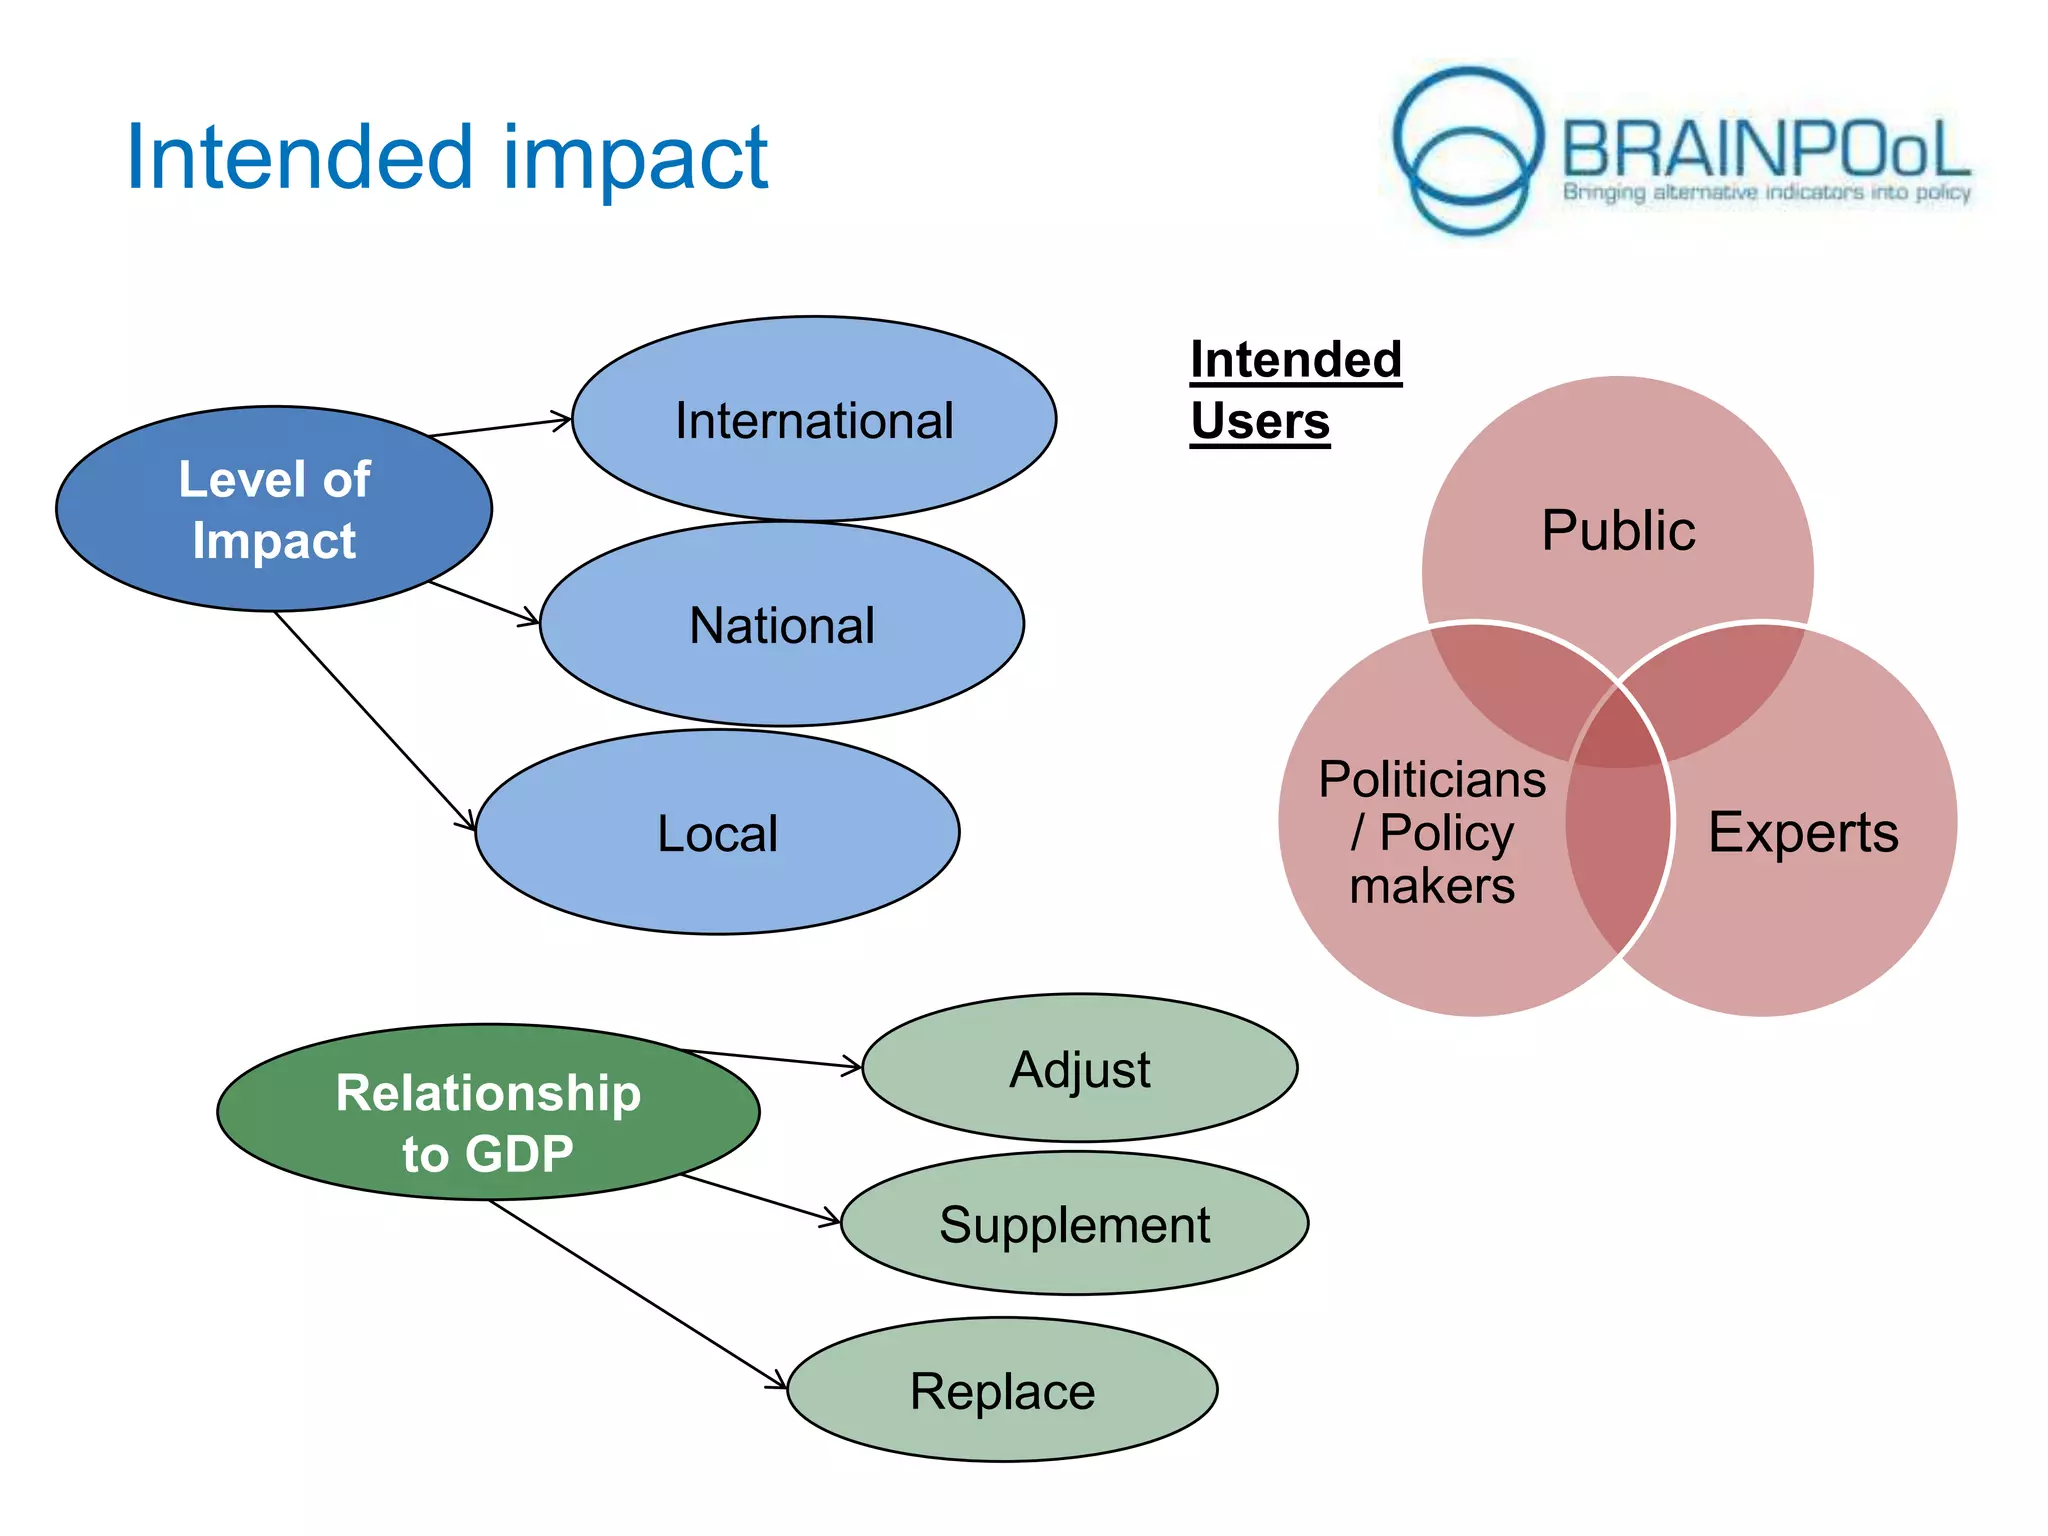
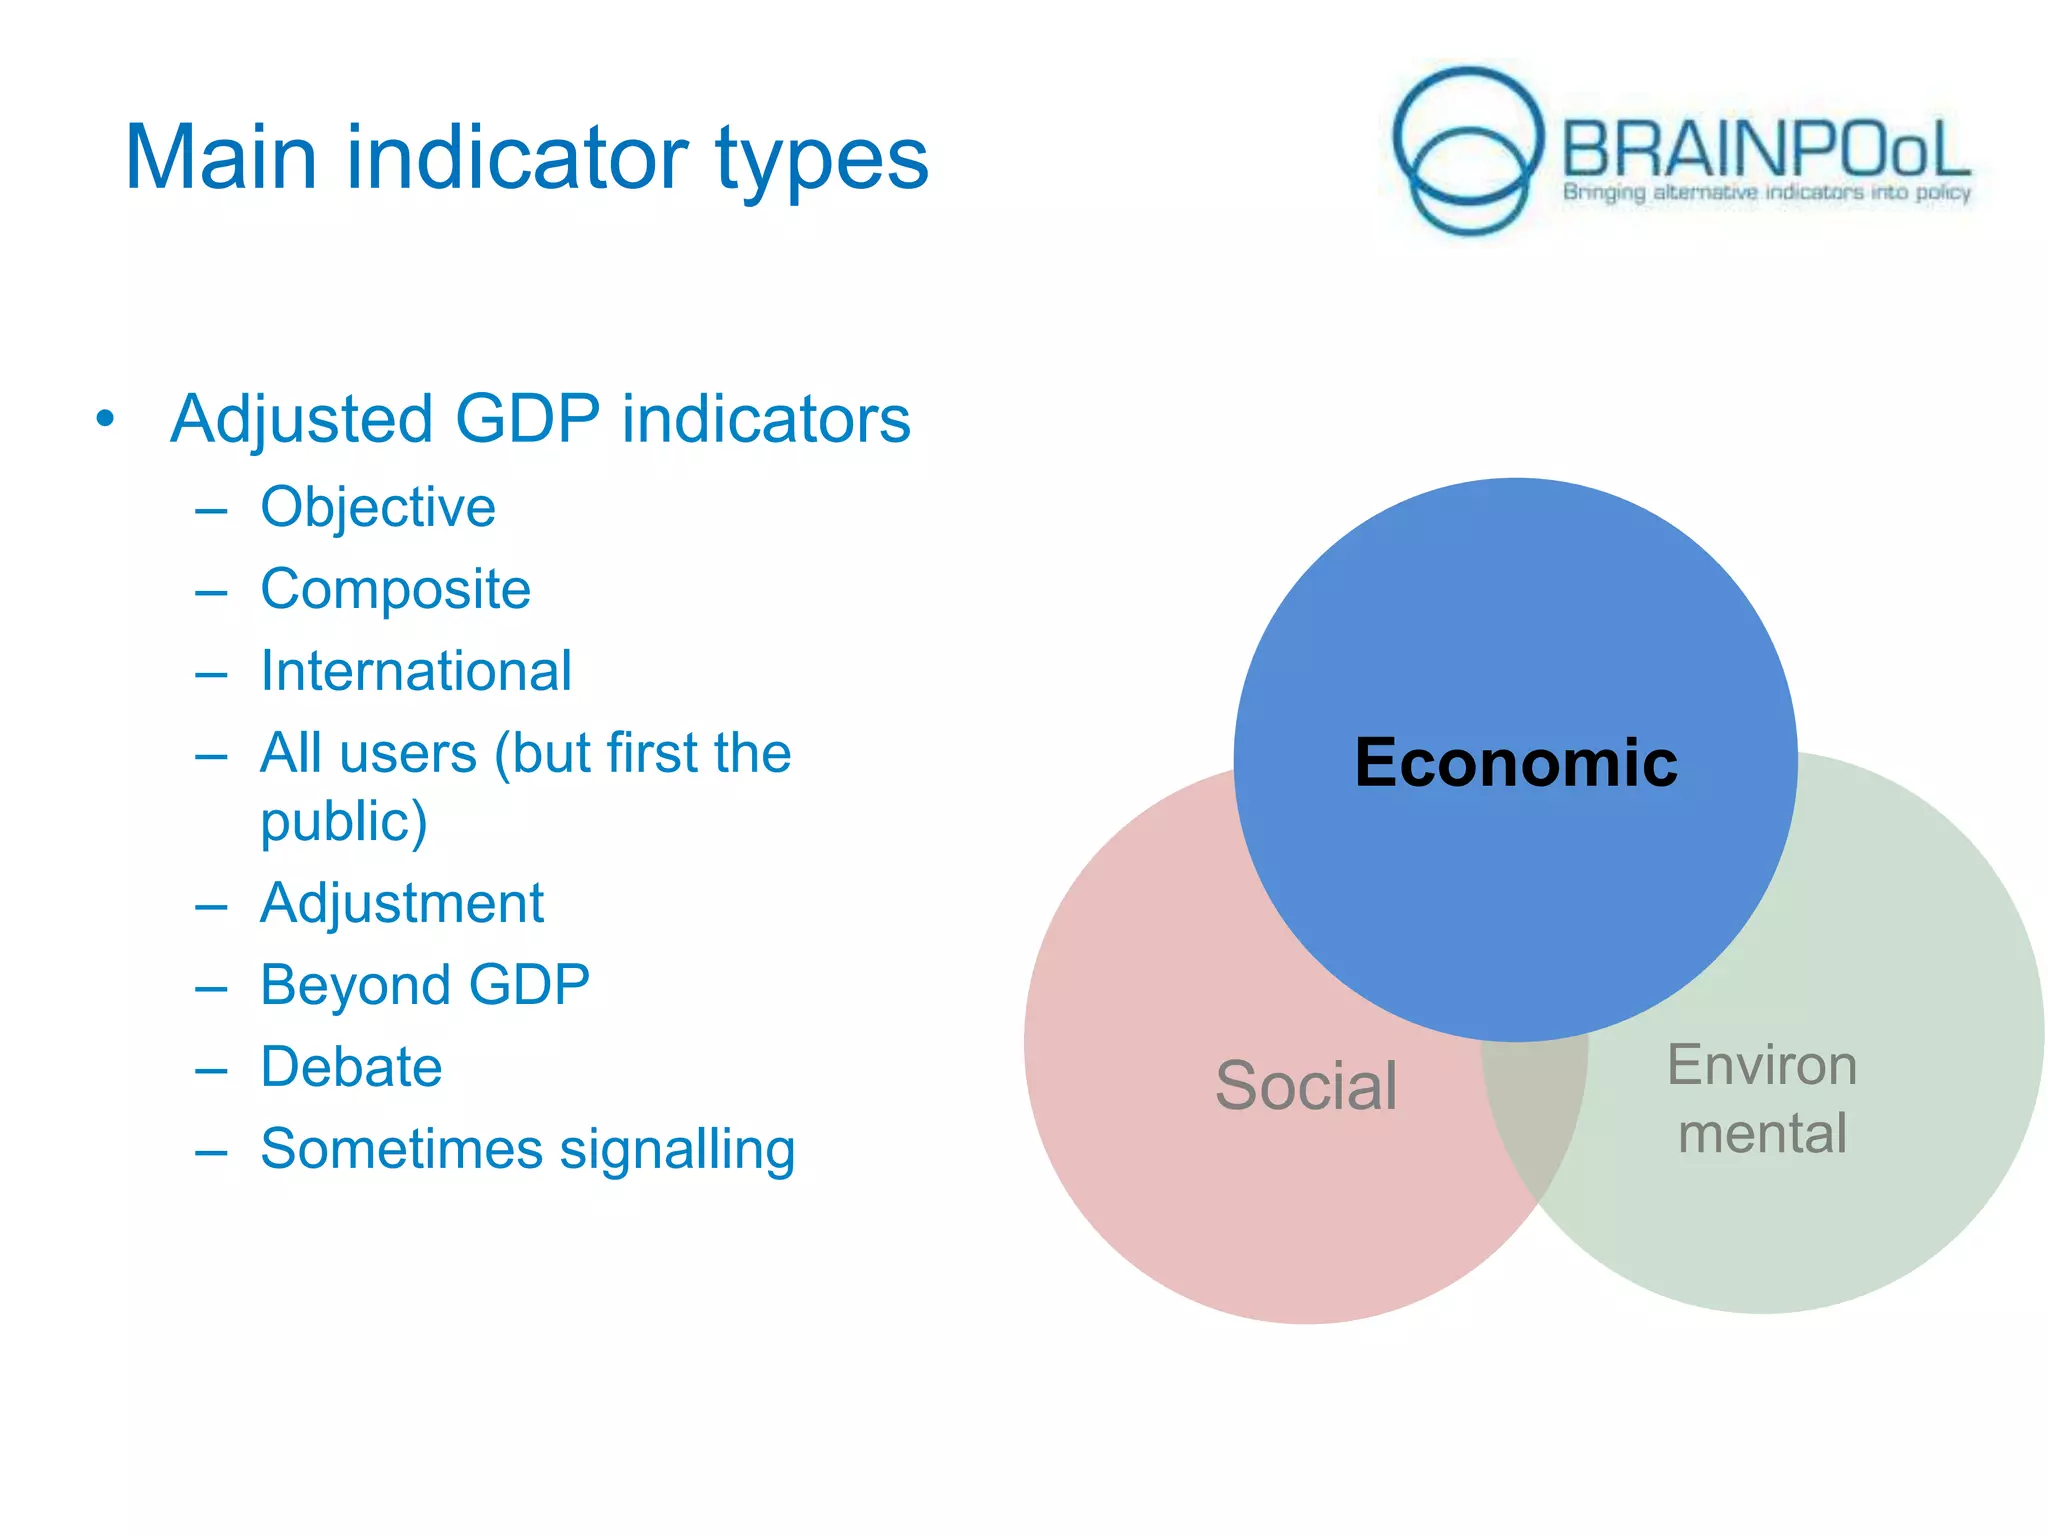
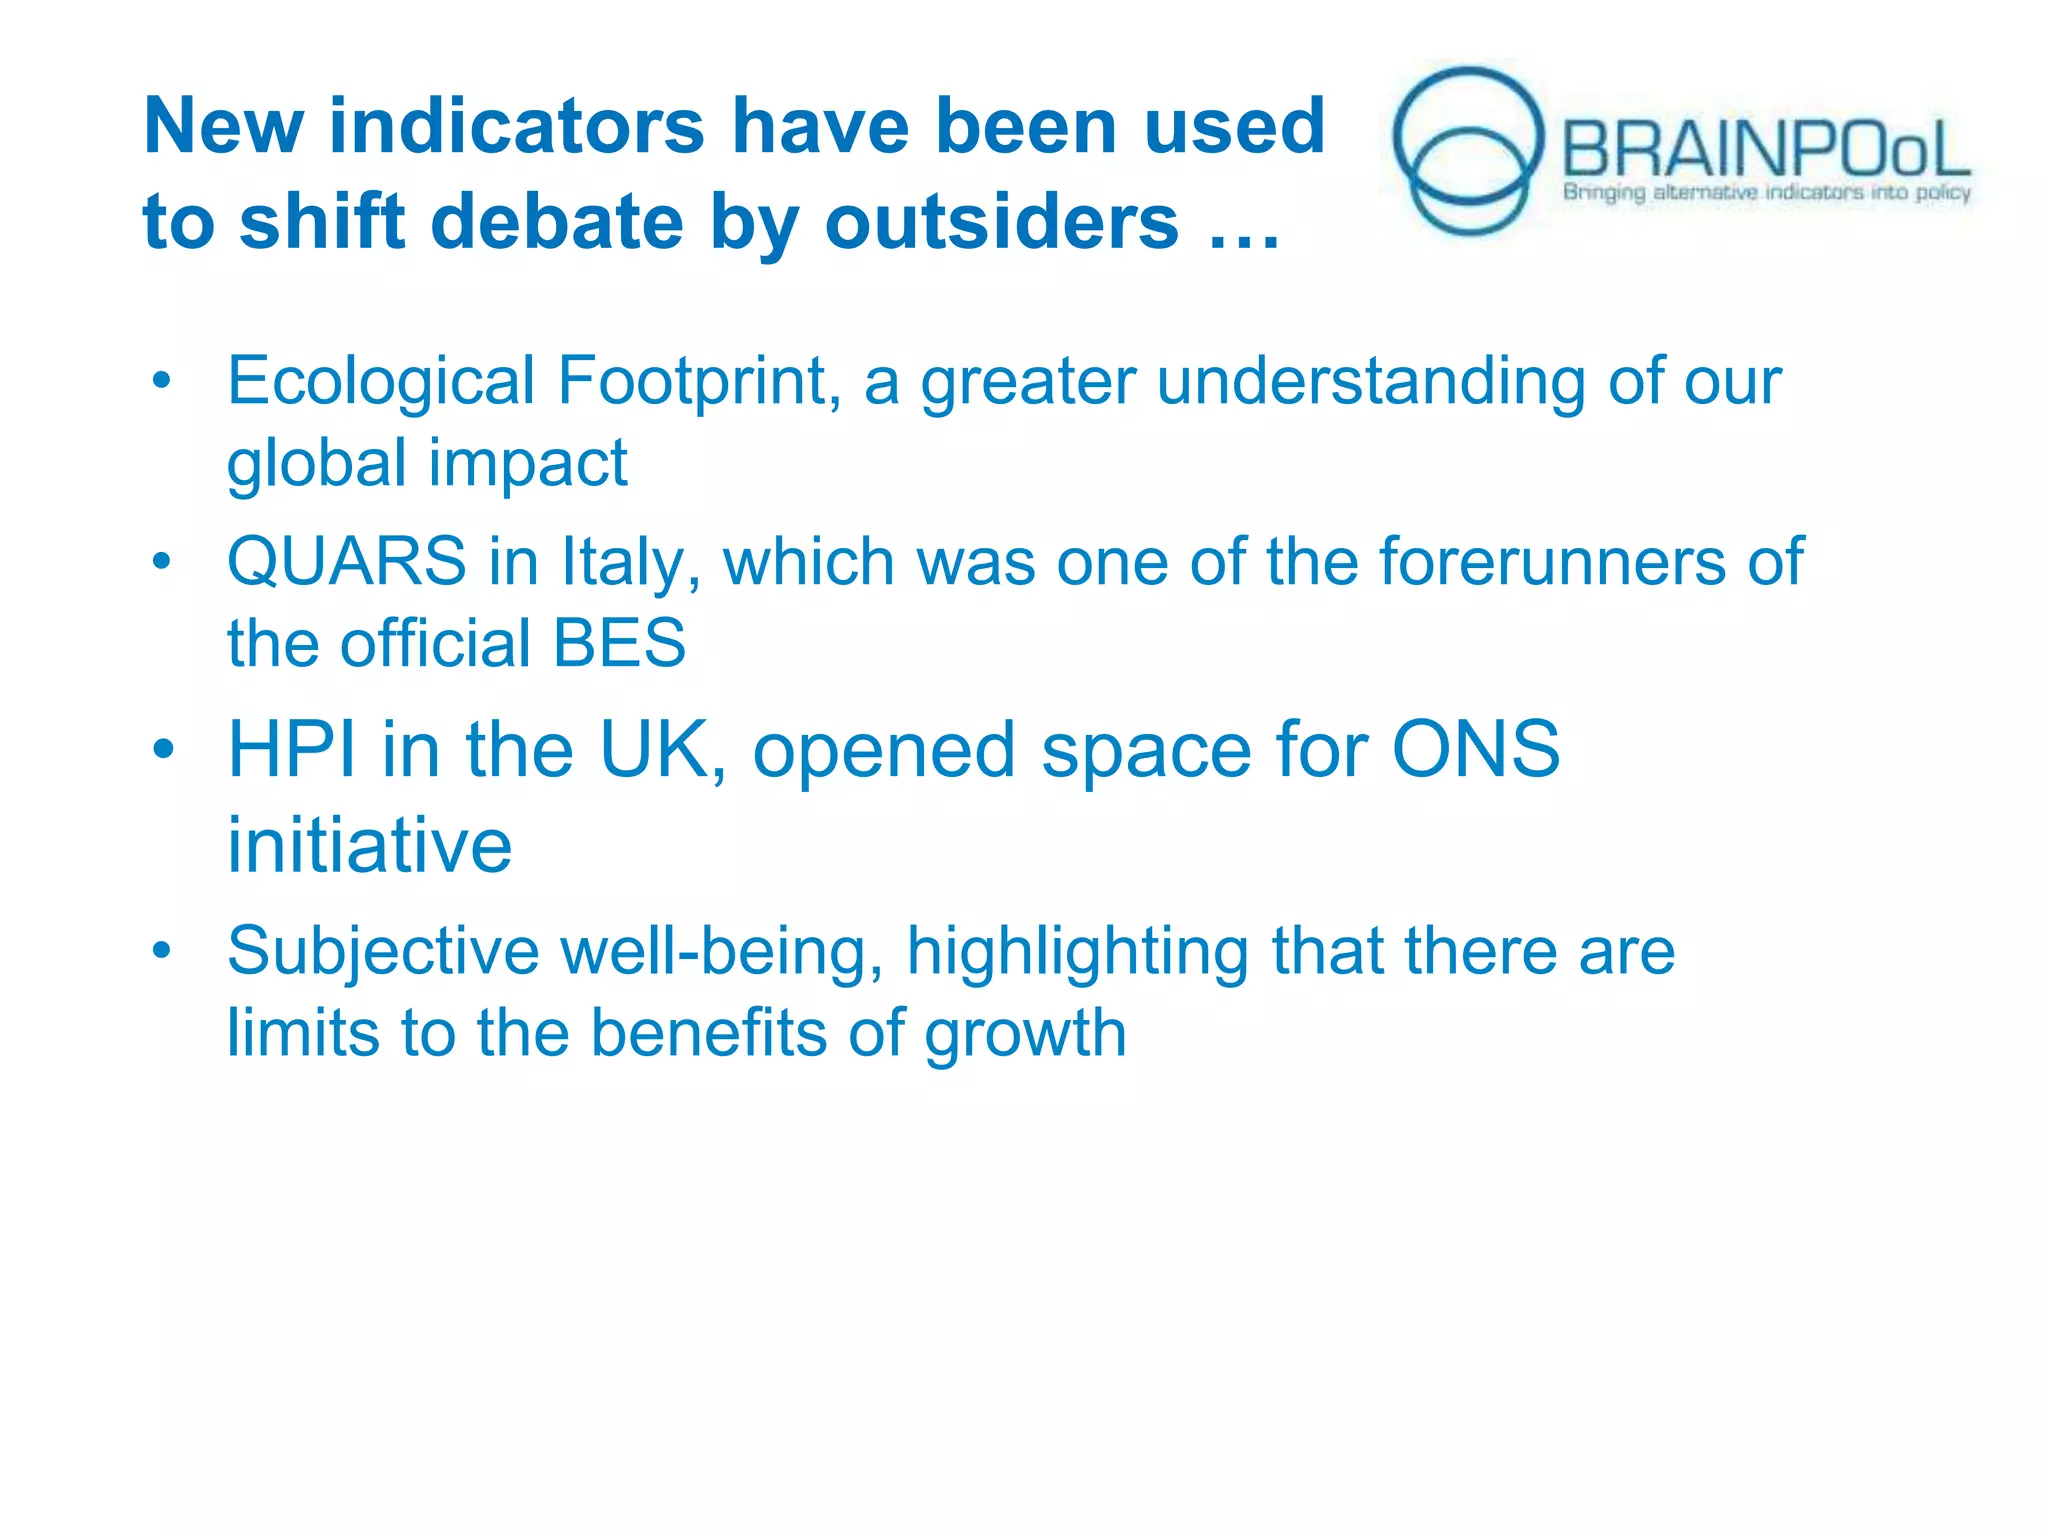
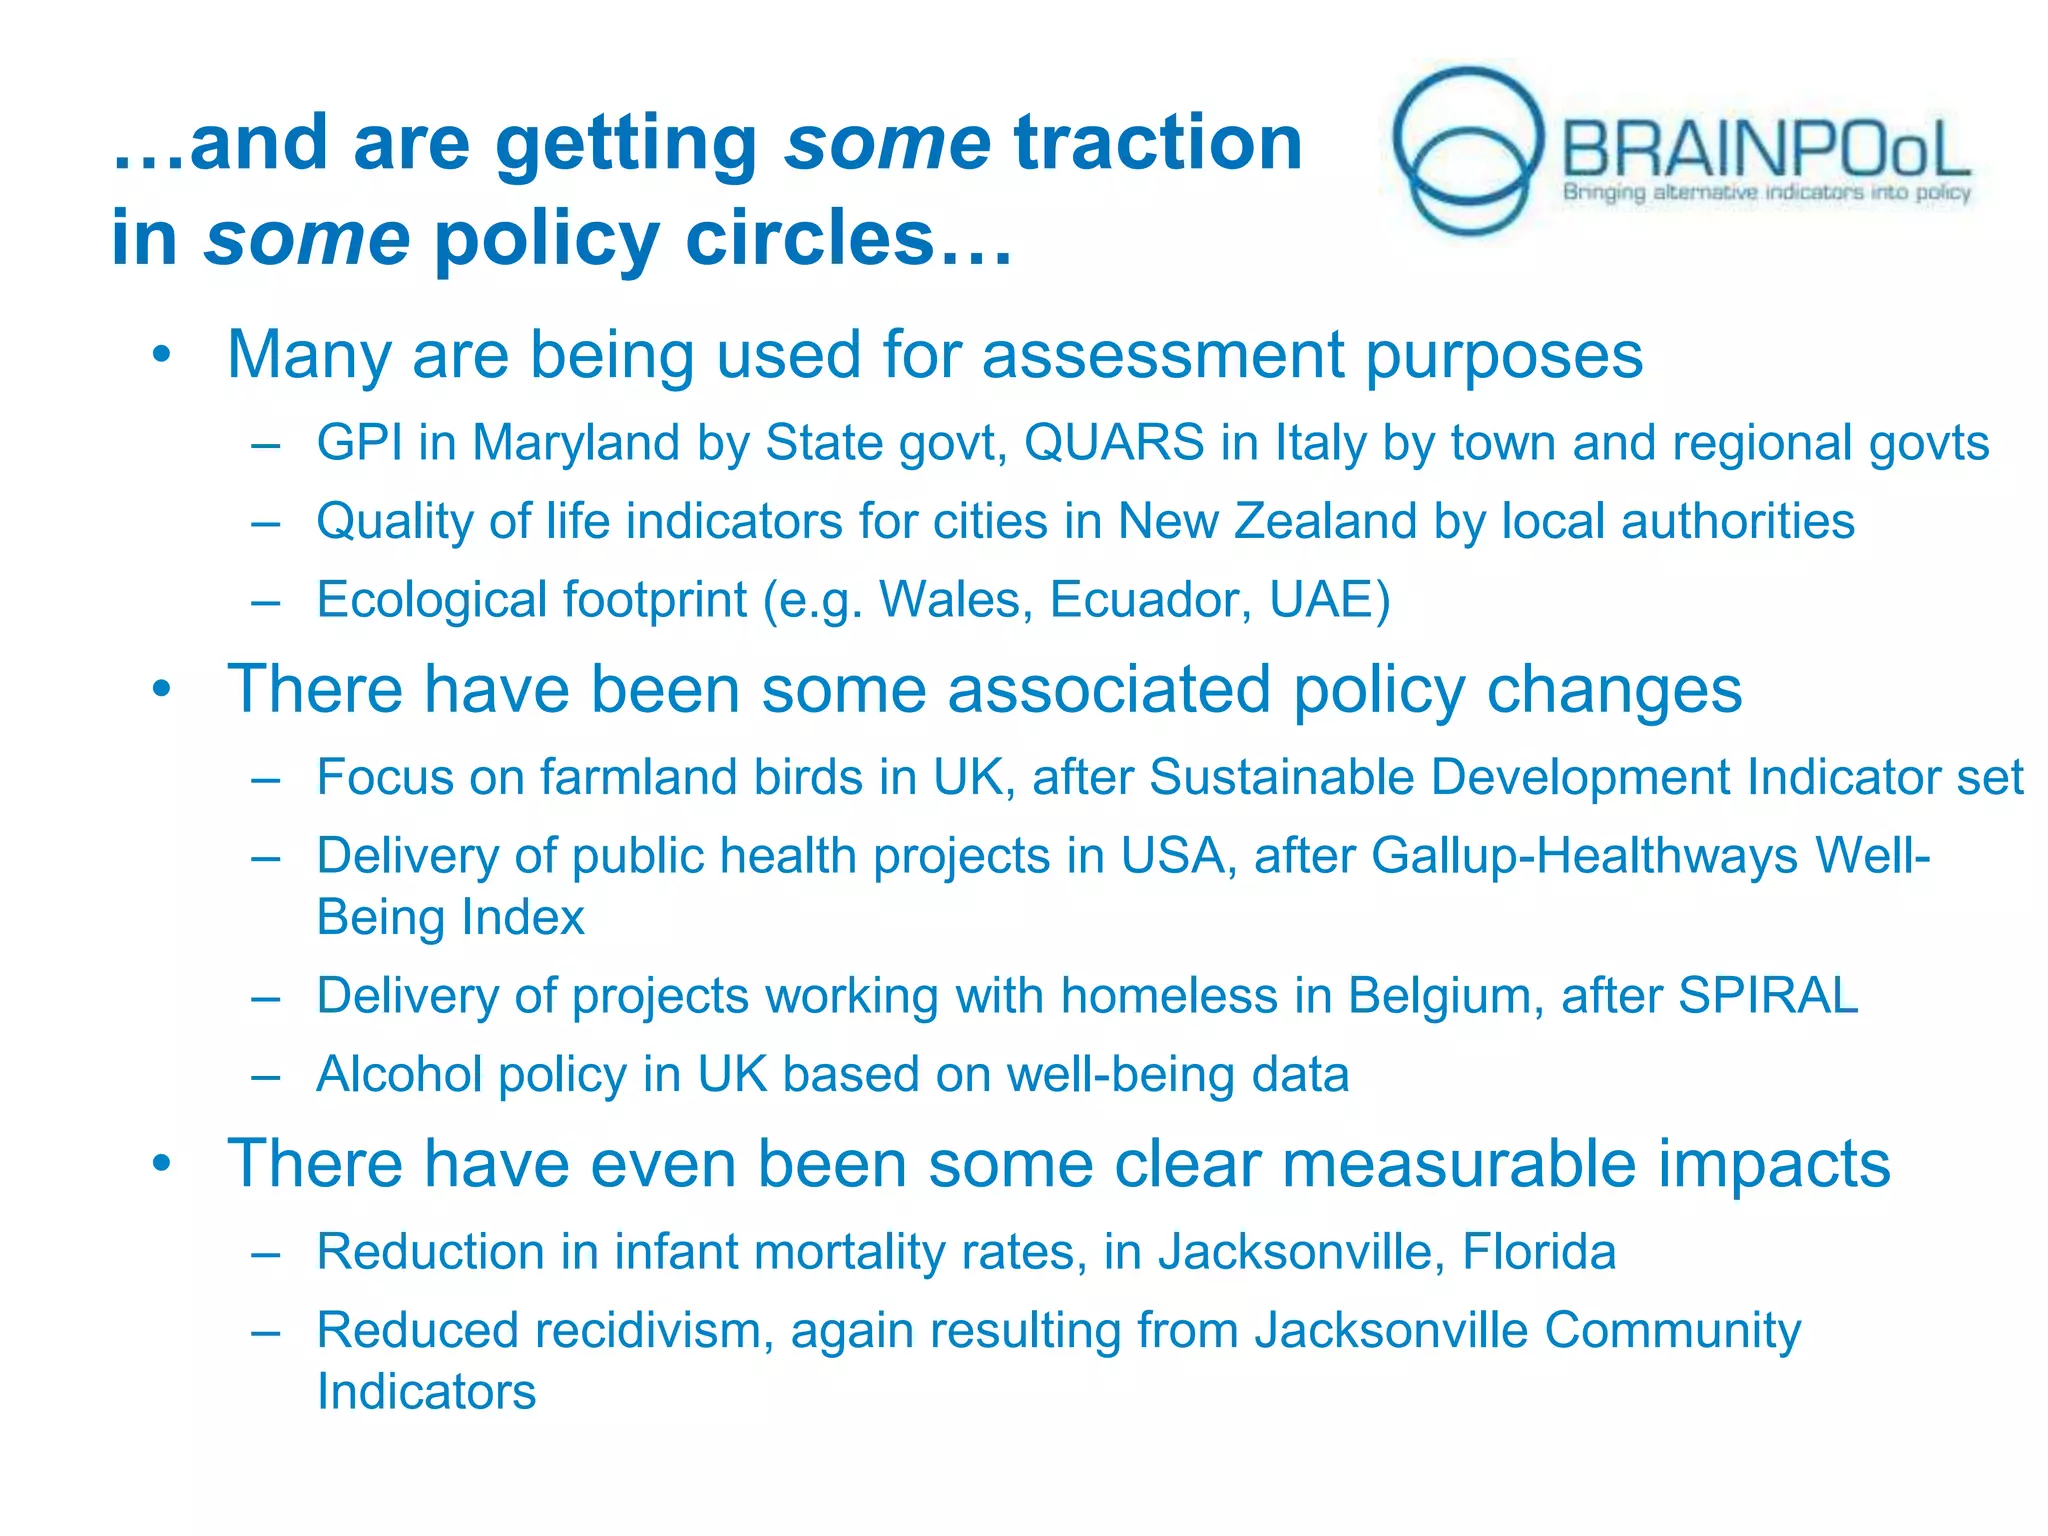
What is Beyond
GDP?
And how are
Beyond GDP
indicators used?

Funded by:
The Project
BRAINPOoL (Bringing alternative indicators into policy) is an
EU-funded project aimed at identifying and overcoming the
barriers to ‘Beyond GDP’ indicators being used in policy.
During the project we’ve carried out research and interviews,
conducting workshops and knowledge-brokerage seminars
and carrying out various action research case studies to
explore ways to improve uptake of Beyond GDP indicators.
What are indicators for (in
general)?
• Instrumental use
– Identifying and understanding problems
– Analysing policy options
– Evaluation

• Conceptual use
• Political use
– Legitimisation
– Tactical
– Symbolic
Outline

• Defining & understanding Beyond GDP
• Categorising Beyond GDP initiatives
• Impact to date of Beyond GDP
Our definition of Beyond GDP
indicators…

“those indicators and indicator sets that have
been proposed as necessary and central to
the measurement of societal progress in a
broad sense, other than those indicators,
such as GDP or the unemployment rate, that
are already playing this role.”
BRAINPOoL WP1 report
It is a response to a real and to
a measurement problem…
• There is a bias in policy making towards striving for GDP growth that
may make resolving critical political problems more difficult, e.g.
– How do we improve lives in an era of low growth and squeezed finance?
– How do we create good jobs for people?
– How do we reduce inequality?
– How do we avoid political extremism?
– How do we deal with climate change and other threats to sustainability?

• This bias is exacerbated by the prominence of the metric itself
– The ability to maximise GDP growth defines ‘economic competence’
– Perceptions of ‘economic competence’ drive elections
– Therefore particularly strong incentives to maximise GDP
…resulting in two
interdependent challenges
• Adoption of a new headline measure of progress (or a small set of
such measures)
– This can balance GDP and thus indicate a more balanced political programme

• Moves towards a more balanced political programme
– The effective management of trade offs leading to better quality growth (equitable,
sustainable, high well-being)

Prima facie, BRAINPOoL is about the first of these, but they are
interdependent: headline measures drive policy but real policy
implications make indicators salient.
The real and measurement problem just
defined focuses the discussion – as
illustrated in the following charts
The bias to GDP maximisation as
means to increasing well-being…

Policy
Intervention

Growth

Well-being
…will not be corrected by parallel
objectives, which already exist…

Economic
Policy

Growth

Well-being as
understood by
economics
depts

Other Policy
Interventions

Social/
environmental
objectives

Well-being as
understood by
other policy
depts
…as do the relevant indicators…

Economic
Policy

GDP

Other Policy
Interventions

Social/
environmental
indicators
…but by a more integrated
policy process

Policy
Intervention

GDP

‘Beyond
GDP’
indicators

Well-being –
now and future
(sustainability)
…allowing policy makers to
target good quality growth…
“Whatever policy objectives you have, you should set them into
an integrated policy framework which has as an overarching goal
the increase in people’s well-being” , OECD Researcher

Policy
Intervention

↑ GDP

↑
‘Beyond
GDP’
indicators

↑
Well-being –
now and future
…not bad quality growth

Policy
Intervention

↑ GDP

↓
‘Beyond
GDP’
indicators

↓
Well-being –
now and future
…and in some instances to
sacrifice growth.

Policy
Intervention

↓ GDP

↑
‘Beyond
GDP’
indicators

↑
Well-being –
now and future
Outline

• Defining & understanding Beyond GDP
• Categorising Beyond GDP initiatives
• Impact to date of Beyond GDP
Categorising Beyond GDP
initiatives
Indicator factors
Domains

Dashboard

Economic

Social

Environ
mental

Aggregati
on
Single
indicator
Compound
indicator

Aggregated

Composite

Objective

Subjective
Index
Intended impact
Intended
Users

International
Level of
Impact

Public
National
Politicians
/ Policy
makers

Local

Relationship
to GDP

Adjust
Supplement
Replace

Experts
Intended impact
•
•
•
•

Beyond GDP or not?
Policy or debate?
Democratic engagement
Internal or external signalling
Main indicator types
• Adjusted GDP indicators
–
–
–
–
–
–
–
–

Objective
Composite
International
All users (but first the
public)
Adjustment
Beyond GDP
Debate
Sometimes signalling

Economic

Social

Environ
mental
Main indicator types
• Quality of life
–
–
–
–
–
–
–

Objective
Dashboard or index
National
Public and policy-makers
Complement
Usually Beyond GDP
Sometimes policy,
sometimes debate

Economic

Social
Main indicator types
• Subjective approaches
–
–
–
–
–
–
–

Subjective
Subjective
Single number
WB
International
All
Replace/complement
Not always Beyond GDP
Policy and debate

Economic

Social

Environ
mental
Main indicator types
• Sustainable development
/ Progress / National WellBeing
–
–
–
–
–
–
–

Subjective and objective
Dashboard
National
Policy-makers (and public)
Complement (and include)
Not always Beyond GDP
Policy

Economic

Social

Environ
mental
Main indicator types
• Local initiatives
–
–
–
–
–
–
–
–

Subjective and objective
Mix of domains
Local
Policy-makers and public
Complement
Not always Beyond GDP
Policy & debate
Democratic engagement

Economic

Social

Environ
mental
Outline

• Defining & understanding Beyond GDP
• Categorising Beyond GDP initiatives
• Impact to date of Beyond GDP
The initiatives studied (of ~80)

Domestic Material
Consumption
Happy Life Years
OECD Handbook of
Subjective Well-Being
UN Commission for
Sustainable Development
New indicators have been used
to shift debate by outsiders …
• Ecological Footprint, a greater understanding of our
global impact
• QUARS in Italy, which was one of the forerunners of
the official BES

• HPI in the UK, opened space for ONS
initiative
• Subjective well-being, highlighting that there are
limits to the benefits of growth
…and are getting some traction
in some policy circles…
• Many are being used for assessment purposes
– GPI in Maryland by State govt, QUARS in Italy by town and regional govts
– Quality of life indicators for cities in New Zealand by local authorities

– Ecological footprint (e.g. Wales, Ecuador, UAE)

• There have been some associated policy changes
– Focus on farmland birds in UK, after Sustainable Development Indicator set
– Delivery of public health projects in USA, after Gallup-Healthways WellBeing Index
– Delivery of projects working with homeless in Belgium, after SPIRAL
– Alcohol policy in UK based on well-being data

• There have even been some clear measurable impacts
– Reduction in infant mortality rates, in Jacksonville, Florida
– Reduced recidivism, again resulting from Jacksonville Community
Indicators
... but mainly at local or regional
level – not in economics depts
• Local successes are easier because
– It is easier to bring stakeholders together
– Citizens feel more connected with their locality
– It is easier to bring different parts of local government together
– The focus is spatial planning and local services, not the economy

• Hence some of our examples
– Jacksonville Community Indicators in Florida, SPIRAL, Toronto’s
Vital Signs

• National examples are not ‘Beyond GDP’ impacts
– Alcohol, public health, service delivery, farmland birds

So that’s the challenge for today!
Saamah Abdallah, nef (the new economics foundation)
saamah.abdallah@neweconomics.org
Tomas Hak, Charles University Environment Centre (WP1)
tomas.hak@czp.cuni.cz
Charles Seaford, nef (the new economics foundation) (WP3)
charles.seaford@neweconomics.org
,
James Jordan

What is Beyond GDP? And how are Beyond GDP indicators used?

  • 1.
    What is Beyond GDP? Andhow are Beyond GDP indicators used? Funded by:
  • 2.
    The Project BRAINPOoL (Bringingalternative indicators into policy) is an EU-funded project aimed at identifying and overcoming the barriers to ‘Beyond GDP’ indicators being used in policy. During the project we’ve carried out research and interviews, conducting workshops and knowledge-brokerage seminars and carrying out various action research case studies to explore ways to improve uptake of Beyond GDP indicators.
  • 3.
    What are indicatorsfor (in general)? • Instrumental use – Identifying and understanding problems – Analysing policy options – Evaluation • Conceptual use • Political use – Legitimisation – Tactical – Symbolic
  • 4.
    Outline • Defining &understanding Beyond GDP • Categorising Beyond GDP initiatives • Impact to date of Beyond GDP
  • 5.
    Our definition ofBeyond GDP indicators… “those indicators and indicator sets that have been proposed as necessary and central to the measurement of societal progress in a broad sense, other than those indicators, such as GDP or the unemployment rate, that are already playing this role.” BRAINPOoL WP1 report
  • 6.
    It is aresponse to a real and to a measurement problem… • There is a bias in policy making towards striving for GDP growth that may make resolving critical political problems more difficult, e.g. – How do we improve lives in an era of low growth and squeezed finance? – How do we create good jobs for people? – How do we reduce inequality? – How do we avoid political extremism? – How do we deal with climate change and other threats to sustainability? • This bias is exacerbated by the prominence of the metric itself – The ability to maximise GDP growth defines ‘economic competence’ – Perceptions of ‘economic competence’ drive elections – Therefore particularly strong incentives to maximise GDP
  • 7.
    …resulting in two interdependentchallenges • Adoption of a new headline measure of progress (or a small set of such measures) – This can balance GDP and thus indicate a more balanced political programme • Moves towards a more balanced political programme – The effective management of trade offs leading to better quality growth (equitable, sustainable, high well-being) Prima facie, BRAINPOoL is about the first of these, but they are interdependent: headline measures drive policy but real policy implications make indicators salient.
  • 8.
    The real andmeasurement problem just defined focuses the discussion – as illustrated in the following charts
  • 9.
    The bias toGDP maximisation as means to increasing well-being… Policy Intervention Growth Well-being
  • 10.
    …will not becorrected by parallel objectives, which already exist… Economic Policy Growth Well-being as understood by economics depts Other Policy Interventions Social/ environmental objectives Well-being as understood by other policy depts
  • 11.
    …as do therelevant indicators… Economic Policy GDP Other Policy Interventions Social/ environmental indicators
  • 12.
    …but by amore integrated policy process Policy Intervention GDP ‘Beyond GDP’ indicators Well-being – now and future (sustainability)
  • 13.
    …allowing policy makersto target good quality growth… “Whatever policy objectives you have, you should set them into an integrated policy framework which has as an overarching goal the increase in people’s well-being” , OECD Researcher Policy Intervention ↑ GDP ↑ ‘Beyond GDP’ indicators ↑ Well-being – now and future
  • 14.
    …not bad qualitygrowth Policy Intervention ↑ GDP ↓ ‘Beyond GDP’ indicators ↓ Well-being – now and future
  • 15.
    …and in someinstances to sacrifice growth. Policy Intervention ↓ GDP ↑ ‘Beyond GDP’ indicators ↑ Well-being – now and future
  • 16.
    Outline • Defining &understanding Beyond GDP • Categorising Beyond GDP initiatives • Impact to date of Beyond GDP
  • 17.
    Categorising Beyond GDP initiatives Indicatorfactors Domains Dashboard Economic Social Environ mental Aggregati on Single indicator Compound indicator Aggregated Composite Objective Subjective Index
  • 18.
    Intended impact Intended Users International Level of Impact Public National Politicians /Policy makers Local Relationship to GDP Adjust Supplement Replace Experts
  • 19.
    Intended impact • • • • Beyond GDPor not? Policy or debate? Democratic engagement Internal or external signalling
  • 20.
    Main indicator types •Adjusted GDP indicators – – – – – – – – Objective Composite International All users (but first the public) Adjustment Beyond GDP Debate Sometimes signalling Economic Social Environ mental
  • 21.
    Main indicator types •Quality of life – – – – – – – Objective Dashboard or index National Public and policy-makers Complement Usually Beyond GDP Sometimes policy, sometimes debate Economic Social
  • 22.
    Main indicator types •Subjective approaches – – – – – – – Subjective Subjective Single number WB International All Replace/complement Not always Beyond GDP Policy and debate Economic Social Environ mental
  • 23.
    Main indicator types •Sustainable development / Progress / National WellBeing – – – – – – – Subjective and objective Dashboard National Policy-makers (and public) Complement (and include) Not always Beyond GDP Policy Economic Social Environ mental
  • 24.
    Main indicator types •Local initiatives – – – – – – – – Subjective and objective Mix of domains Local Policy-makers and public Complement Not always Beyond GDP Policy & debate Democratic engagement Economic Social Environ mental
  • 25.
    Outline • Defining &understanding Beyond GDP • Categorising Beyond GDP initiatives • Impact to date of Beyond GDP
  • 26.
    The initiatives studied(of ~80) Domestic Material Consumption Happy Life Years OECD Handbook of Subjective Well-Being UN Commission for Sustainable Development
  • 27.
    New indicators havebeen used to shift debate by outsiders … • Ecological Footprint, a greater understanding of our global impact • QUARS in Italy, which was one of the forerunners of the official BES • HPI in the UK, opened space for ONS initiative • Subjective well-being, highlighting that there are limits to the benefits of growth
  • 28.
    …and are gettingsome traction in some policy circles… • Many are being used for assessment purposes – GPI in Maryland by State govt, QUARS in Italy by town and regional govts – Quality of life indicators for cities in New Zealand by local authorities – Ecological footprint (e.g. Wales, Ecuador, UAE) • There have been some associated policy changes – Focus on farmland birds in UK, after Sustainable Development Indicator set – Delivery of public health projects in USA, after Gallup-Healthways WellBeing Index – Delivery of projects working with homeless in Belgium, after SPIRAL – Alcohol policy in UK based on well-being data • There have even been some clear measurable impacts – Reduction in infant mortality rates, in Jacksonville, Florida – Reduced recidivism, again resulting from Jacksonville Community Indicators
  • 29.
    ... but mainlyat local or regional level – not in economics depts • Local successes are easier because – It is easier to bring stakeholders together – Citizens feel more connected with their locality – It is easier to bring different parts of local government together – The focus is spatial planning and local services, not the economy • Hence some of our examples – Jacksonville Community Indicators in Florida, SPIRAL, Toronto’s Vital Signs • National examples are not ‘Beyond GDP’ impacts – Alcohol, public health, service delivery, farmland birds So that’s the challenge for today!
  • 30.
    Saamah Abdallah, nef(the new economics foundation) saamah.abdallah@neweconomics.org Tomas Hak, Charles University Environment Centre (WP1) tomas.hak@czp.cuni.cz Charles Seaford, nef (the new economics foundation) (WP3) charles.seaford@neweconomics.org , James Jordan