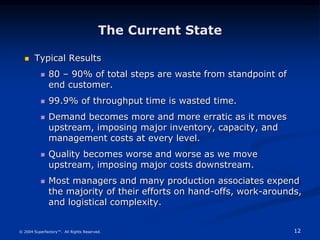
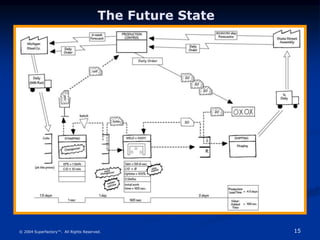
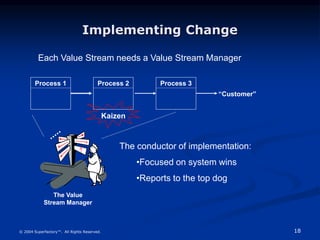
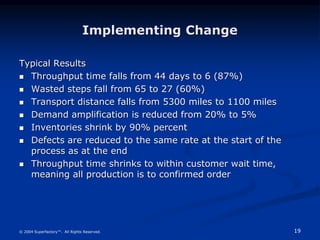
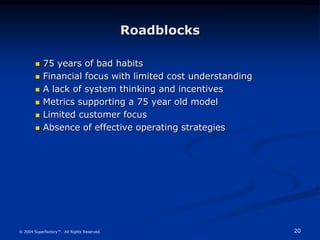
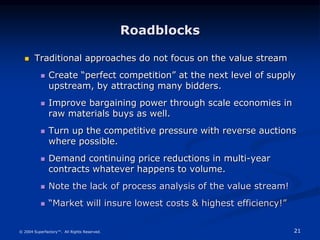
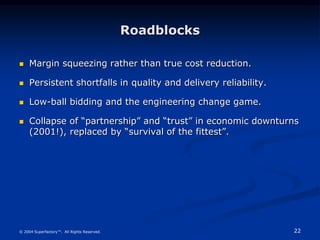
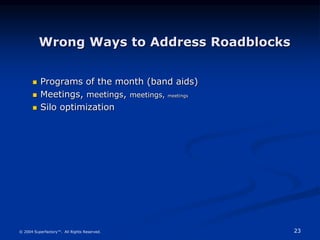
1
© 2004 Superfactory™. All Rights Reserved.
Value Streams
2
© 2004 Superfactory™. All Rights Reserved.
Outline
 What are Value Streams?
 Identifying the Value Streams
 Value Stream Mapping
 The Current State
 The Future State
 Implementing Change
 Roadblocks
3
© 2004 Superfactory™. All Rights Reserved.
What Are Value Streams?
A Value Stream is the set of all actions (both value added
and non value added) required to bring a specific product
or service from raw material through to the customer.
4
© 2004 Superfactory™. All Rights Reserved.
Types of Value Streams
•“Whenever there is a product (or service) for a customer,
• there is a value stream. The challenge lies in seeing it.”
• 3 enterprise value streams:
 Raw Materials to Customer - Manufacturing
 Concept to Launch - Engineering
 Order to Cash - Administrative Functions
5
© 2004 Superfactory™. All Rights Reserved.
Identifying the Value Stream
 The starting point is to learn to distinguish value creation
from waste in your whole value stream
 By putting on waste glasses!
 By choosing a product family
 By assembling the team and taking a walk together up the
value stream
 And drawing a map of what you find!
6
© 2004 Superfactory™. All Rights Reserved.
Value Stream Mapping
 Helps you visualize more than the single process level
 Links the material and information flows
 Provides a common language
 Provides a blueprint for implementation
 More useful than quantitative tools
 Ties together lean concepts and techniques
7
© 2004 Superfactory™. All Rights Reserved.
Value Stream Mapping
• Follow a “product” or “service” from beginning to end,
and draw a visual representation of every process in the
material & information flow.
• Then, draw (using icons) a “future state” map of how
value should flow.
8
© 2004 Superfactory™. All Rights Reserved.
The Current State
Typical Steps to Complete a Current State Drawing
 Document customer information
 Complete a quick walk through to identify the main
processes (i.e., how many process boxes)
 Fill in data boxes, draw inventory triangles, and count
inventory
 Document supplier information
 Establish information flow: how does each process know
what to make next?
 Identify where material is being pushed
 Quantify production lead time vs. processing time
9
© 2004 Superfactory™. All Rights Reserved.
The Current State
 Where and how large are the inventories in the physical
flow?
Hint: Carefully distinguish buffer stocks, safety stocks, and
shipping stocks. Then determine “standard inventory” for
current system design and capabilities.
10
© 2004 Superfactory™. All Rights Reserved.
The Current State
 How reliable is each transport link (on-time delivery
percentage) and how many expediting trips per year are
needed?
Note: By multiplying quality data from by on-time delivery
data you can calculate the “fulfillment level” each facility as
perceived by the next downstream customer. The is a key
measure from a total value stream perspective.
11
© 2004 Superfactory™. All Rights Reserved.
The Current State
12
© 2004 Superfactory™. All Rights Reserved.
The Current State
 Typical Results
 80 – 90% of total steps are waste from standpoint of
end customer.
 99.9% of throughput time is wasted time.
 Demand becomes more and more erratic as it moves
upstream, imposing major inventory, capacity, and
management costs at every level.
 Quality becomes worse and worse as we move
upstream, imposing major costs downstream.
 Most managers and many production associates expend
the majority of their efforts on hand-offs, work-arounds,
and logistical complexity.
13
© 2004 Superfactory™. All Rights Reserved.
The Future State
Completed in a day with the same team
Focused on:
 Creating a flexible, reactive system that quickly adapts to
changing customer needs
 Eliminating waste
 Creating flow
 Producing on demand
14
© 2004 Superfactory™. All Rights Reserved.
The Future State
 Activities aligned with our business strategy
 Efforts focused on NET improvements for the company
 Metrics supportive of fundamental change
 Simple, constant communication of our plans and
achievements as an enterprise
15
© 2004 Superfactory™. All Rights Reserved.
The Future State
16
© 2004 Superfactory™. All Rights Reserved.
Don’t Wait!
You need a plan!
• Tie it to your business objectives.
• Make a VS Plan: What to do by when.
• Establish an appropriate review frequency.
• Conduct VS Reviews walking the flow.
Implementing Change
17
© 2004 Superfactory™. All Rights Reserved.
Implementing Change
Critical Success Factors
 Management must understand, embrace, and lead the
organization into lean thinking
 Value stream managers must be empowered and
enabled to manage implementations
 Improvements must be planned in detail with the
cross functional Kaizen teams
 Successes must be translated to the bottom line
and/or market share
18
© 2004 Superfactory™. All Rights Reserved.
Implementing Change
Each Value Stream needs a Value Stream Manager
The conductor of implementation:
•Focused on system wins
•Reports to the top dog
Process 1 Process 2 Process 3
“Customer”
The Value
Stream Manager
Kaizen
19
© 2004 Superfactory™. All Rights Reserved.
Implementing Change
Typical Results
 Throughput time falls from 44 days to 6 (87%)
 Wasted steps fall from 65 to 27 (60%)
 Transport distance falls from 5300 miles to 1100 miles
 Demand amplification is reduced from 20% to 5%
 Inventories shrink by 90% percent
 Defects are reduced to the same rate at the start of the
process as at the end
 Throughput time shrinks to within customer wait time,
meaning all production is to confirmed order
20
© 2004 Superfactory™. All Rights Reserved.
Roadblocks
 75 years of bad habits
 Financial focus with limited cost understanding
 A lack of system thinking and incentives
 Metrics supporting a 75 year old model
 Limited customer focus
 Absence of effective operating strategies
21
© 2004 Superfactory™. All Rights Reserved.
Roadblocks
 Traditional approaches do not focus on the value stream
 Create “perfect competition” at the next level of supply
upstream, by attracting many bidders.
 Improve bargaining power through scale economies in
raw materials buys as well.
 Turn up the competitive pressure with reverse auctions
where possible.
 Demand continuing price reductions in multi-year
contracts whatever happens to volume.
 Note the lack of process analysis of the value stream!
 “Market will insure lowest costs & highest efficiency!”
22
© 2004 Superfactory™. All Rights Reserved.
Roadblocks
 Margin squeezing rather than true cost reduction.
 Persistent shortfalls in quality and delivery reliability.
 Low-ball bidding and the engineering change game.
 Collapse of “partnership” and “trust” in economic downturns
(2001!), replaced by “survival of the fittest”.
23
© 2004 Superfactory™. All Rights Reserved.
Wrong Ways to Address Roadblocks
 Programs of the month (band aids)
 Meetings, meetings, meetings, meetings
 Silo optimization

Value Streams.ppt

  • 1.
    1 © 2004 Superfactory™.All Rights Reserved. Value Streams
  • 2.
    2 © 2004 Superfactory™.All Rights Reserved. Outline  What are Value Streams?  Identifying the Value Streams  Value Stream Mapping  The Current State  The Future State  Implementing Change  Roadblocks
  • 3.
    3 © 2004 Superfactory™.All Rights Reserved. What Are Value Streams? A Value Stream is the set of all actions (both value added and non value added) required to bring a specific product or service from raw material through to the customer.
  • 4.
    4 © 2004 Superfactory™.All Rights Reserved. Types of Value Streams •“Whenever there is a product (or service) for a customer, • there is a value stream. The challenge lies in seeing it.” • 3 enterprise value streams:  Raw Materials to Customer - Manufacturing  Concept to Launch - Engineering  Order to Cash - Administrative Functions
  • 5.
    5 © 2004 Superfactory™.All Rights Reserved. Identifying the Value Stream  The starting point is to learn to distinguish value creation from waste in your whole value stream  By putting on waste glasses!  By choosing a product family  By assembling the team and taking a walk together up the value stream  And drawing a map of what you find!
  • 6.
    6 © 2004 Superfactory™.All Rights Reserved. Value Stream Mapping  Helps you visualize more than the single process level  Links the material and information flows  Provides a common language  Provides a blueprint for implementation  More useful than quantitative tools  Ties together lean concepts and techniques
  • 7.
    7 © 2004 Superfactory™.All Rights Reserved. Value Stream Mapping • Follow a “product” or “service” from beginning to end, and draw a visual representation of every process in the material & information flow. • Then, draw (using icons) a “future state” map of how value should flow.
  • 8.
    8 © 2004 Superfactory™.All Rights Reserved. The Current State Typical Steps to Complete a Current State Drawing  Document customer information  Complete a quick walk through to identify the main processes (i.e., how many process boxes)  Fill in data boxes, draw inventory triangles, and count inventory  Document supplier information  Establish information flow: how does each process know what to make next?  Identify where material is being pushed  Quantify production lead time vs. processing time
  • 9.
    9 © 2004 Superfactory™.All Rights Reserved. The Current State  Where and how large are the inventories in the physical flow? Hint: Carefully distinguish buffer stocks, safety stocks, and shipping stocks. Then determine “standard inventory” for current system design and capabilities.
  • 10.
    10 © 2004 Superfactory™.All Rights Reserved. The Current State  How reliable is each transport link (on-time delivery percentage) and how many expediting trips per year are needed? Note: By multiplying quality data from by on-time delivery data you can calculate the “fulfillment level” each facility as perceived by the next downstream customer. The is a key measure from a total value stream perspective.
  • 11.
    11 © 2004 Superfactory™.All Rights Reserved. The Current State
  • 12.
    12 © 2004 Superfactory™.All Rights Reserved. The Current State  Typical Results  80 – 90% of total steps are waste from standpoint of end customer.  99.9% of throughput time is wasted time.  Demand becomes more and more erratic as it moves upstream, imposing major inventory, capacity, and management costs at every level.  Quality becomes worse and worse as we move upstream, imposing major costs downstream.  Most managers and many production associates expend the majority of their efforts on hand-offs, work-arounds, and logistical complexity.
  • 13.
    13 © 2004 Superfactory™.All Rights Reserved. The Future State Completed in a day with the same team Focused on:  Creating a flexible, reactive system that quickly adapts to changing customer needs  Eliminating waste  Creating flow  Producing on demand
  • 14.
    14 © 2004 Superfactory™.All Rights Reserved. The Future State  Activities aligned with our business strategy  Efforts focused on NET improvements for the company  Metrics supportive of fundamental change  Simple, constant communication of our plans and achievements as an enterprise
  • 15.
    15 © 2004 Superfactory™.All Rights Reserved. The Future State
  • 16.
    16 © 2004 Superfactory™.All Rights Reserved. Don’t Wait! You need a plan! • Tie it to your business objectives. • Make a VS Plan: What to do by when. • Establish an appropriate review frequency. • Conduct VS Reviews walking the flow. Implementing Change
  • 17.
    17 © 2004 Superfactory™.All Rights Reserved. Implementing Change Critical Success Factors  Management must understand, embrace, and lead the organization into lean thinking  Value stream managers must be empowered and enabled to manage implementations  Improvements must be planned in detail with the cross functional Kaizen teams  Successes must be translated to the bottom line and/or market share
  • 18.
    18 © 2004 Superfactory™.All Rights Reserved. Implementing Change Each Value Stream needs a Value Stream Manager The conductor of implementation: •Focused on system wins •Reports to the top dog Process 1 Process 2 Process 3 “Customer” The Value Stream Manager Kaizen
  • 19.
    19 © 2004 Superfactory™.All Rights Reserved. Implementing Change Typical Results  Throughput time falls from 44 days to 6 (87%)  Wasted steps fall from 65 to 27 (60%)  Transport distance falls from 5300 miles to 1100 miles  Demand amplification is reduced from 20% to 5%  Inventories shrink by 90% percent  Defects are reduced to the same rate at the start of the process as at the end  Throughput time shrinks to within customer wait time, meaning all production is to confirmed order
  • 20.
    20 © 2004 Superfactory™.All Rights Reserved. Roadblocks  75 years of bad habits  Financial focus with limited cost understanding  A lack of system thinking and incentives  Metrics supporting a 75 year old model  Limited customer focus  Absence of effective operating strategies
  • 21.
    21 © 2004 Superfactory™.All Rights Reserved. Roadblocks  Traditional approaches do not focus on the value stream  Create “perfect competition” at the next level of supply upstream, by attracting many bidders.  Improve bargaining power through scale economies in raw materials buys as well.  Turn up the competitive pressure with reverse auctions where possible.  Demand continuing price reductions in multi-year contracts whatever happens to volume.  Note the lack of process analysis of the value stream!  “Market will insure lowest costs & highest efficiency!”
  • 22.
    22 © 2004 Superfactory™.All Rights Reserved. Roadblocks  Margin squeezing rather than true cost reduction.  Persistent shortfalls in quality and delivery reliability.  Low-ball bidding and the engineering change game.  Collapse of “partnership” and “trust” in economic downturns (2001!), replaced by “survival of the fittest”.
  • 23.
    23 © 2004 Superfactory™.All Rights Reserved. Wrong Ways to Address Roadblocks  Programs of the month (band aids)  Meetings, meetings, meetings, meetings  Silo optimization