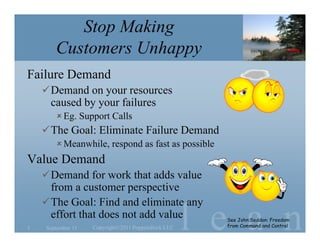
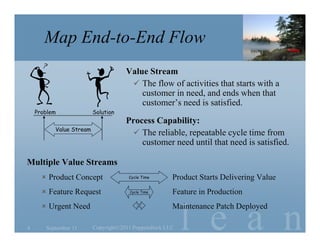
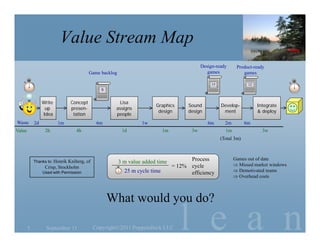
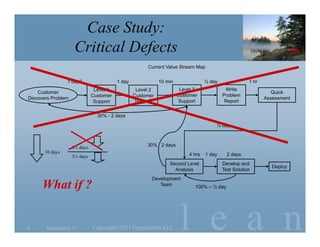
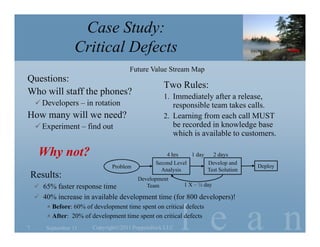
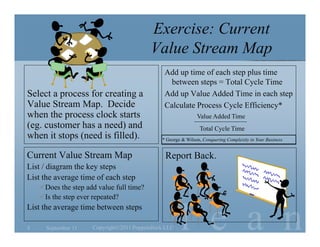
lsoftware development
                                    e a n
           Lean Software Development
                       Value Stream Mapping

mary@poppendieck.com      Mary Poppendieck    www.poppendieck.com
Eliminate Waste

    Stop doing things customers don’t value!
    Value is…
      Seen through the eyes of those
      who pay for, use, support, or
      derive value from our systems.
    Waste is…
      Anything that depletes resources
      of time, effort, space, or money
      without adding customer value.

2
    Put on Customer Glasses
     September 11   Copyright©2011 Poppendieck.LLC   l e a n
Stop Making
       Customers Unhappy
Failure Demand
     Demand on your resources
     caused by your failures
        Eg. Support Calls
     The Goal: Eliminate Failure Demand
        Meanwhile, respond as fast as possible
Value Demand
     Demand for work that adds value
      from a customer perspective
     The Goal: Find and eliminate any

3
      effort that does not add value
    September 11   Copyright©2011 Poppendieck.LLC   l e a n
                                                      See John Seddon: Freedom
                                                      from Command and Control
Map End-to-End Flow
                                     Value Stream
                                       The flow of activities that starts with a
                                         customer in need, and ends when that
                                         customer’s need is satisfied.
    Problem              Solution
                                     Process Capability:
          Value Stream
                                       The reliable, repeatable cycle time from
                                         customer need until that need is satisfied.

Multiple Value Streams
       Product Concept               Cycle Time      Product Starts Delivering Value
       Feature Request               Cycle Time      Feature in Production
       Urgent Need                                   Maintenance Patch Deployed

                                                          l e a n
                                          ct


4      September 11      Copyright©2011 Poppendieck.LLC
Value Stream Map
                                                                                             Design-ready      Product-ready
                                         Game backlog                                           games             games

                                                                                                  15                 12
                                               8

                 Write         Concept                Lisa
                                                                       Graphics        Sound           Develop-           Integrate
                  up           presen-              assigns
                                                                        design         design           ment              & deploy
                 Idea           tation              people
Waste       2d           1m                  6m                  1w                             6m       2m         6m
Value             2h              4h                     1d                 1m          3w               1m                 3w
                                                                                                       (Total 3m)


            Thanks to: Henrik Kniberg, of               3 m value added time           Process                Games out of date
                                                                                 = 12% cycle                   Missed market windows
                  Crisp, Stockholm
                                                          25 m cycle time                                      Demotivated teams
                 Used with Permission                                                  efficiency
                                                                                                               Overhead costs


                                                   What would you do?

        5         September 11              Copyright©2011 Poppendieck.LLC          l e a n
Case Study:
                     Critical Defects
                                                      Current Value Stream Map


                 1 day?                  1 day              10 min               ½ day               1 hr
                               Level 1            Level 2             Level 3             Write
    Customer                                                                                                   Quick
                              Customer           Customer            Customer            Problem
Discovers Problem                                                                                           Assessment
                               Support            Support             Support             Report


                                30% - 2 days

                                                                                     ½ day


                    6½ days                           30% 2 days
       10 days                                                           4 hrs   1 day     2 days
                    3½ days
                                                                Second Level             Develop and
                                                                                                               Deploy
                                                                  Analysis               Test Solution
                                                        Development
      What if ?                                            Team             100% – ½ day


6      September 11           Copyright©2011 Poppendieck.LLC          l e a n
Case Study:
                  Critical Defects
                                       Future Value Stream Map
Questions:
                                                   Two Rules:
Who will staff the phones?                         1. Immediately after a release,
      Developers – in rotation                       responsible team takes calls.
How many will we need?                             2. Learning from each call MUST
      Experiment – find out                          be recorded in knowledge base
                                                      which is available to customers.

      Why not?                                      4 hrs    1 day   2 days
                                                Second Level       Develop and
                                Problem                                            Deploy
                                                  Analysis         Test Solution
    Results:                              Development
     65% faster response time               Team          1 X – ½ day

     40% increase in available development time (for 800 developers)!
         Before: 60% of development time spent on critical defects


7       September 11     Copyright©2011 Poppendieck.LLC   l e a n
         After: 20% of development time spent on critical defects
Exercise: Current
                                          Value Stream Map
                                               Add up time of each step plus time
                                                 between steps = Total Cycle Time
Select a process for creating a                Add up Value Added Time in each step
Value Stream Map. Decide                       Calculate Process Cycle Efficiency*
when the process clock starts                                 Value Added Time
(eg. customer has a need) and                                  Total Cycle Time
when it stops (need is filled).               * George & Wilson, Conquering Complexity in Your Business


Current Value Stream Map                       Report Back.
List / diagram the key steps
List the average time of each step
    Does the step add value full time?
    Is the step ever repeated?


                                                      l e a n
List the average time between steps

8     September 11   Copyright©2011 Poppendieck.LLC
Pull Scheduling                                        Observe      Orient


            Small Requests                                       Act         Decide


       (Wishful Thinking)


    Input Flow                                           Output Capacity

        (Wishful Thinking)


                                             Never


9   September 11       Copyright©2011 Poppendieck.LLC   l e a n
lsoftware development
                                   e a n
                       Thank You!
             More Information: www.poppendieck.com

mary@poppendieck.com     Mary Poppendieck      www.poppendieck.com

Value stream mapping

  • 1.
    lsoftware development e a n Lean Software Development Value Stream Mapping mary@poppendieck.com Mary Poppendieck www.poppendieck.com
  • 2.
    Eliminate Waste Stop doing things customers don’t value! Value is… Seen through the eyes of those who pay for, use, support, or derive value from our systems. Waste is… Anything that depletes resources of time, effort, space, or money without adding customer value. 2 Put on Customer Glasses September 11 Copyright©2011 Poppendieck.LLC l e a n
  • 3.
    Stop Making Customers Unhappy Failure Demand  Demand on your resources caused by your failures  Eg. Support Calls  The Goal: Eliminate Failure Demand  Meanwhile, respond as fast as possible Value Demand  Demand for work that adds value from a customer perspective  The Goal: Find and eliminate any 3 effort that does not add value September 11 Copyright©2011 Poppendieck.LLC l e a n See John Seddon: Freedom from Command and Control
  • 4.
    Map End-to-End Flow Value Stream  The flow of activities that starts with a customer in need, and ends when that customer’s need is satisfied. Problem Solution Process Capability: Value Stream  The reliable, repeatable cycle time from customer need until that need is satisfied. Multiple Value Streams  Product Concept Cycle Time Product Starts Delivering Value  Feature Request Cycle Time Feature in Production  Urgent Need Maintenance Patch Deployed l e a n ct 4 September 11 Copyright©2011 Poppendieck.LLC
  • 5.
    Value Stream Map Design-ready Product-ready Game backlog games games 15 12 8 Write Concept Lisa Graphics Sound Develop- Integrate up presen- assigns design design ment & deploy Idea tation people Waste 2d 1m 6m 1w 6m 2m 6m Value 2h 4h 1d 1m 3w 1m 3w (Total 3m) Thanks to: Henrik Kniberg, of 3 m value added time Process Games out of date = 12% cycle  Missed market windows Crisp, Stockholm 25 m cycle time  Demotivated teams Used with Permission efficiency  Overhead costs What would you do? 5 September 11 Copyright©2011 Poppendieck.LLC l e a n
  • 6.
    Case Study: Critical Defects Current Value Stream Map 1 day? 1 day 10 min ½ day 1 hr Level 1 Level 2 Level 3 Write Customer Quick Customer Customer Customer Problem Discovers Problem Assessment Support Support Support Report 30% - 2 days ½ day 6½ days 30% 2 days 10 days 4 hrs 1 day 2 days 3½ days Second Level Develop and Deploy Analysis Test Solution Development What if ? Team 100% – ½ day 6 September 11 Copyright©2011 Poppendieck.LLC l e a n
  • 7.
    Case Study: Critical Defects Future Value Stream Map Questions: Two Rules: Who will staff the phones? 1. Immediately after a release,  Developers – in rotation responsible team takes calls. How many will we need? 2. Learning from each call MUST  Experiment – find out be recorded in knowledge base which is available to customers. Why not? 4 hrs 1 day 2 days Second Level Develop and Problem Deploy Analysis Test Solution Results: Development  65% faster response time Team 1 X – ½ day  40% increase in available development time (for 800 developers)!  Before: 60% of development time spent on critical defects 7 September 11 Copyright©2011 Poppendieck.LLC l e a n  After: 20% of development time spent on critical defects
  • 8.
    Exercise: Current Value Stream Map Add up time of each step plus time between steps = Total Cycle Time Select a process for creating a Add up Value Added Time in each step Value Stream Map. Decide Calculate Process Cycle Efficiency* when the process clock starts Value Added Time (eg. customer has a need) and Total Cycle Time when it stops (need is filled). * George & Wilson, Conquering Complexity in Your Business Current Value Stream Map Report Back. List / diagram the key steps List the average time of each step Does the step add value full time? Is the step ever repeated? l e a n List the average time between steps 8 September 11 Copyright©2011 Poppendieck.LLC
  • 9.
    Pull Scheduling Observe Orient Small Requests Act Decide (Wishful Thinking) Input Flow Output Capacity (Wishful Thinking) Never 9 September 11 Copyright©2011 Poppendieck.LLC l e a n
  • 10.
    lsoftware development e a n Thank You! More Information: www.poppendieck.com mary@poppendieck.com Mary Poppendieck www.poppendieck.com