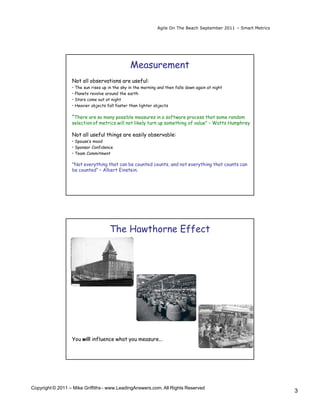
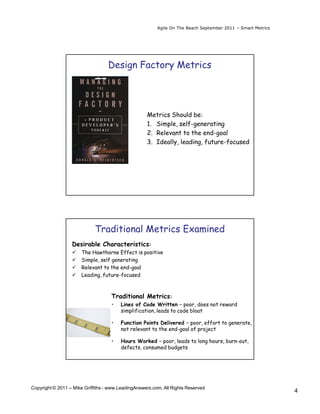
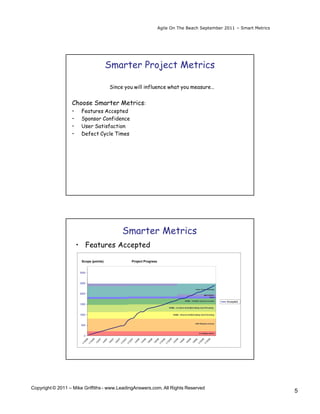
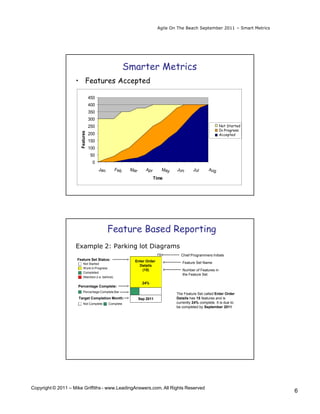
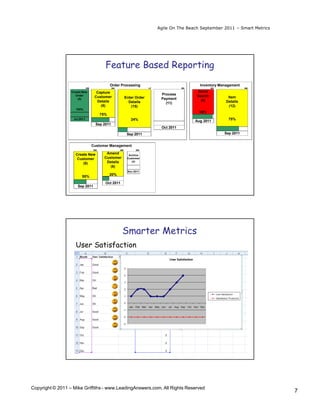
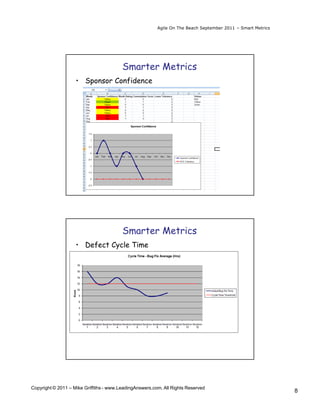
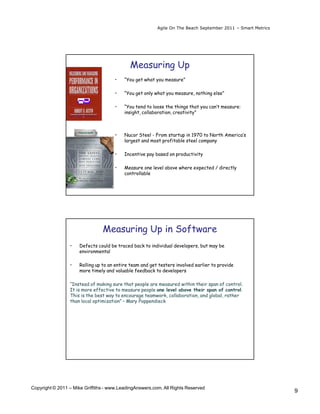
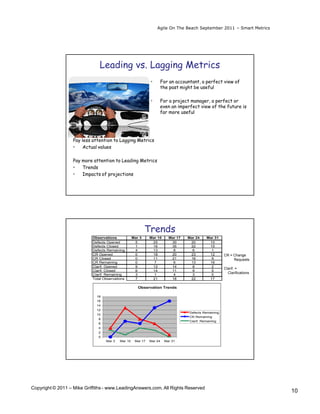
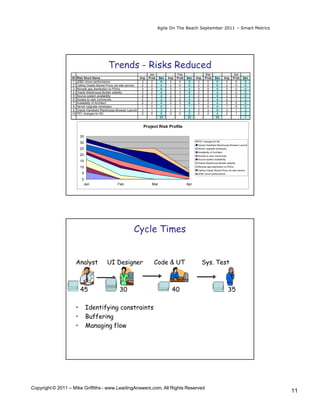
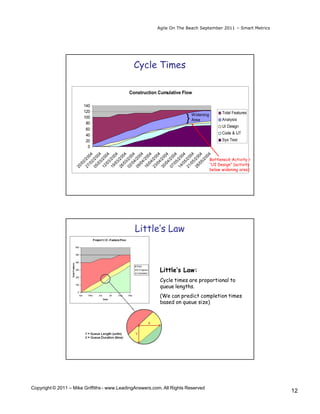
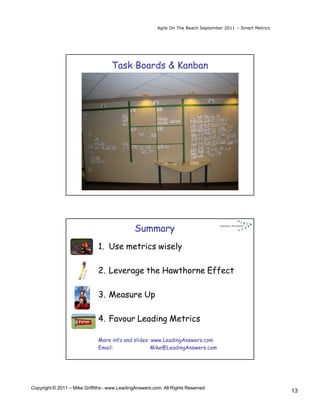
Agile On The Beach September 2011 – Smart Metrics


                                       Smart Agile Metrics


                                              September 15th, 2011

                                               Agile On The Beach

                                               Mike Griffiths, PMP
                                              Leading Answers Inc.
                                               www.LeadingAnswers.com


                                    Presenter Background
                    • Project Manager and Trainer
                        • >25 years IT experience on utilities, defense, & finance
                        • 10 years PMO Agile-to-Traditional Integration

                    • Agile Project Management
                        •   Helped create Agile method DSDM in 1994
                        •   17 years agile project experience (DSDM, XP, Scrum, FDD)
                        •   Board director of Agile Alliance and APLN
                        •   Author, trainer, and presenter Agile Conference 2001-9

                    • Traditional Project Management
                        •   PMP, PRINCE2 certifications
                        •   PMBOK v3 and v5 contributor and reviewer
                        •   Trainer for PMI SeminarsWorld 2005-2011
                        •   Presenter PMI Global Congress 2004-2011
                        •   Steering Committee PMI-ACP Exam


Copyright © 2011 – Mike Griffiths - www.LeadingAnswers.com. All Rights Reserved
                                                                                                             1
Agile On The Beach September 2011 – Smart Metrics


                                                   Agenda
                    6) Smart Metric                                       1) Measurement
                    examples                                              Troubles

                    •   1 <Star>
                    •   2
                    •   3                                                                  2) The
                                                                                           Hawthorne
                    •   4                                                                  Effect

                    •   5
                 5) Leading vs.
                 Lagging Metrics


                                                                                   3) “Design
                                                                                   Factory”
                                                                                   Metrics
                  4) Measuring Up


                                         Metrics are like fire…


Copyright © 2011 – Mike Griffiths - www.LeadingAnswers.com. All Rights Reserved
                                                                                                             2
Agile On The Beach September 2011 – Smart Metrics


                                                Measurement
                  Not all observations are useful:
                  • The sun rises up in the sky in the morning and then falls down again at night
                  • Planets revolve around the earth
                  • Stars come out at night
                  • Heavier objects fall faster than lighter objects

                  ”There are so many possible measures in a software process that some random
                  selection of metrics will not likely turn up something of value” – Watts Humphrey

                  Not all useful things are easily observable:
                  • Spouse’s mood
                  • Sponsor Confidence
                  • Team Commitment

                  "Not everything that can be counted counts, and not everything that counts can
                  be counted“ – Albert Einstein.


                                     The Hawthorne Effect


                  You will influence what you measure...


Copyright © 2011 – Mike Griffiths - www.LeadingAnswers.com. All Rights Reserved
                                                                                                                  3
Agile On The Beach September 2011 – Smart Metrics


                                   Design Factory Metrics


                                                    Metrics Should be:
                                                    1. Simple, self-generating
                                                    2. Relevant to the end-goal
                                                    3. Ideally, leading, future-focused


                            Traditional Metrics Examined
                  Desirable Characteristics:
                  ü   The Hawthorne Effect is positive
                  ü   Simple, self generating
                  ü   Relevant to the end-goal
                  ü   Leading, future-focused


                                    Traditional Metrics:
                                    •   Lines of Code Written – poor, does not reward
                                        simplification, leads to code bloat

                                    •   Function Points Delivered – poor, effort to generate,
                                        not relevant to the end-goal of project

                                    •   Hours Worked – poor, leads to long hours, burn-out,
                                        defects, consumed budgets


Copyright © 2011 – Mike Griffiths - www.LeadingAnswers.com. All Rights Reserved
                                                                                                             4
Agile On The Beach September 2011 – Smart Metrics


                                                       Smarter Project Metrics

                                                        Since you will influence what you measure…


                  Choose Smarter Metrics:
                  •     Features Accepted
                  •     Sponsor Confidence
                  •     User Satisfaction
                  •     Defect Cycle Times


                                                                     Smarter Metrics
                      • Features Accepted

                        Scope (points)                                        IPS Project Progress                                                  Spend


                       3000


                       2500

                                                                                                                                                                               Not Started
                       2000                                                                                                                                                    In Progress
                                                                                                                                                                               Accepted
                                                                                                                                                                                  Accepted
                                                                                                                                                                                  Scope Built
                       1500


                       1000


                       500


                         0
                                        6


                                                                          7


                                                                                                                               8
                              6


                                                                                    7


                                                                                                                     8


                                                                                                                                                                 9

                                                                                                                                                                           9
                                             07


                                                         07

                                                               07


                                                                                               08


                                                                                                           08


                                                                                                                                    09


                                                                                                                                                09
                                                   07


                                                                                         08


                                                                                                     08


                                                                                                                                          09


                                                                                                                                                      09
                                       /0


                                                                         /0


                                                                                                                              /0
                             /0


                                                                                   /0


                                                                                                                    /0


                                                                                                                                                                /0

                                                                                                                                                                          /0
                                            2/


                                                        6/

                                                              8/


                                                                                              4/


                                                                                                          8/


                                                                                                                                   2/


                                                                                                                                               6/
                                                  4/


                                                                                        2/


                                                                                                    6/


                                                                                                                                         4/


                                                                                                                                                      8/
                                  12


                                                                    10


                                                                                                                         12
                         10


                                                                               12


                                                                                                                10


                                                                                                                                                            10

                                                                                                                                                                     12
                                            1/


                                                        1/

                                                              1/


                                                                                              1/


                                                                                                          1/


                                                                                                                                   1/


                                                                                                                                               1/
                                                  1/


                                                                                        1/


                                                                                                    1/


                                                                                                                                         1/


                                                                                                                                                     1/
                                  1/


                                                                    1/


                                                                                                                         1/
                        1/


                                                                              1/


                                                                                                               1/


                                                                                                                                                           1/

                                                                                                                                                                     1/


Copyright © 2011 – Mike Griffiths - www.LeadingAnswers.com. All Rights Reserved
                                                                                                                                                                                                5
Agile On The Beach September 2011 – Smart Metrics


                                                          Smarter Metrics
                    • Features Accepted

                                  450
                                  400
                                  350
                                  300
                                  250                                                                            Not Started
                                                                                                                  Not Started
                                                                                                                 In Progress
                                                                                                                  In Progress
                       Features


                                  200                                                                             Accepted
                                                                                                                 Completed
                                  150
                                  100
                                  50
                                   0
                                        Jan         Feb    Mar      Apr          May   Jun       Jul      Aug
                                                                          Time


                                              Feature Based Reporting
                    Example 2: Parking lot Diagrams
                                                                            FB           Chief Programmers Initials
                     Feature Set Status:                     Enter Order
                          Not Started                                                     Feature Set Name
                                                               Details
                          Work in Progress
                                                                 (15)                     Number of Features in
                          Completed
                                                                                          the Feature Set
                          Attention (i.e. behind)
                                                                   24%
                     Percentage Complete:
                          Percentage Complete Bar
                                                                                       The Feature Set called Enter Order
                     Target Completion Month:                    Sep 2011              Details has 15 features and is
                          Not Complete        Complete                                 currently 24% complete. It is due to
                                                                                       be completed by September 2011


Copyright © 2011 – Mike Griffiths - www.LeadingAnswers.com. All Rights Reserved
                                                                                                                                6
Agile On The Beach September 2011 – Smart Metrics


                                          Feature Based Reporting
                                              Order Processing                                 Inventory Management
                              CM               DH                      LF               RS            NC              KB
                  Create New         Capture                                                 Stock
                     Order                                                   Process         Search
                                    Customer             Enter Order         Payment                         Item
                      (5)
                                     Details               Details                             (6)          Details
                                                                               (11)
                                       (9)                  (15)                                             (12)
                    100%
                                                                                               95%
                                        75%
                   Jul 2011                                 24%                                              75%
                                                                                             Aug 2011
                                    Sep 2011
                                                                             Oct 2011
                                                          Sep 2011                                         Sep 2011


                                   Customer Management
                                   SW               AW         SW

                    Create New            Amend            Archive
                     Customer            Customer         Customer
                                          Details            (4)
                        (8)
                                            (6)
                                                          Nov 2011
                                              20%
                        55%
                                          Oct 2011
                      Sep 2011


                                                     Smarter Metrics
                    User Satisfaction


Copyright © 2011 – Mike Griffiths - www.LeadingAnswers.com. All Rights Reserved
                                                                                                                                7
Agile On The Beach September 2011 – Smart Metrics


                                         Smarter Metrics
                    • Sponsor Confidence


                                         Smarter Metrics
                    • Defect Cycle Time


Copyright © 2011 – Mike Griffiths - www.LeadingAnswers.com. All Rights Reserved
                                                                                                             8
Agile On The Beach September 2011 – Smart Metrics


                                             Measuring Up
                                      •   “You get what you measure”

                                      •   “You get only what you measure, nothing else”

                                      •   “You tend to loose the things that you can’t measure:
                                          insight, collaboration, creativity”


                                      •   Nucor Steel - From startup in 1970 to North America’s
                                          largest and most profitable steel company

                                      •   Incentive pay based on productivity

                                      •   Measure one level above where expected / directly
                                          controllable


                                Measuring Up in Software
                 •   Defects could be traced back to individual developers, but may be
                     environmental

                 •   Rolling up to an entire team and get testers involved earlier to provide
                     more timely and valuable feedback to developers

                 “Instead of making sure that people are measured within their span of control.
                 It is more effective to measure people one level above their span of control.
                 This is the best way to encourage teamwork, collaboration, and global, rather
                 than local optimization” – Mary Poppendieck


Copyright © 2011 – Mike Griffiths - www.LeadingAnswers.com. All Rights Reserved
                                                                                                             9
Agile On The Beach September 2011 – Smart Metrics


                               Leading vs. Lagging Metrics
                                                             •    For an accountant, a perfect view of
                                                                  the past might be useful

                                                             •    For a project manager, a perfect or
                                                                  even an imperfect view of the future is
                                                                  far more useful


                   Pay less attention to Lagging Metrics
                   •    Actual values

                   Pay more attention to Leading Metrics
                   •   Trends
                   •   Impacts of projections


                                                           Trends
                           Observations            Mar 3     Mar 10     Mar 17   Mar 24   Mar 31
                           Defects Opened           5         25         30       20       10
                           Defects Closed           1         16         35       22       15
                           Defects Remaining        4         13          8        6        1
                           CR Opened                0         18         20       23       12        CR = Change
                           CR Closed                0         11         21       16        9             Requests
                           CR Remaining             0          7          6       13       16
                           Clarif. Opened           9         12         14        8        2
                                                                                                     Clarif. =
                           Clarif. Closed           6         14         11        9        5
                           Clarif. Remaining        3          1          4        3        0
                                                                                                       Clarifications
                           Total Observations       7         21         18       22       17

                                                      Observation Trends

                             18
                             16
                             14
                             12
                                                                                 Defects Remaining
                             10
                                                                                 CR Remaining
                              8
                                                                                 Clarif. Remaining
                              6
                              4
                              2
                              0
                                  Mar 3   Mar 10    Mar 17   Mar 24   Mar 31


Copyright © 2011 – Mike Griffiths - www.LeadingAnswers.com. All Rights Reserved
                                                                                                                        10
Agile On The Beach September 2011 – Smart Metrics


                                             Trends - Risks Reduced
                                                                            Jan                Feb                 Mar                          Apr
                  ID   Risk Short Name                               Imp   Prob    Sev   Imp   Prob   Sev   Imp    Prob       Sev        Imp   Prob   Sev
                   1   JDBC driver performance                        3      2      6     3     0       0    3      0          0          3      0     0
                   2   Calling Oracle Stored Procs via web service    2      2      4     2     0       0    2      0          0          2      0     0
                   3   Remote app distribution to PDA's               3      2      6     3     1       3    3      0          0          3      0     0
                   4   Oracle Warehouse Builder stability             2      2      4     2     3       6    2      2          4          2      0     0
                   5   Source system availability                     2      1      2     2     1       2    2      0          0          2      0     0
                   6   Access to user community                       2      1      2     2     2       4    2      2          4          2      1     2
                   7   Availability of Architect                      2      2      4     2     3       6    2      2          4          2      0     0
                   8   Server Upgrade necessary                       1      2      2     1     1       1    1      0          0          1      0     0
                   9   Oracle Handheld Warehouse Browser Launch       3      1      3     3     1       3    3      3          9          3      1     3
                  10   PST changes for BC                             0      0      0     0     0       0    2      2          4          2      1     2
                                                                                    33                 25                      25                      7


                                                                      Project Risk Profile

                           35
                                                                                                             PST changes for BC
                           30
                                                                                                             Oracle Handheld Warehouse Browser Launch
                           25                                                                                Server Upgrade necessary
                                                                                                             Availability of Architect
                           20                                                                                Access to user community
                                                                                                             Source system availability
                           15
                                                                                                             Oracle Warehouse Builder stability
                           10                                                                                Remote app distribution to PDA's
                                                                                                             Calling Oracle Stored Procs via web service
                            5                                                                                JDBC driver performance

                            0
                             Jan                    Feb                      Mar                      Apr


                                                               Cycle Times


                       Analyst              UI Designer                       Code & UT                           Sys. Test


                           45                        30                                    40                                              35

                       •        Identifying constraints
                       •        Buffering
                       •        Managing flow


Copyright © 2011 – Mike Griffiths - www.LeadingAnswers.com. All Rights Reserved
                                                                                                                                                            11
Agile On The Beach September 2011 – Smart Metrics


                                              Cycle Times

                                            Construction Cumulative Flow

                         140
                         120                                                               Total Features
                                                                          Widening
                         100
                          80
                                                                      }   Area             Analysis
                                                                                           UI Design
                          60
                          40                                                               Code & UT
                          20                                                               Sys Test
                           0
                       /0 04


                       /0 04


                       /0 04
                       /0 04
                       /0 04


                       /0 04

                       /0 04

                       /0 04
                       /0 04


                       /0 04


                       /0 04

                       /0 04
                       /0 04


                       /0 04
                               04
                     05 /2 0


                     09 /20


                     21 /2 0
                     27 /2 0


                     12 /2 0

                     19 /2 0

                     26 /2 0
                     02 /2 0


                     23 /2 0

                     30 /2 0

                     07 /2 0
                     14 /2 0


                     28 /2 0
                            20
                     16 /20


                                                                                     Bottleneck Activity =


                          5/
                          4
                          2


                          5
                          4

                          4
                          2


                          3

                          3

                          3

                          3


                          4

                          4

                          5


                          5
                                                                                     “UI Design” (activity
                       /0
                    20


                                                                                     below widening area)


                                               Little’s Law


                                                          Little’s Law:
                                                          Cycle times are proportional to
                                                          queue lengths.
                                                          (We can predict completion times
                                                          based on queue size)


Copyright © 2011 – Mike Griffiths - www.LeadingAnswers.com. All Rights Reserved
                                                                                                             12
Agile On The Beach September 2011 – Smart Metrics


                                    Task Boards & Kanban


                                               Summary
                              1. Use metrics wisely

                              2. Leverage the Hawthorne Effect

                              3. Measure Up

                              4. Favour Leading Metrics

                              More info and slides: www.LeadingAnswers.com
                              Email:               Mike@LeadingAnswers.com


Copyright © 2011 – Mike Griffiths - www.LeadingAnswers.com. All Rights Reserved
                                                                                                             13

Smart Metrics

  • 1.
    Agile On TheBeach September 2011 – Smart Metrics Smart Agile Metrics September 15th, 2011 Agile On The Beach Mike Griffiths, PMP Leading Answers Inc. www.LeadingAnswers.com Presenter Background • Project Manager and Trainer • >25 years IT experience on utilities, defense, & finance • 10 years PMO Agile-to-Traditional Integration • Agile Project Management • Helped create Agile method DSDM in 1994 • 17 years agile project experience (DSDM, XP, Scrum, FDD) • Board director of Agile Alliance and APLN • Author, trainer, and presenter Agile Conference 2001-9 • Traditional Project Management • PMP, PRINCE2 certifications • PMBOK v3 and v5 contributor and reviewer • Trainer for PMI SeminarsWorld 2005-2011 • Presenter PMI Global Congress 2004-2011 • Steering Committee PMI-ACP Exam Copyright © 2011 – Mike Griffiths - www.LeadingAnswers.com. All Rights Reserved 1
  • 2.
    Agile On TheBeach September 2011 – Smart Metrics Agenda 6) Smart Metric 1) Measurement examples Troubles • 1 <Star> • 2 • 3 2) The Hawthorne • 4 Effect • 5 5) Leading vs. Lagging Metrics 3) “Design Factory” Metrics 4) Measuring Up Metrics are like fire… Copyright © 2011 – Mike Griffiths - www.LeadingAnswers.com. All Rights Reserved 2
  • 3.
    Agile On TheBeach September 2011 – Smart Metrics Measurement Not all observations are useful: • The sun rises up in the sky in the morning and then falls down again at night • Planets revolve around the earth • Stars come out at night • Heavier objects fall faster than lighter objects ”There are so many possible measures in a software process that some random selection of metrics will not likely turn up something of value” – Watts Humphrey Not all useful things are easily observable: • Spouse’s mood • Sponsor Confidence • Team Commitment "Not everything that can be counted counts, and not everything that counts can be counted“ – Albert Einstein. The Hawthorne Effect You will influence what you measure... Copyright © 2011 – Mike Griffiths - www.LeadingAnswers.com. All Rights Reserved 3
  • 4.
    Agile On TheBeach September 2011 – Smart Metrics Design Factory Metrics Metrics Should be: 1. Simple, self-generating 2. Relevant to the end-goal 3. Ideally, leading, future-focused Traditional Metrics Examined Desirable Characteristics: ü The Hawthorne Effect is positive ü Simple, self generating ü Relevant to the end-goal ü Leading, future-focused Traditional Metrics: • Lines of Code Written – poor, does not reward simplification, leads to code bloat • Function Points Delivered – poor, effort to generate, not relevant to the end-goal of project • Hours Worked – poor, leads to long hours, burn-out, defects, consumed budgets Copyright © 2011 – Mike Griffiths - www.LeadingAnswers.com. All Rights Reserved 4
  • 5.
    Agile On TheBeach September 2011 – Smart Metrics Smarter Project Metrics Since you will influence what you measure… Choose Smarter Metrics: • Features Accepted • Sponsor Confidence • User Satisfaction • Defect Cycle Times Smarter Metrics • Features Accepted Scope (points) IPS Project Progress Spend 3000 2500 Not Started 2000 In Progress Accepted Accepted Scope Built 1500 1000 500 0 6 7 8 6 7 8 9 9 07 07 07 08 08 09 09 07 08 08 09 09 /0 /0 /0 /0 /0 /0 /0 /0 2/ 6/ 8/ 4/ 8/ 2/ 6/ 4/ 2/ 6/ 4/ 8/ 12 10 12 10 12 10 10 12 1/ 1/ 1/ 1/ 1/ 1/ 1/ 1/ 1/ 1/ 1/ 1/ 1/ 1/ 1/ 1/ 1/ 1/ 1/ 1/ Copyright © 2011 – Mike Griffiths - www.LeadingAnswers.com. All Rights Reserved 5
  • 6.
    Agile On TheBeach September 2011 – Smart Metrics Smarter Metrics • Features Accepted 450 400 350 300 250 Not Started Not Started In Progress In Progress Features 200 Accepted Completed 150 100 50 0 Jan Feb Mar Apr May Jun Jul Aug Time Feature Based Reporting Example 2: Parking lot Diagrams FB Chief Programmers Initials Feature Set Status: Enter Order Not Started Feature Set Name Details Work in Progress (15) Number of Features in Completed the Feature Set Attention (i.e. behind) 24% Percentage Complete: Percentage Complete Bar The Feature Set called Enter Order Target Completion Month: Sep 2011 Details has 15 features and is Not Complete Complete currently 24% complete. It is due to be completed by September 2011 Copyright © 2011 – Mike Griffiths - www.LeadingAnswers.com. All Rights Reserved 6
  • 7.
    Agile On TheBeach September 2011 – Smart Metrics Feature Based Reporting Order Processing Inventory Management CM DH LF RS NC KB Create New Capture Stock Order Process Search Customer Enter Order Payment Item (5) Details Details (6) Details (11) (9) (15) (12) 100% 95% 75% Jul 2011 24% 75% Aug 2011 Sep 2011 Oct 2011 Sep 2011 Sep 2011 Customer Management SW AW SW Create New Amend Archive Customer Customer Customer Details (4) (8) (6) Nov 2011 20% 55% Oct 2011 Sep 2011 Smarter Metrics User Satisfaction Copyright © 2011 – Mike Griffiths - www.LeadingAnswers.com. All Rights Reserved 7
  • 8.
    Agile On TheBeach September 2011 – Smart Metrics Smarter Metrics • Sponsor Confidence Smarter Metrics • Defect Cycle Time Copyright © 2011 – Mike Griffiths - www.LeadingAnswers.com. All Rights Reserved 8
  • 9.
    Agile On TheBeach September 2011 – Smart Metrics Measuring Up • “You get what you measure” • “You get only what you measure, nothing else” • “You tend to loose the things that you can’t measure: insight, collaboration, creativity” • Nucor Steel - From startup in 1970 to North America’s largest and most profitable steel company • Incentive pay based on productivity • Measure one level above where expected / directly controllable Measuring Up in Software • Defects could be traced back to individual developers, but may be environmental • Rolling up to an entire team and get testers involved earlier to provide more timely and valuable feedback to developers “Instead of making sure that people are measured within their span of control. It is more effective to measure people one level above their span of control. This is the best way to encourage teamwork, collaboration, and global, rather than local optimization” – Mary Poppendieck Copyright © 2011 – Mike Griffiths - www.LeadingAnswers.com. All Rights Reserved 9
  • 10.
    Agile On TheBeach September 2011 – Smart Metrics Leading vs. Lagging Metrics • For an accountant, a perfect view of the past might be useful • For a project manager, a perfect or even an imperfect view of the future is far more useful Pay less attention to Lagging Metrics • Actual values Pay more attention to Leading Metrics • Trends • Impacts of projections Trends Observations Mar 3 Mar 10 Mar 17 Mar 24 Mar 31 Defects Opened 5 25 30 20 10 Defects Closed 1 16 35 22 15 Defects Remaining 4 13 8 6 1 CR Opened 0 18 20 23 12 CR = Change CR Closed 0 11 21 16 9 Requests CR Remaining 0 7 6 13 16 Clarif. Opened 9 12 14 8 2 Clarif. = Clarif. Closed 6 14 11 9 5 Clarif. Remaining 3 1 4 3 0 Clarifications Total Observations 7 21 18 22 17 Observation Trends 18 16 14 12 Defects Remaining 10 CR Remaining 8 Clarif. Remaining 6 4 2 0 Mar 3 Mar 10 Mar 17 Mar 24 Mar 31 Copyright © 2011 – Mike Griffiths - www.LeadingAnswers.com. All Rights Reserved 10
  • 11.
    Agile On TheBeach September 2011 – Smart Metrics Trends - Risks Reduced Jan Feb Mar Apr ID Risk Short Name Imp Prob Sev Imp Prob Sev Imp Prob Sev Imp Prob Sev 1 JDBC driver performance 3 2 6 3 0 0 3 0 0 3 0 0 2 Calling Oracle Stored Procs via web service 2 2 4 2 0 0 2 0 0 2 0 0 3 Remote app distribution to PDA's 3 2 6 3 1 3 3 0 0 3 0 0 4 Oracle Warehouse Builder stability 2 2 4 2 3 6 2 2 4 2 0 0 5 Source system availability 2 1 2 2 1 2 2 0 0 2 0 0 6 Access to user community 2 1 2 2 2 4 2 2 4 2 1 2 7 Availability of Architect 2 2 4 2 3 6 2 2 4 2 0 0 8 Server Upgrade necessary 1 2 2 1 1 1 1 0 0 1 0 0 9 Oracle Handheld Warehouse Browser Launch 3 1 3 3 1 3 3 3 9 3 1 3 10 PST changes for BC 0 0 0 0 0 0 2 2 4 2 1 2 33 25 25 7 Project Risk Profile 35 PST changes for BC 30 Oracle Handheld Warehouse Browser Launch 25 Server Upgrade necessary Availability of Architect 20 Access to user community Source system availability 15 Oracle Warehouse Builder stability 10 Remote app distribution to PDA's Calling Oracle Stored Procs via web service 5 JDBC driver performance 0 Jan Feb Mar Apr Cycle Times Analyst UI Designer Code & UT Sys. Test 45 30 40 35 • Identifying constraints • Buffering • Managing flow Copyright © 2011 – Mike Griffiths - www.LeadingAnswers.com. All Rights Reserved 11
  • 12.
    Agile On TheBeach September 2011 – Smart Metrics Cycle Times Construction Cumulative Flow 140 120 Total Features Widening 100 80 } Area Analysis UI Design 60 40 Code & UT 20 Sys Test 0 /0 04 /0 04 /0 04 /0 04 /0 04 /0 04 /0 04 /0 04 /0 04 /0 04 /0 04 /0 04 /0 04 /0 04 04 05 /2 0 09 /20 21 /2 0 27 /2 0 12 /2 0 19 /2 0 26 /2 0 02 /2 0 23 /2 0 30 /2 0 07 /2 0 14 /2 0 28 /2 0 20 16 /20 Bottleneck Activity = 5/ 4 2 5 4 4 2 3 3 3 3 4 4 5 5 “UI Design” (activity /0 20 below widening area) Little’s Law Little’s Law: Cycle times are proportional to queue lengths. (We can predict completion times based on queue size) Copyright © 2011 – Mike Griffiths - www.LeadingAnswers.com. All Rights Reserved 12
  • 13.
    Agile On TheBeach September 2011 – Smart Metrics Task Boards & Kanban Summary 1. Use metrics wisely 2. Leverage the Hawthorne Effect 3. Measure Up 4. Favour Leading Metrics More info and slides: www.LeadingAnswers.com Email: Mike@LeadingAnswers.com Copyright © 2011 – Mike Griffiths - www.LeadingAnswers.com. All Rights Reserved 13