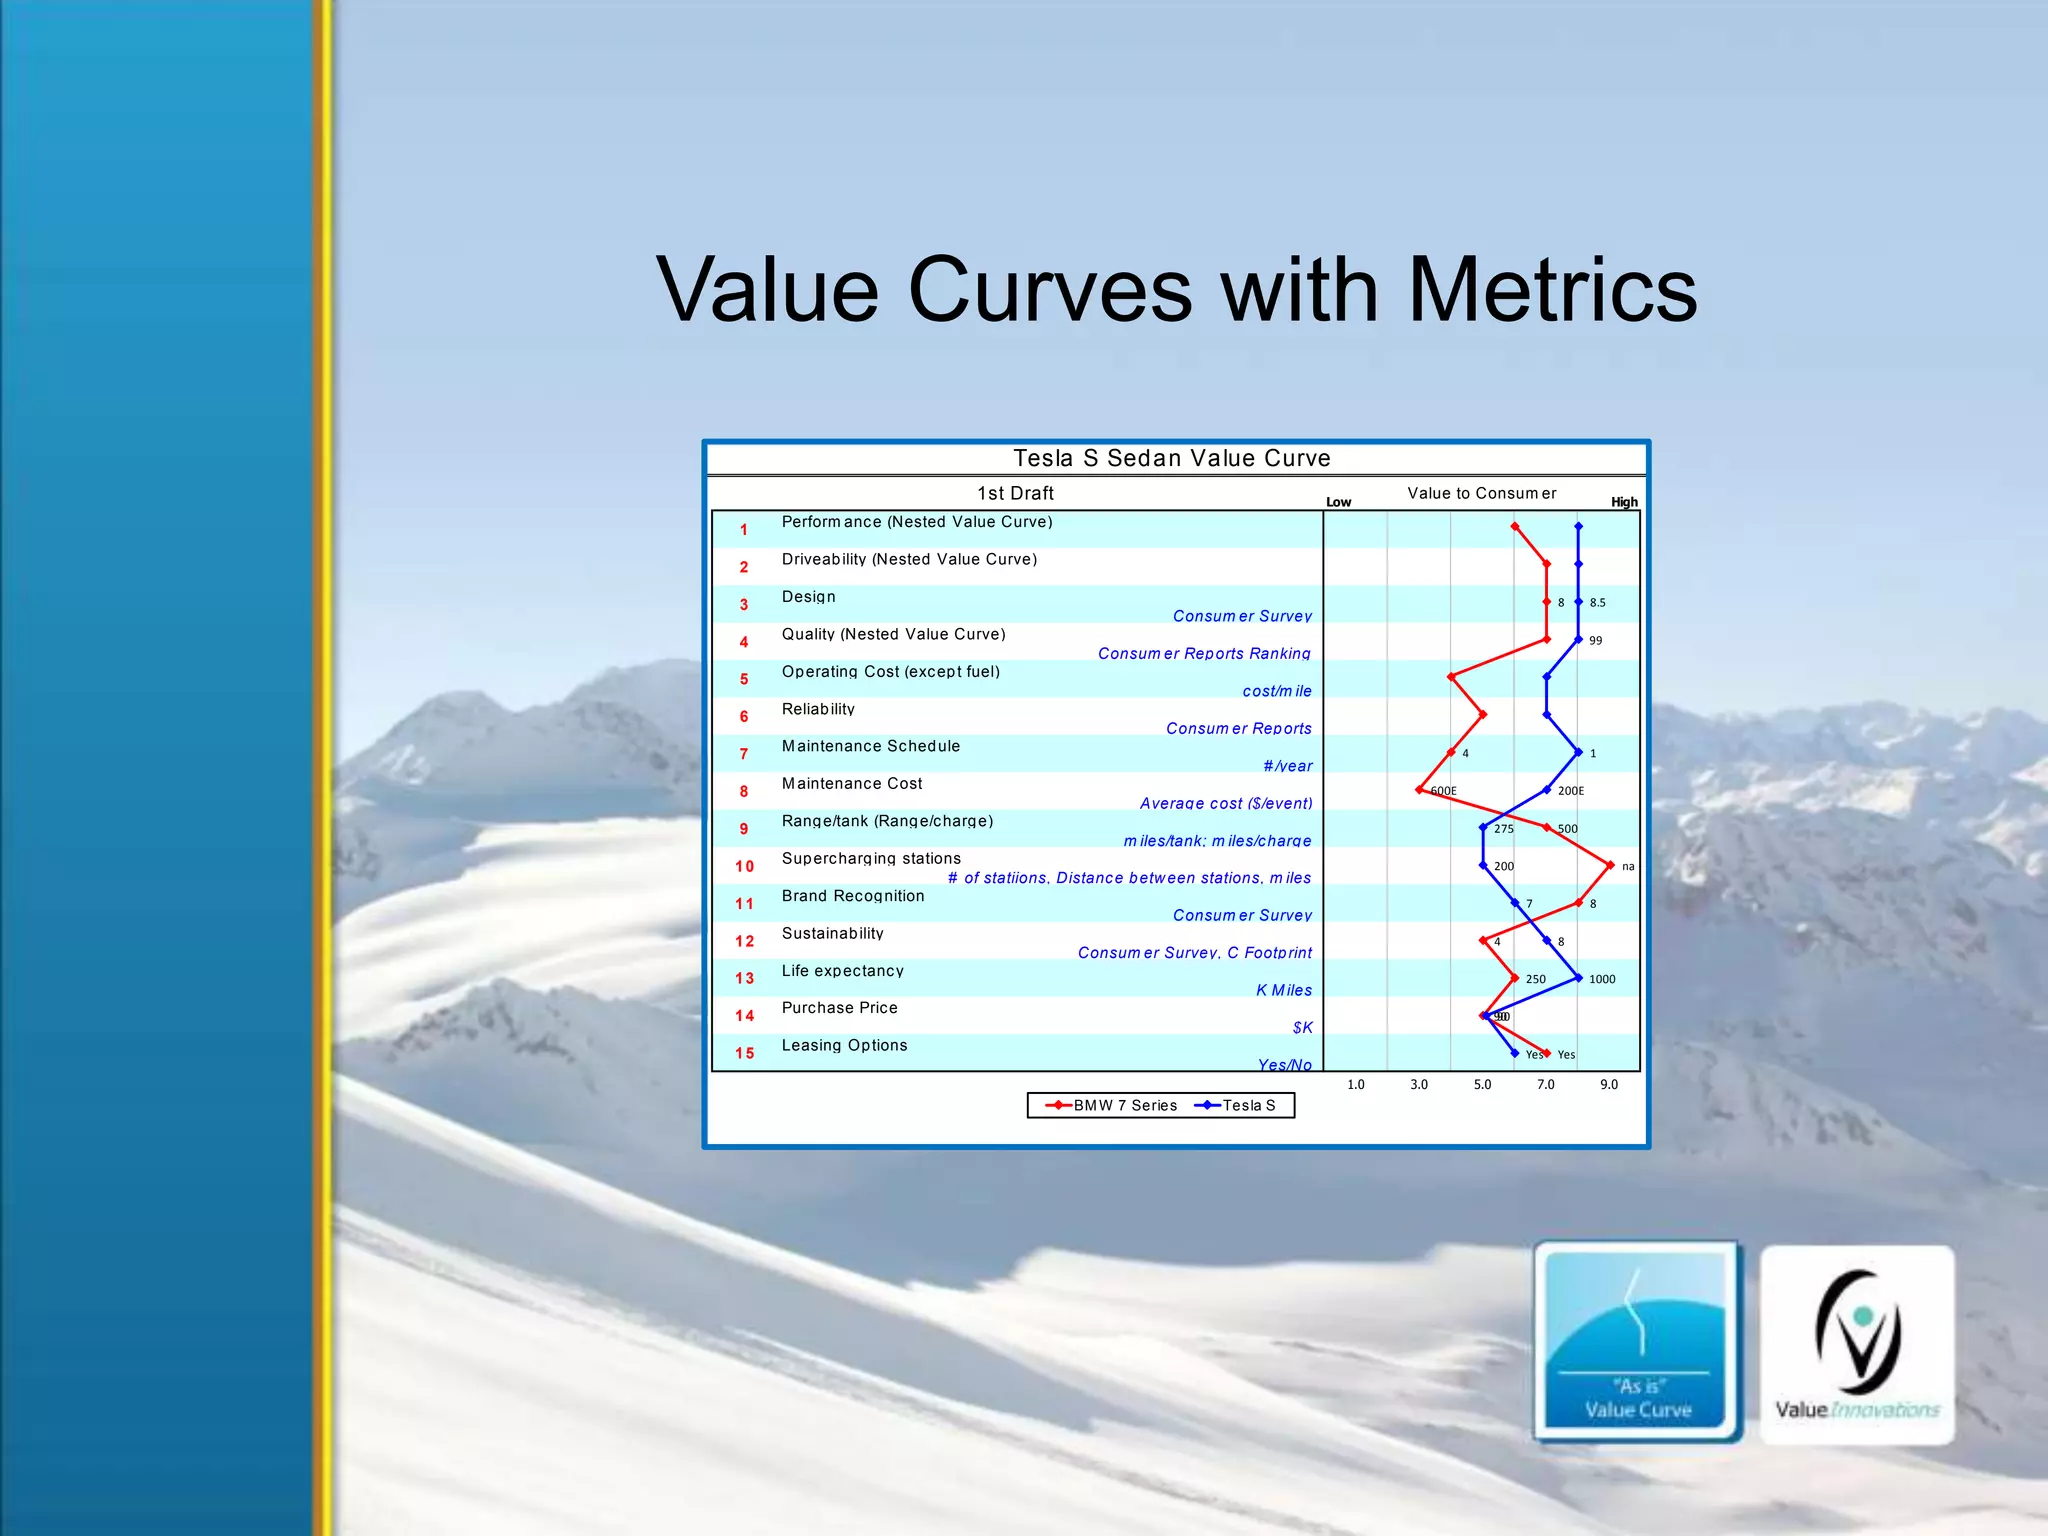
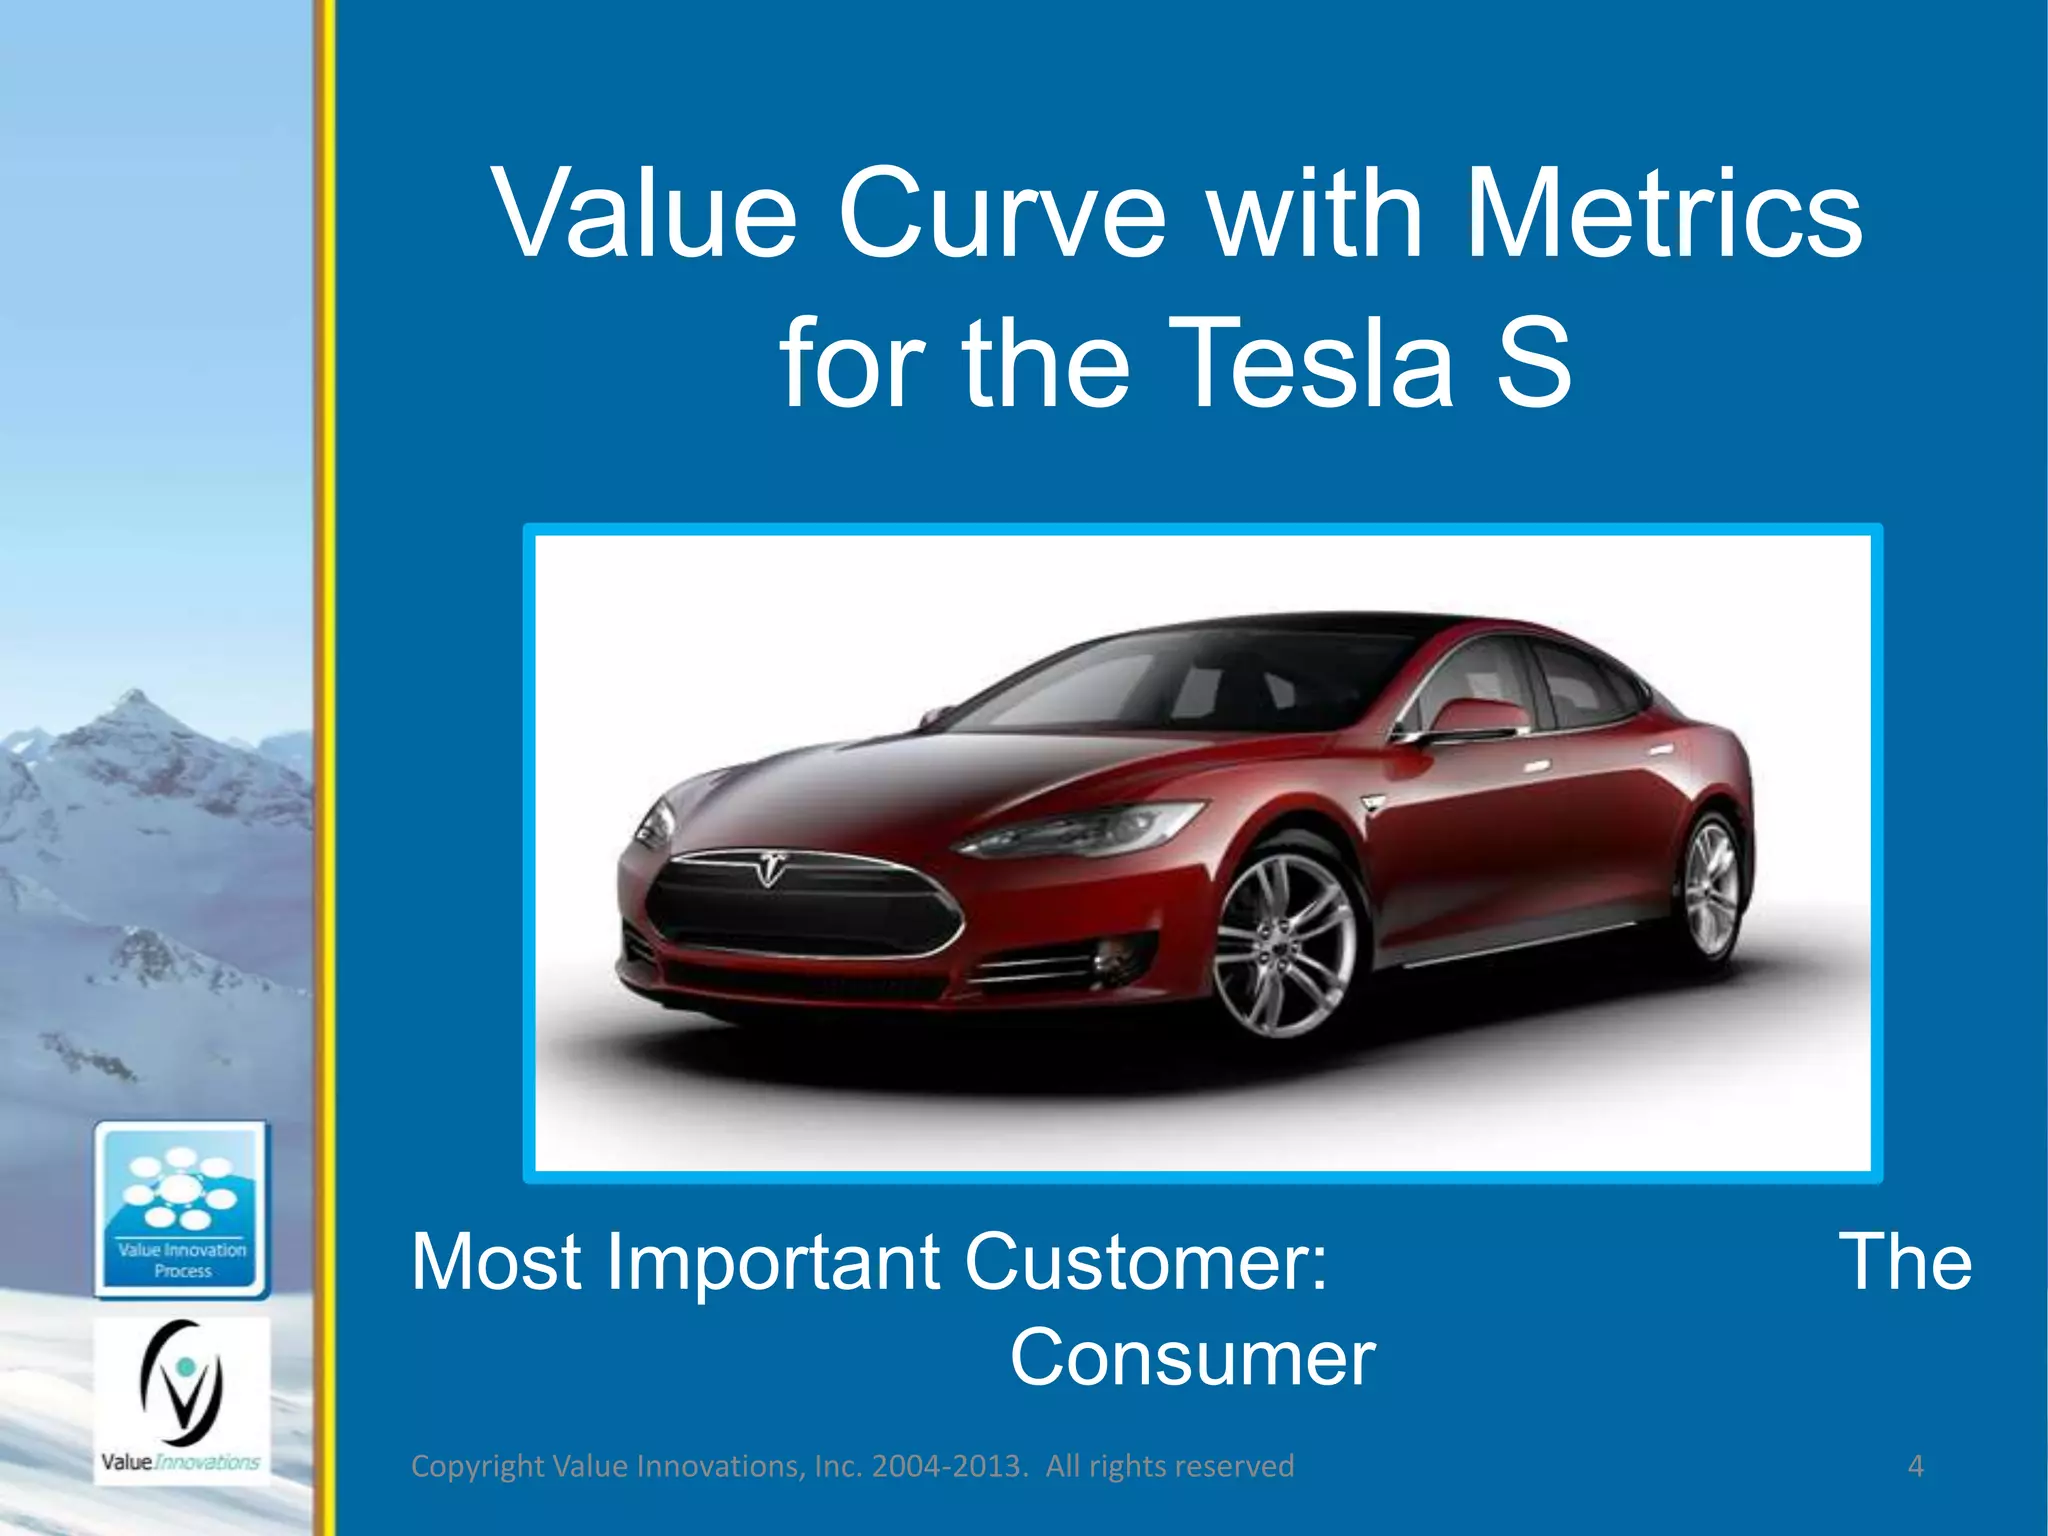
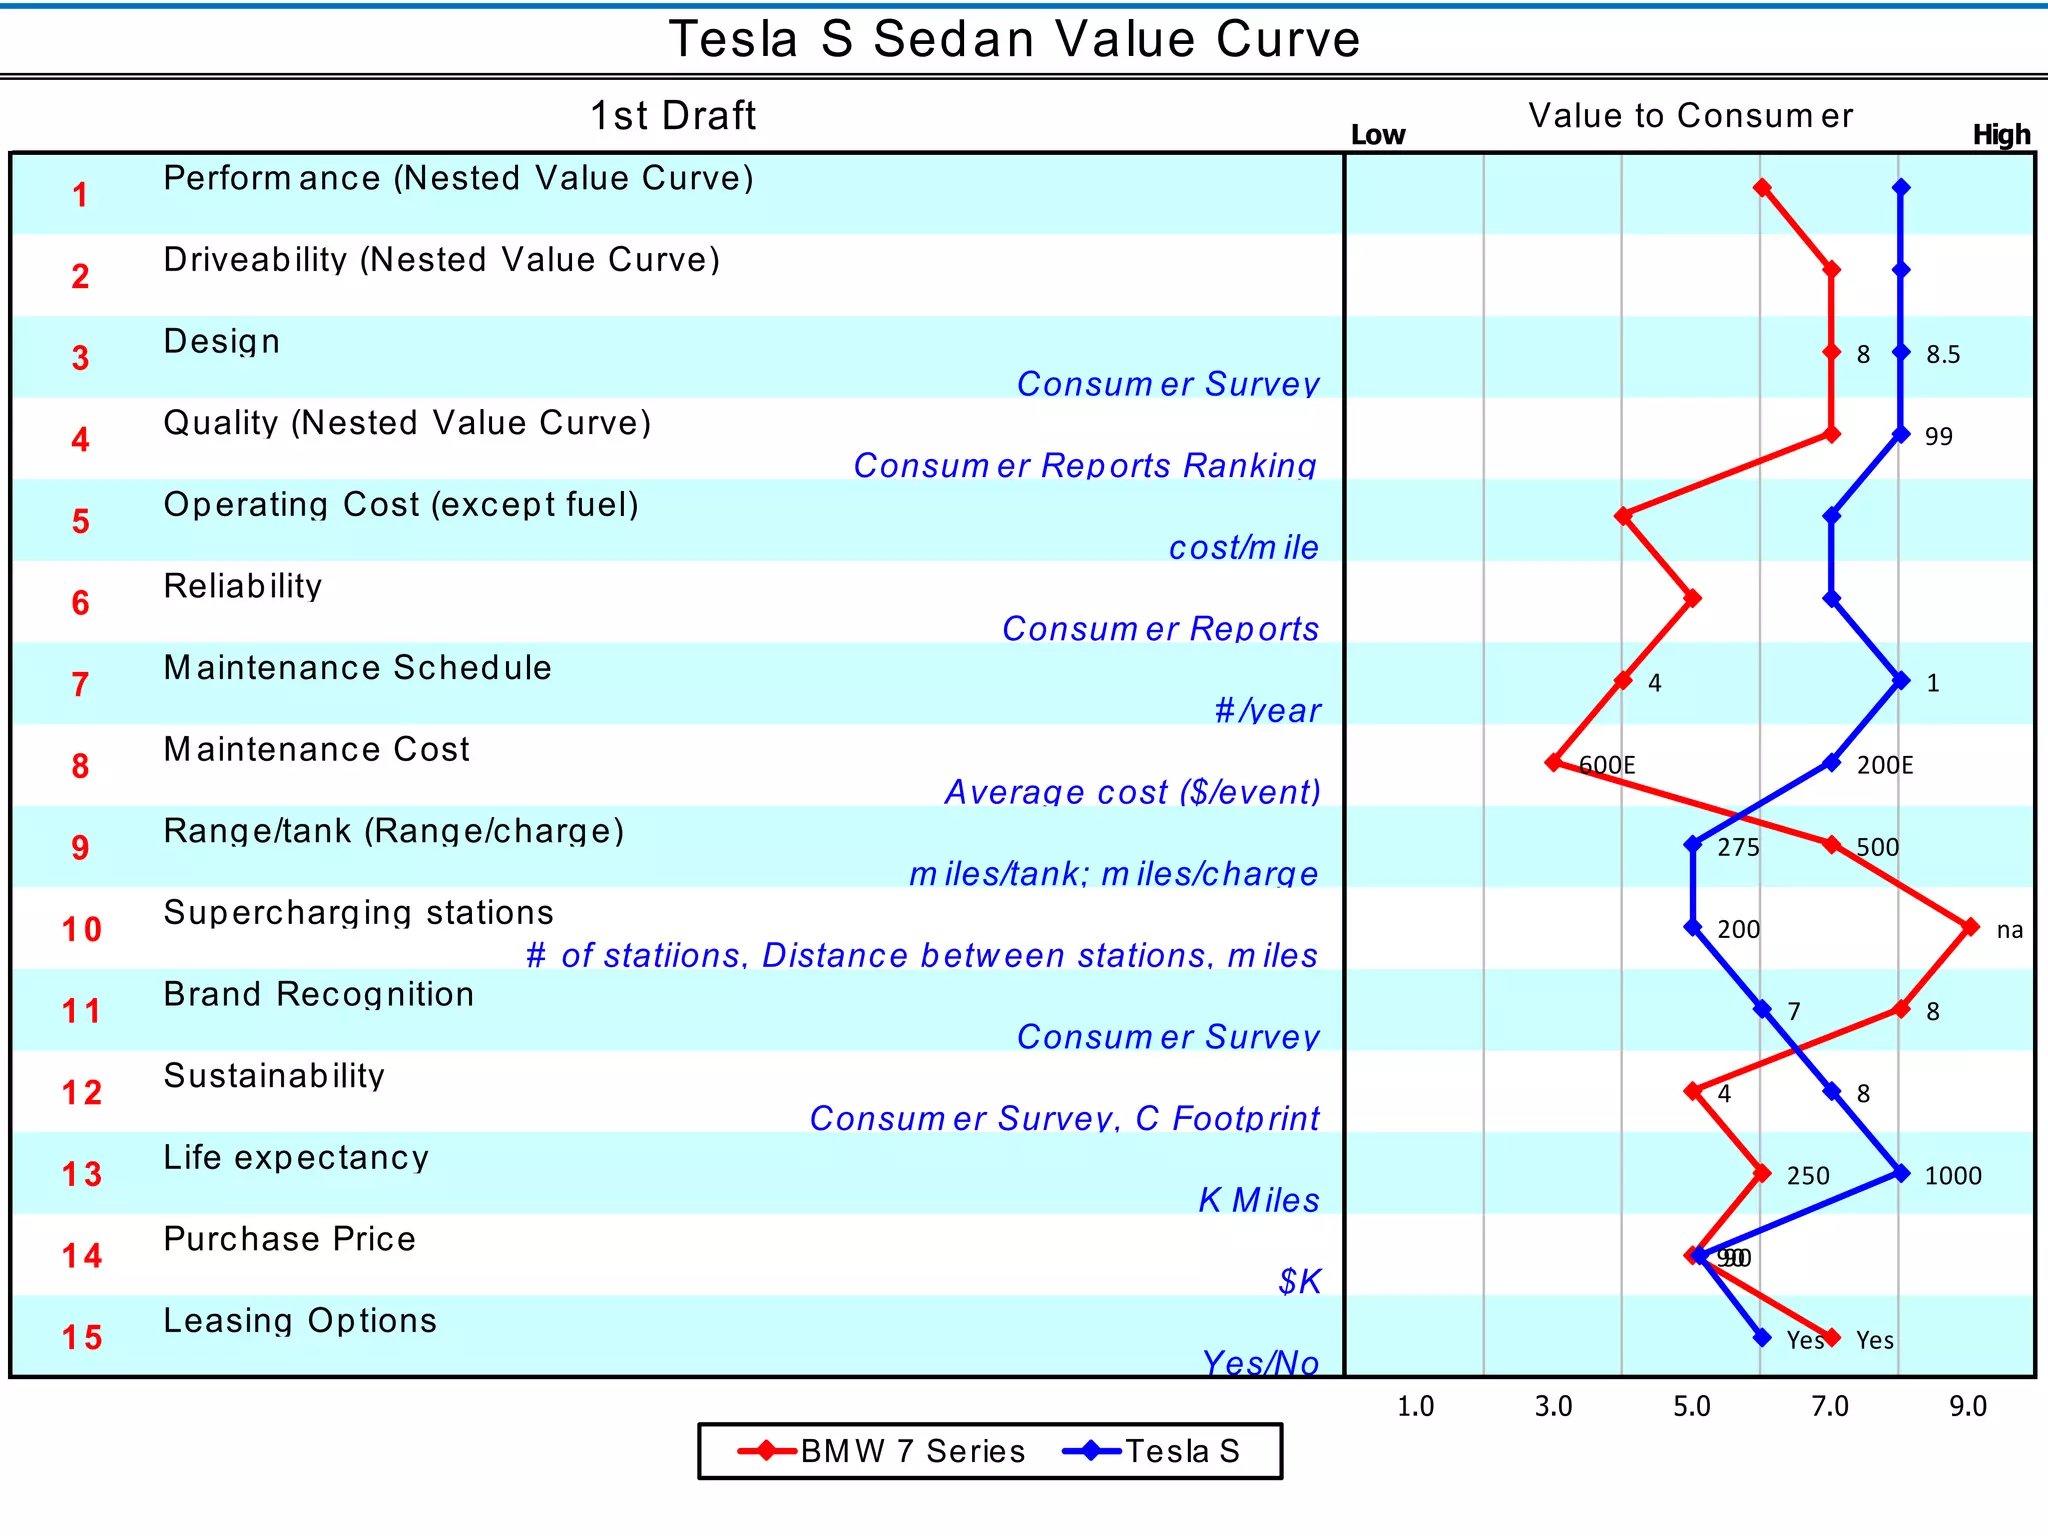
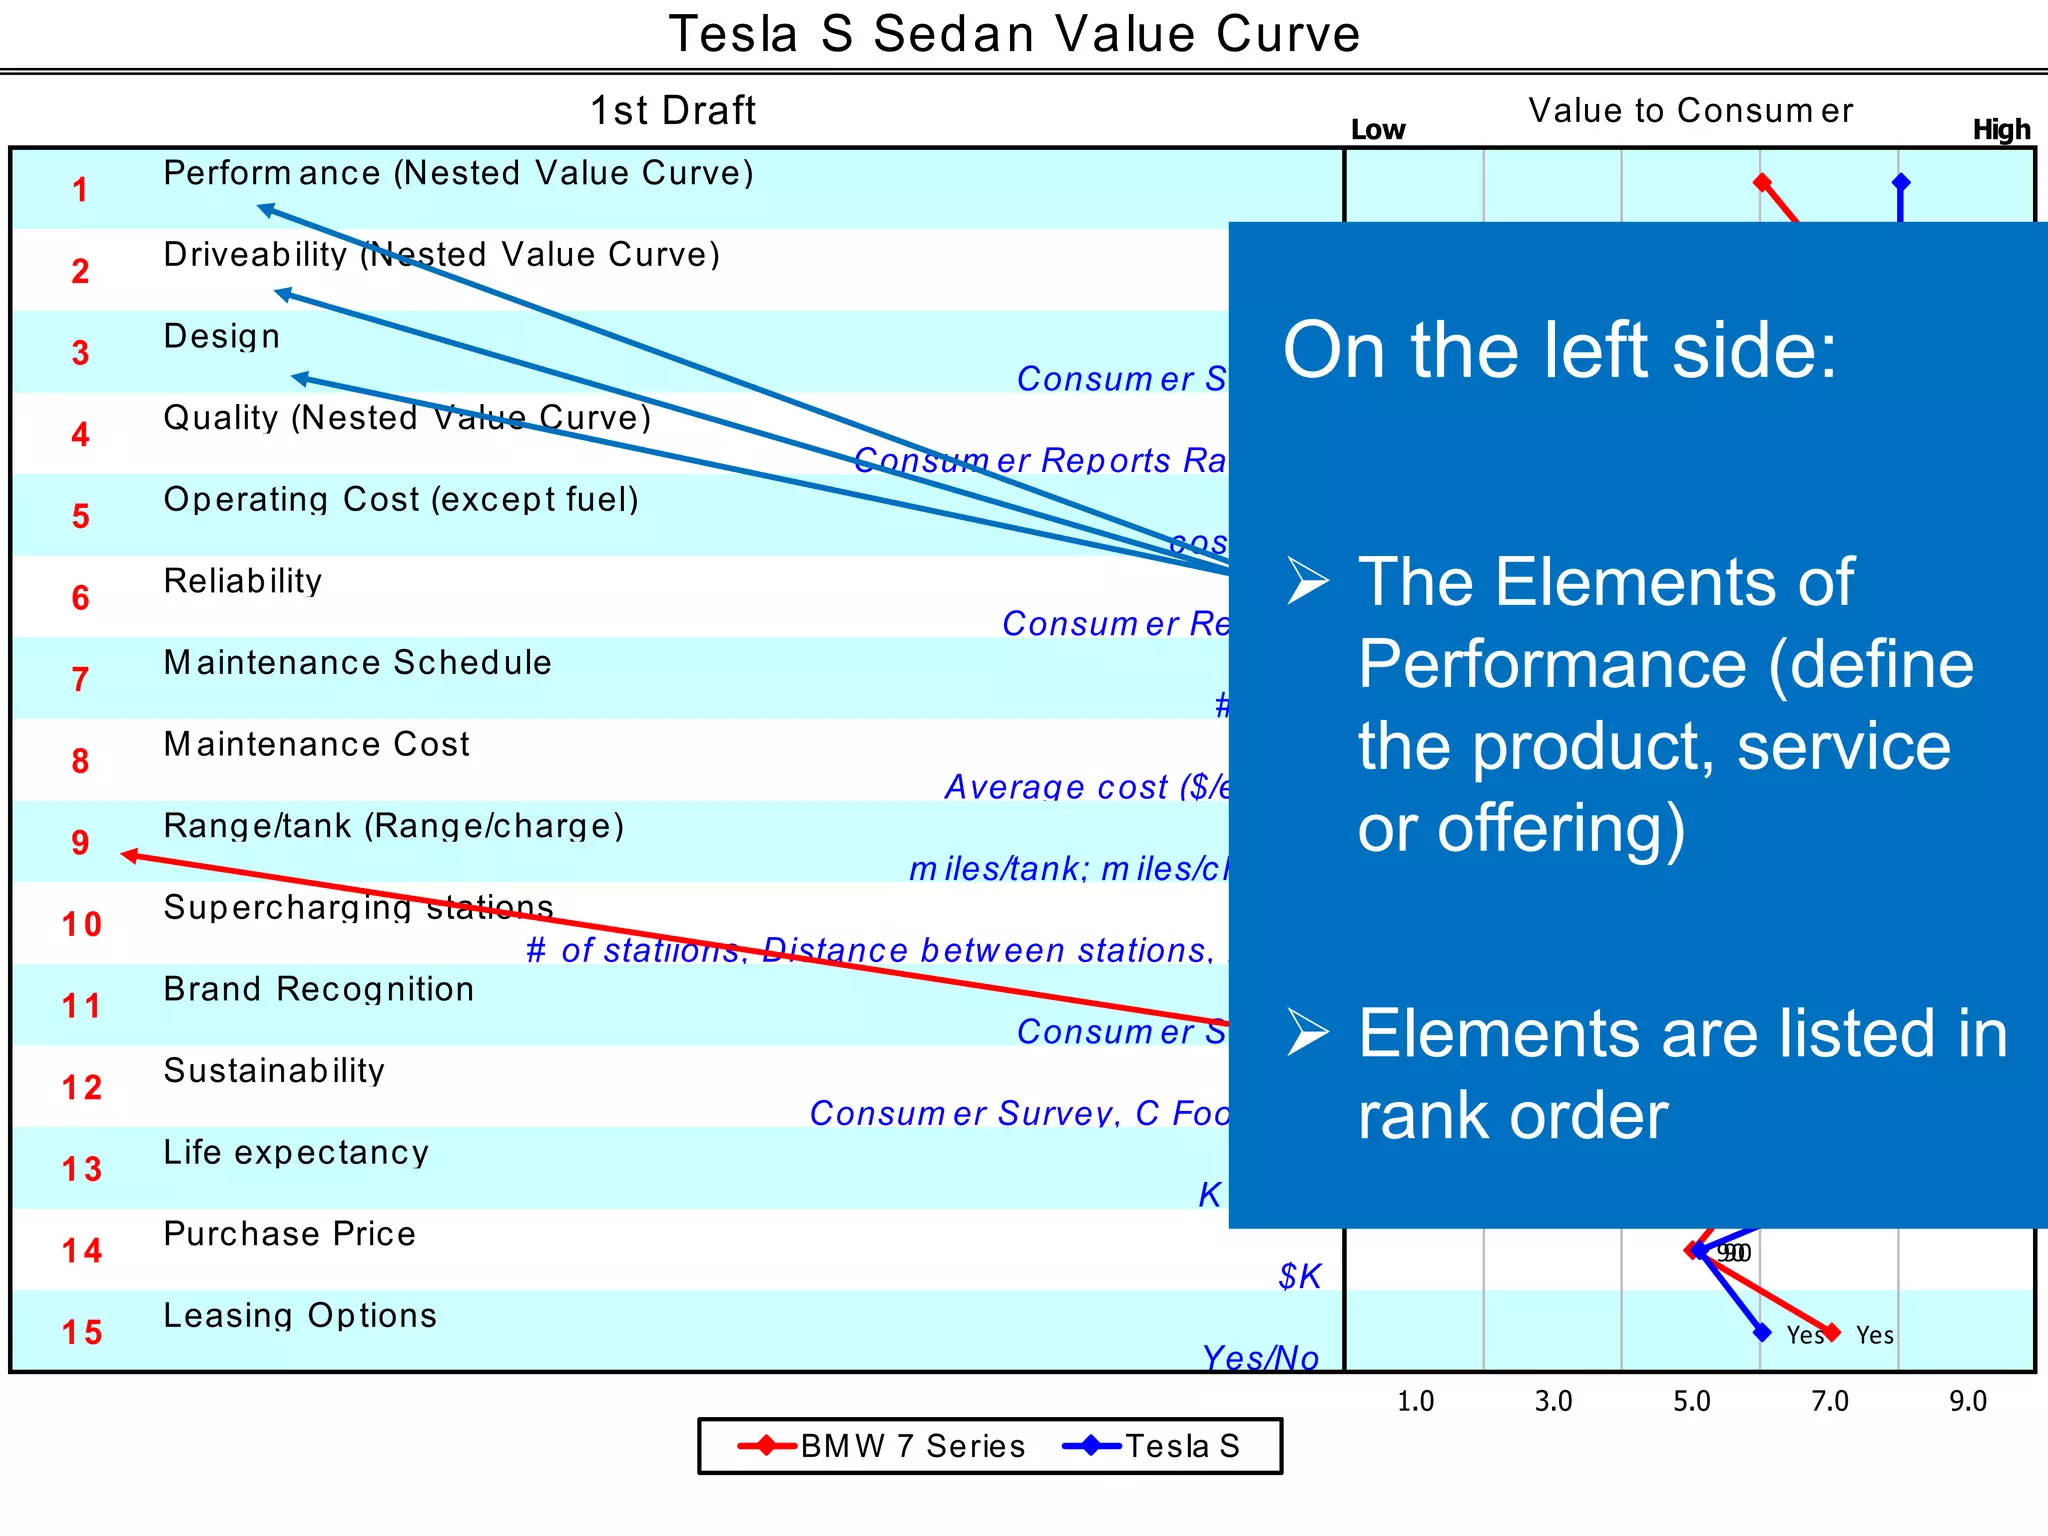
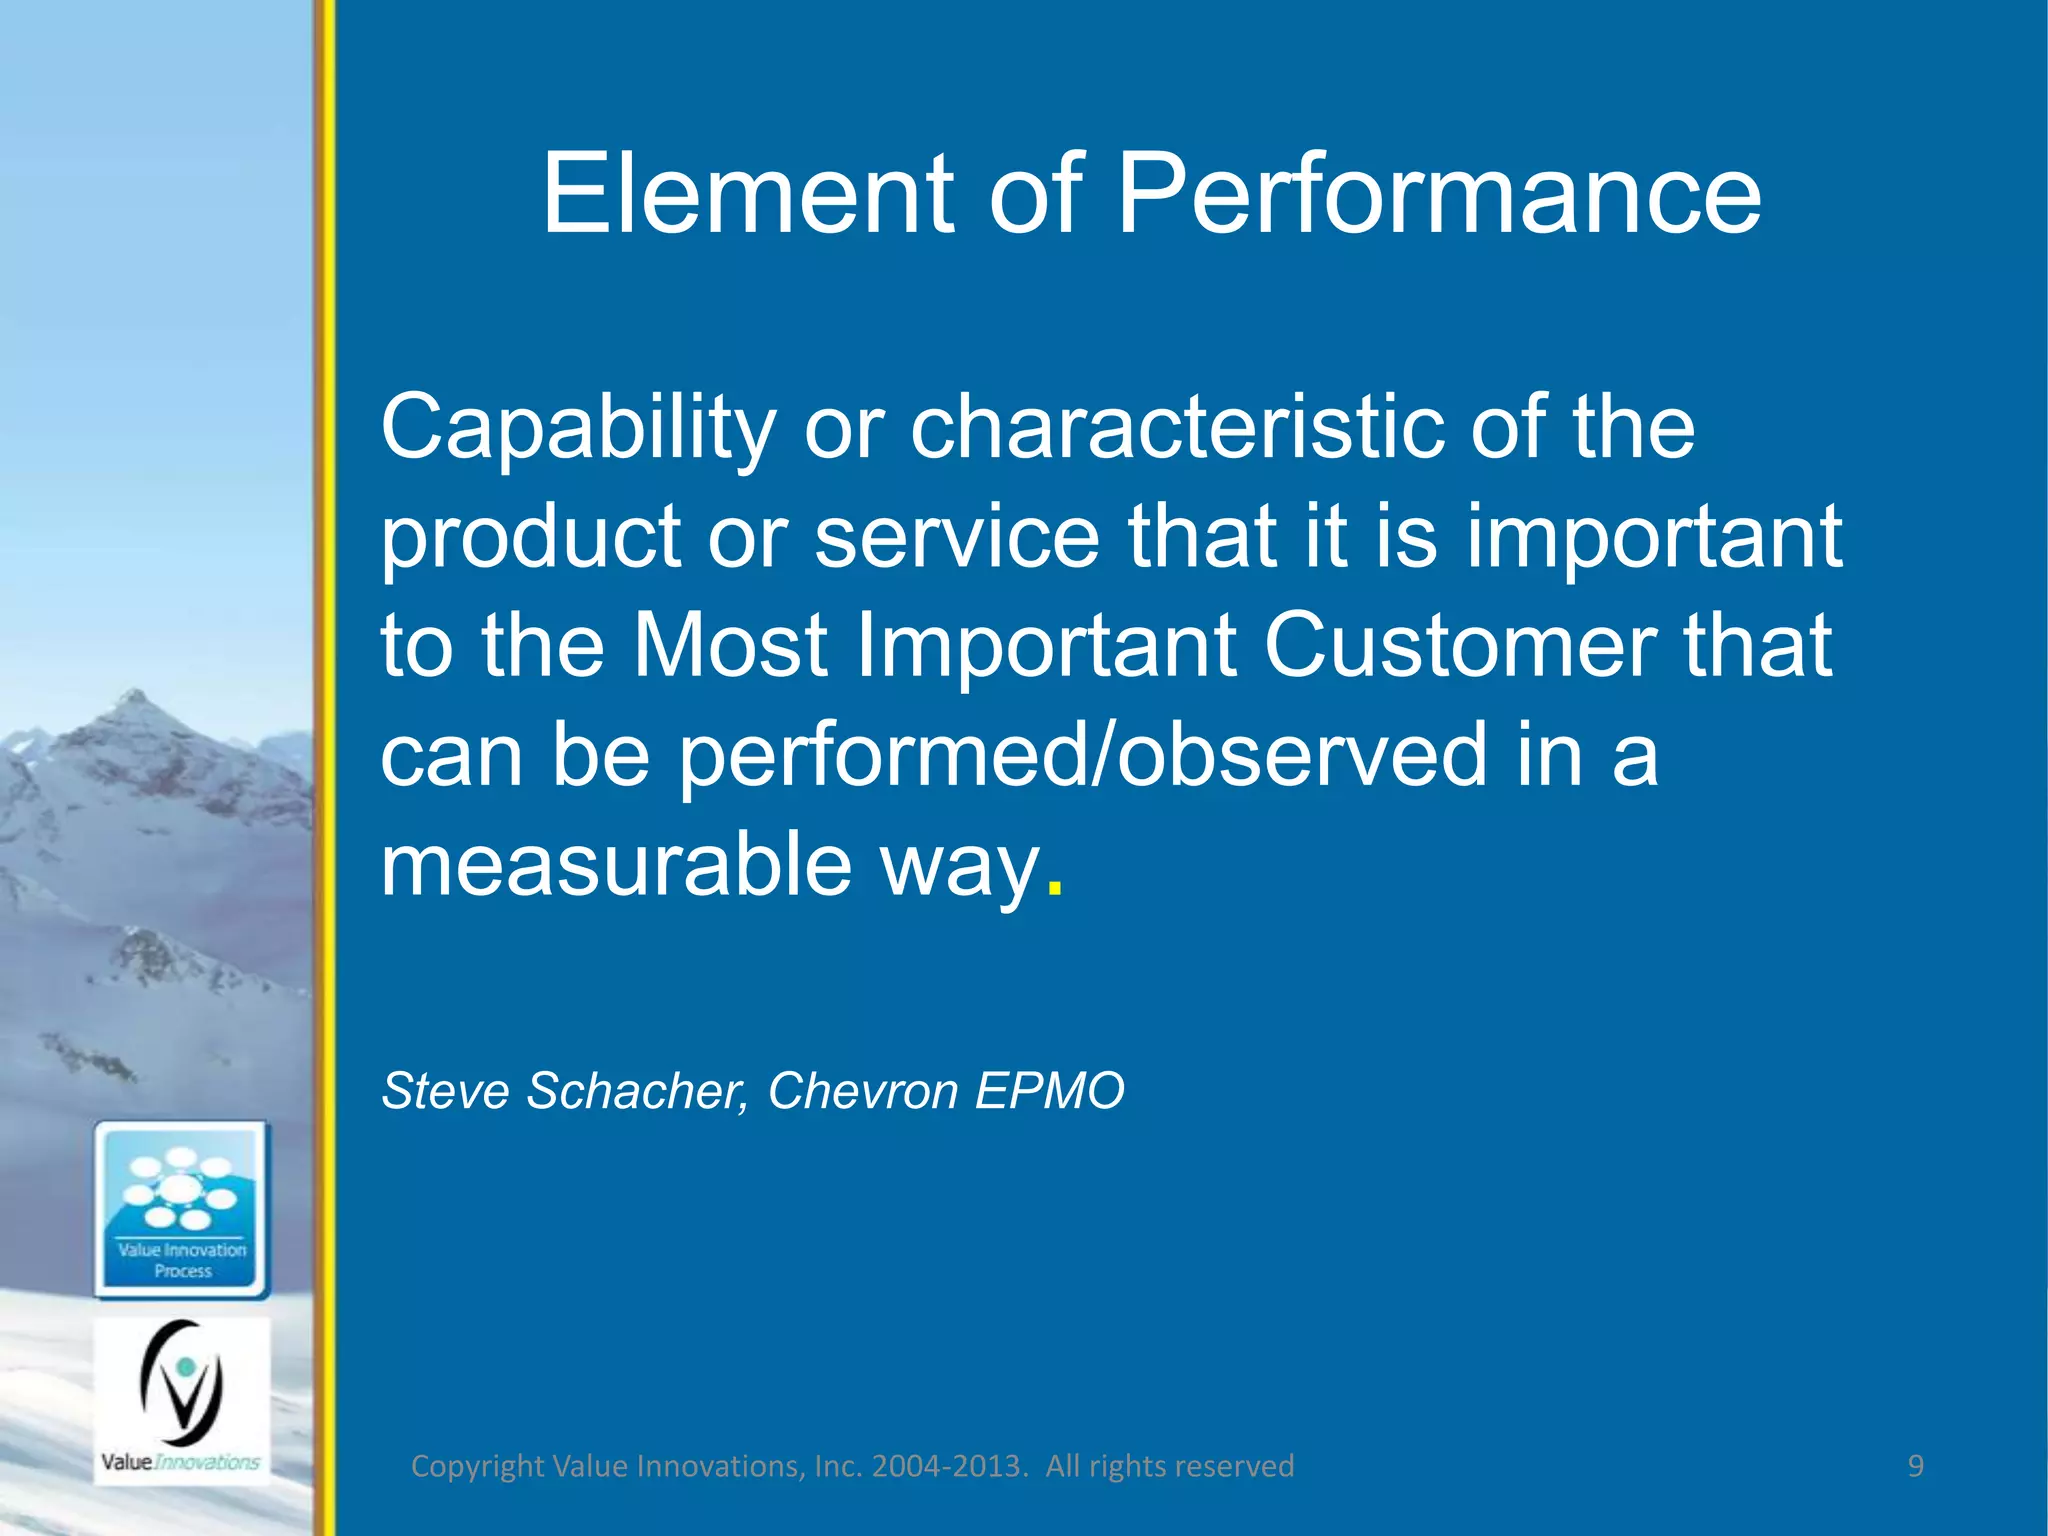
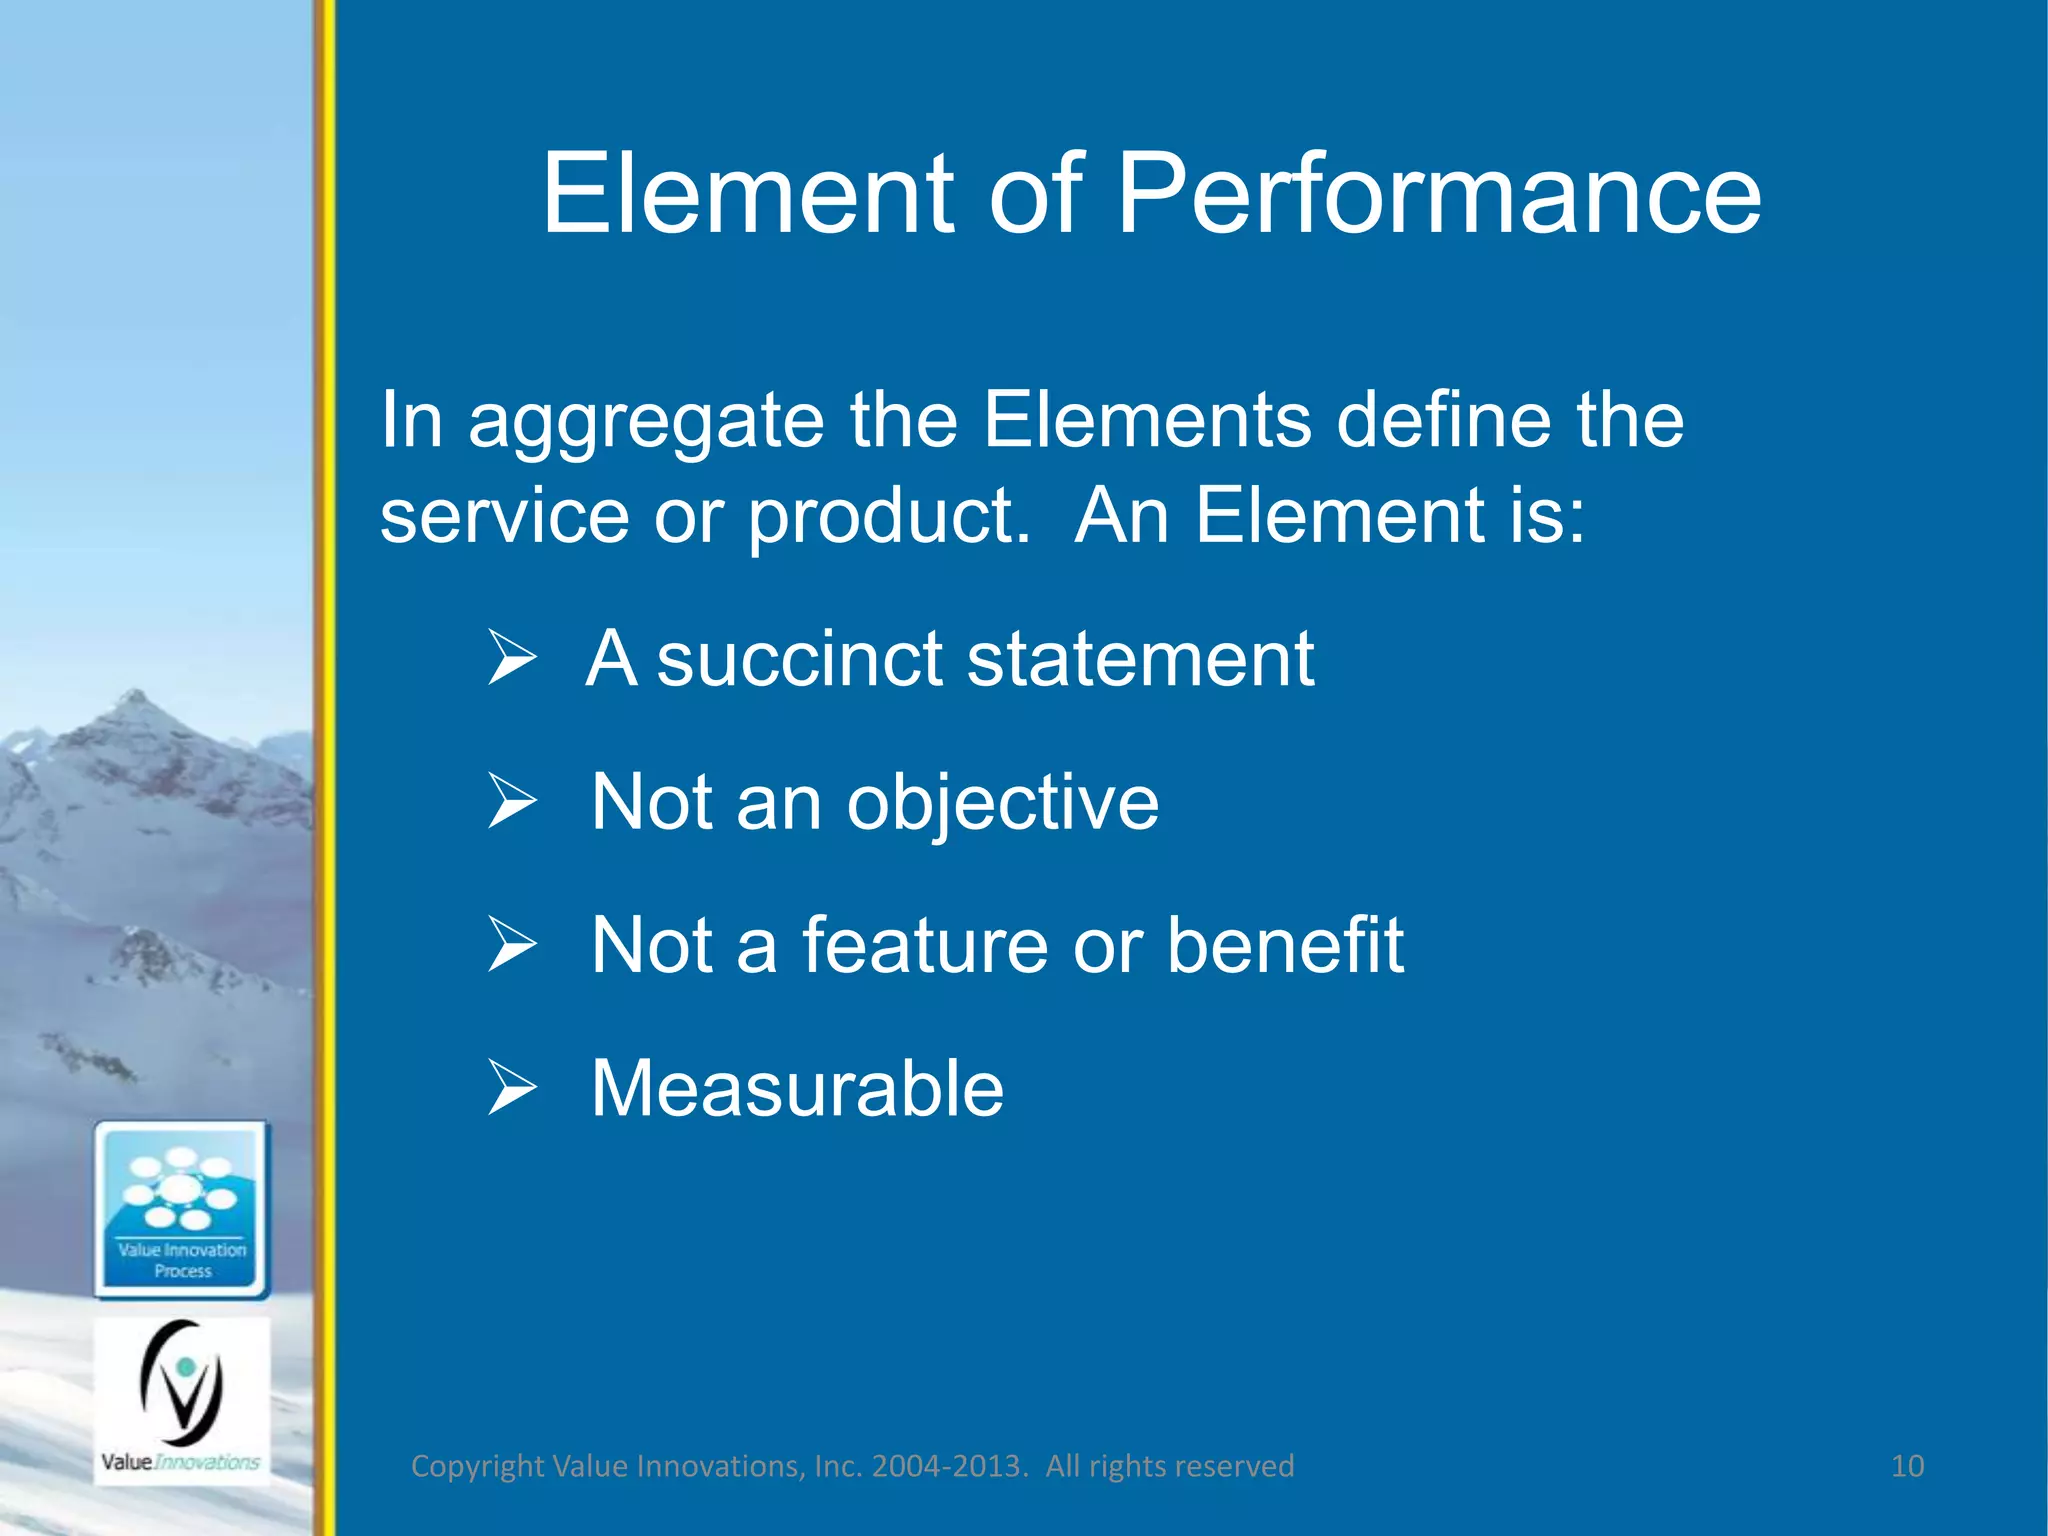
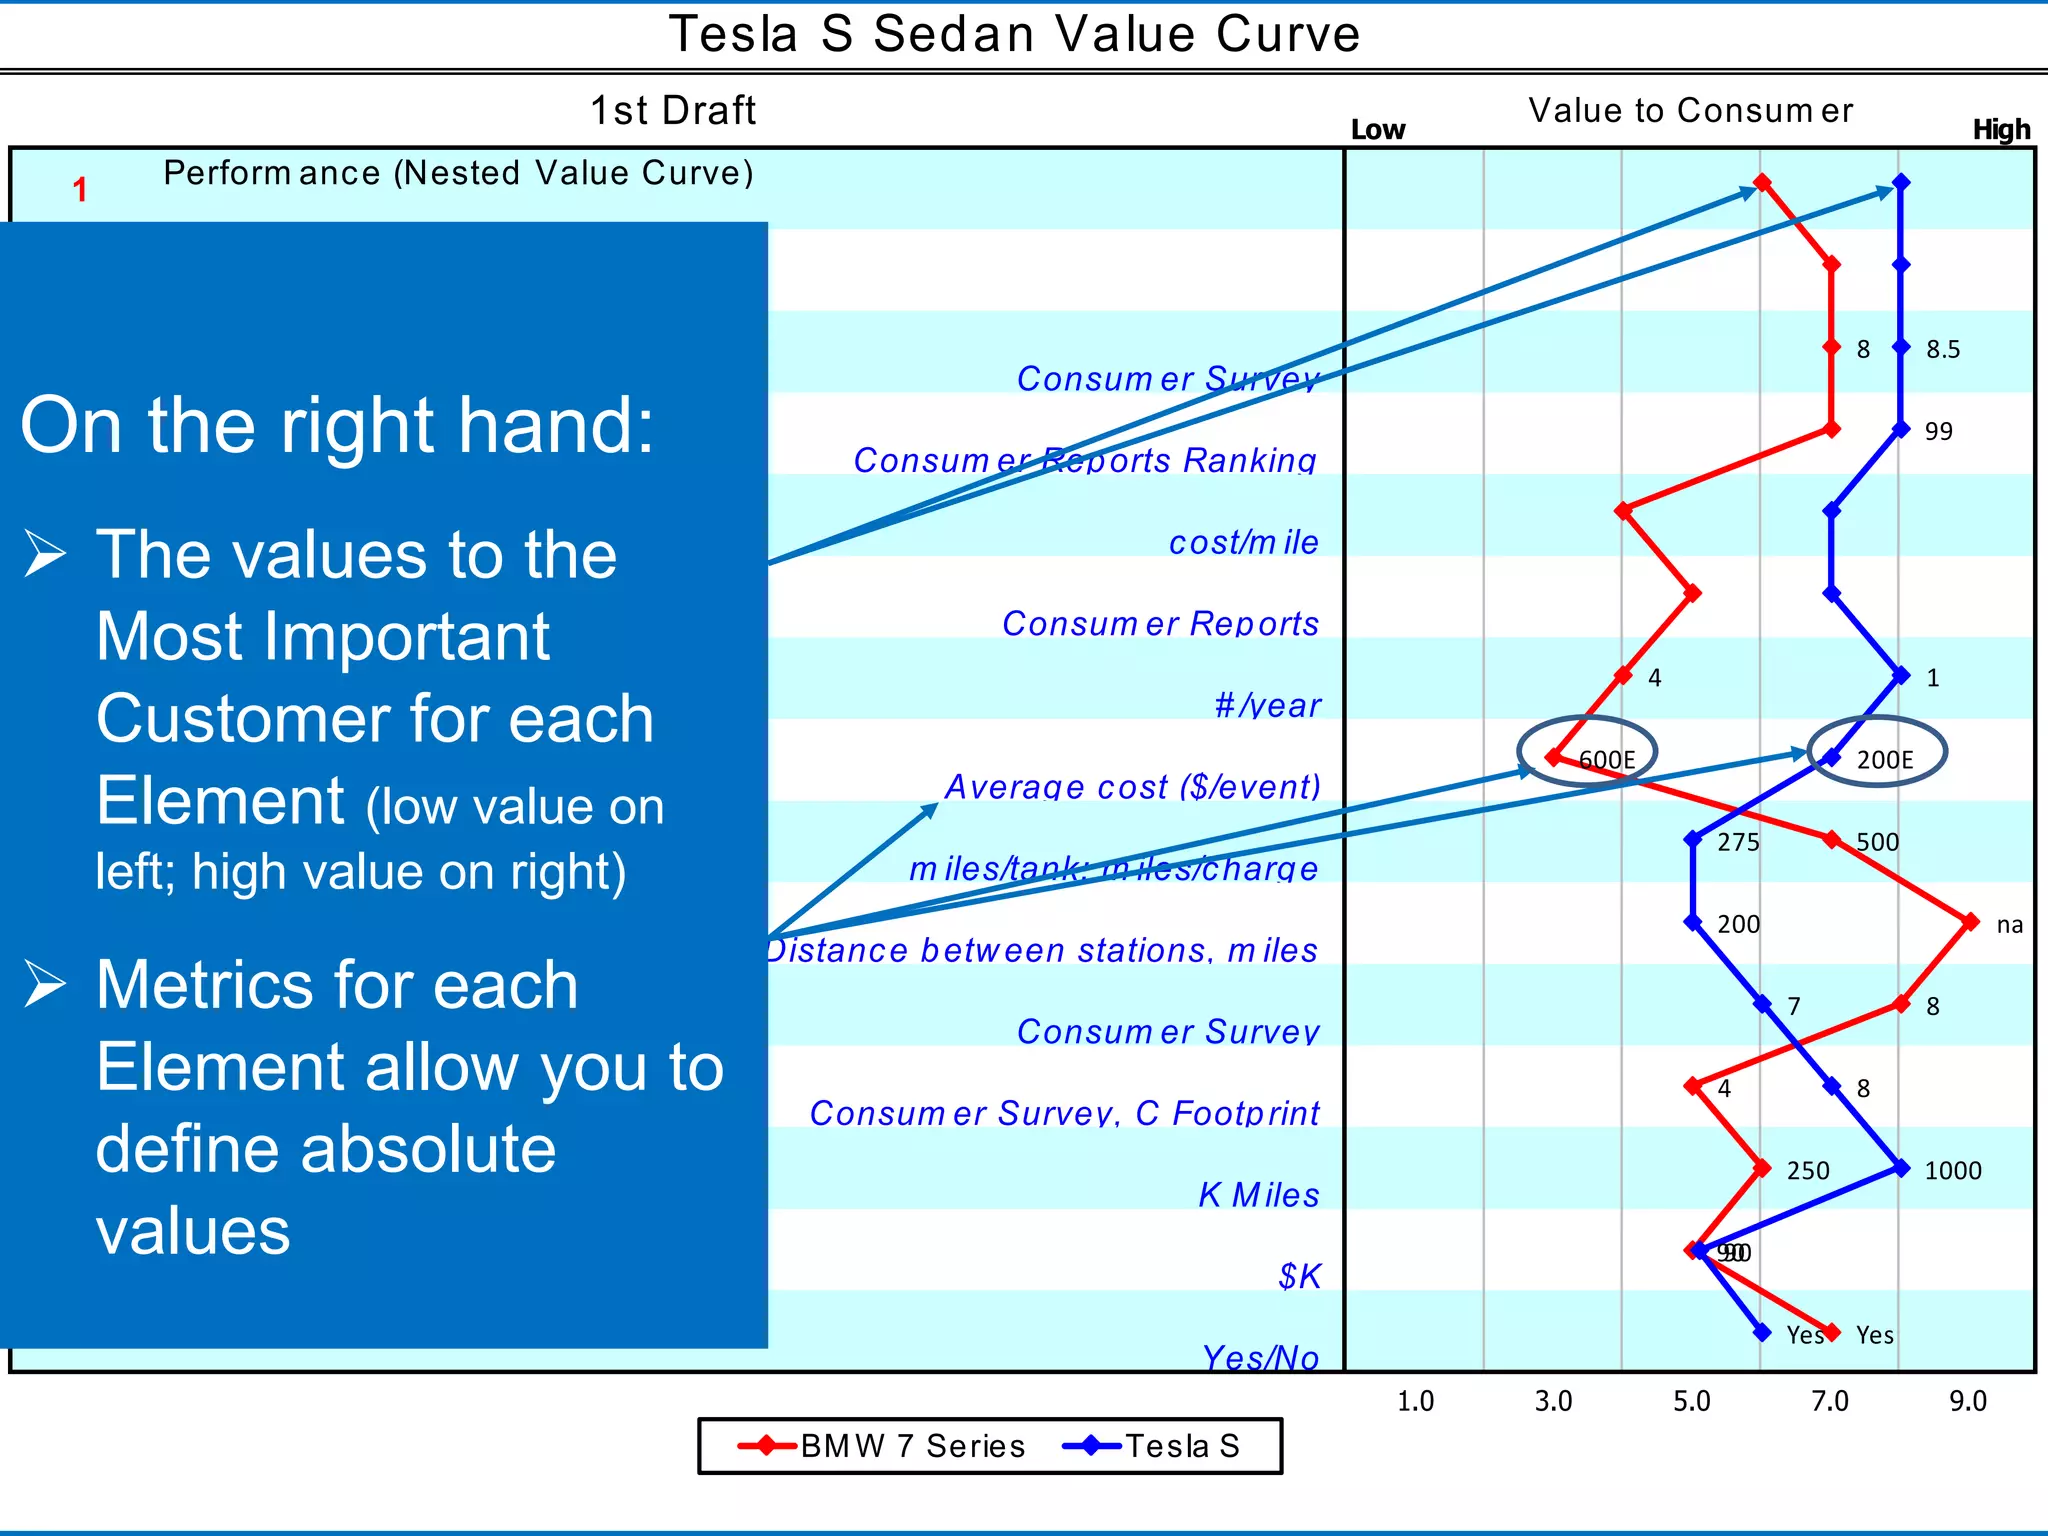
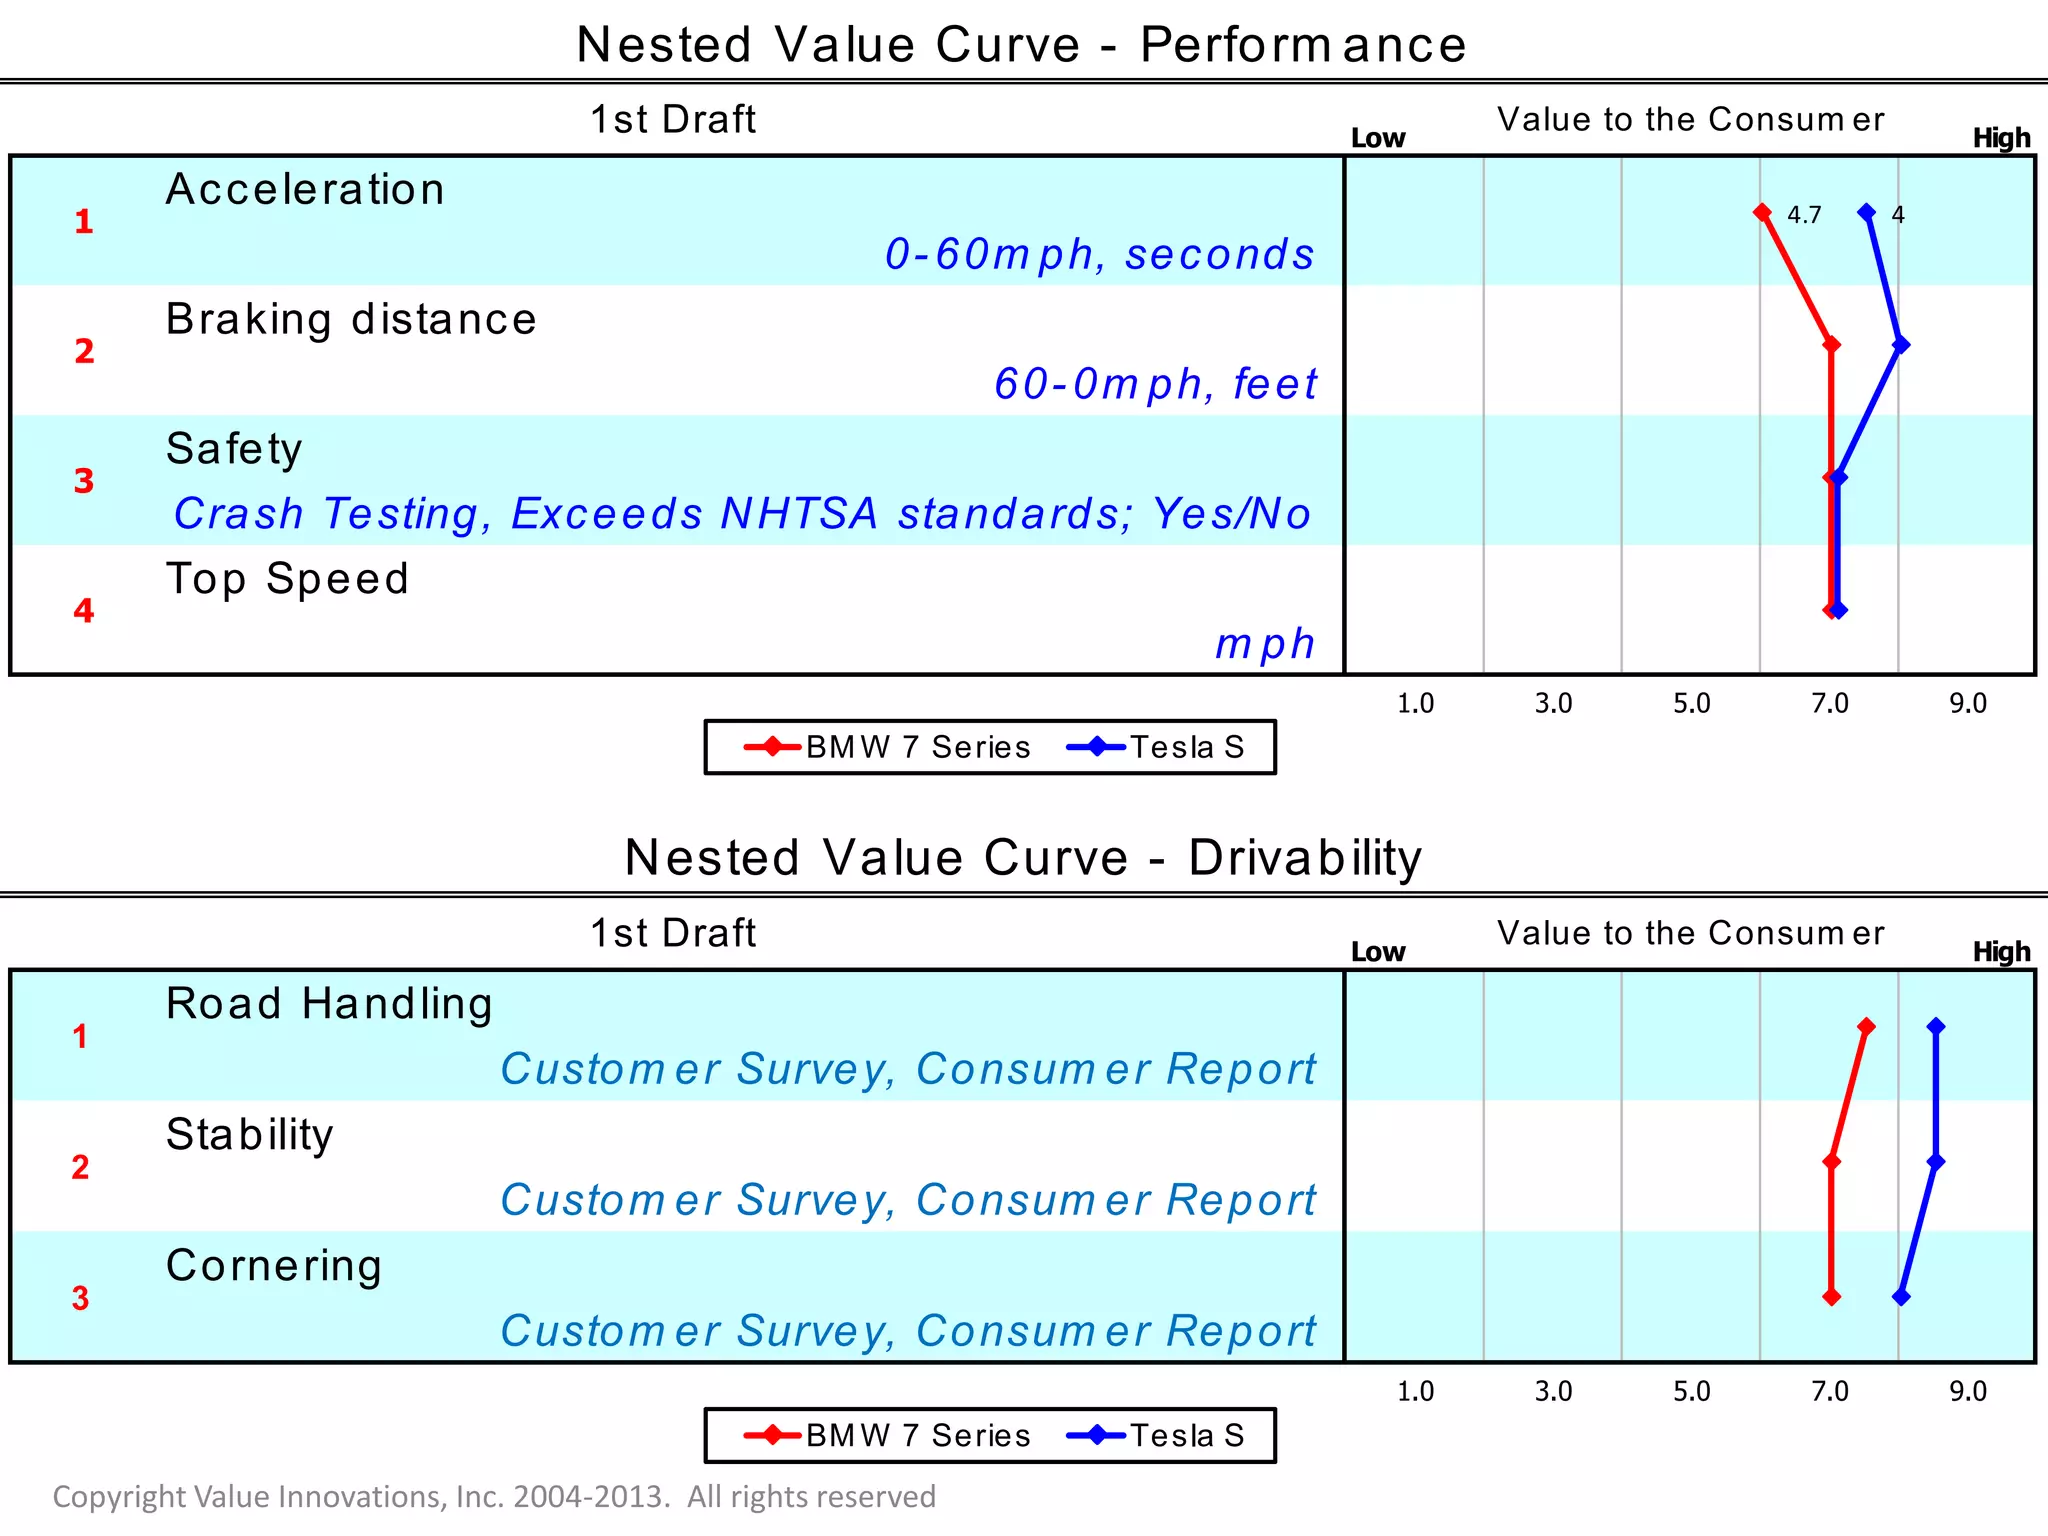
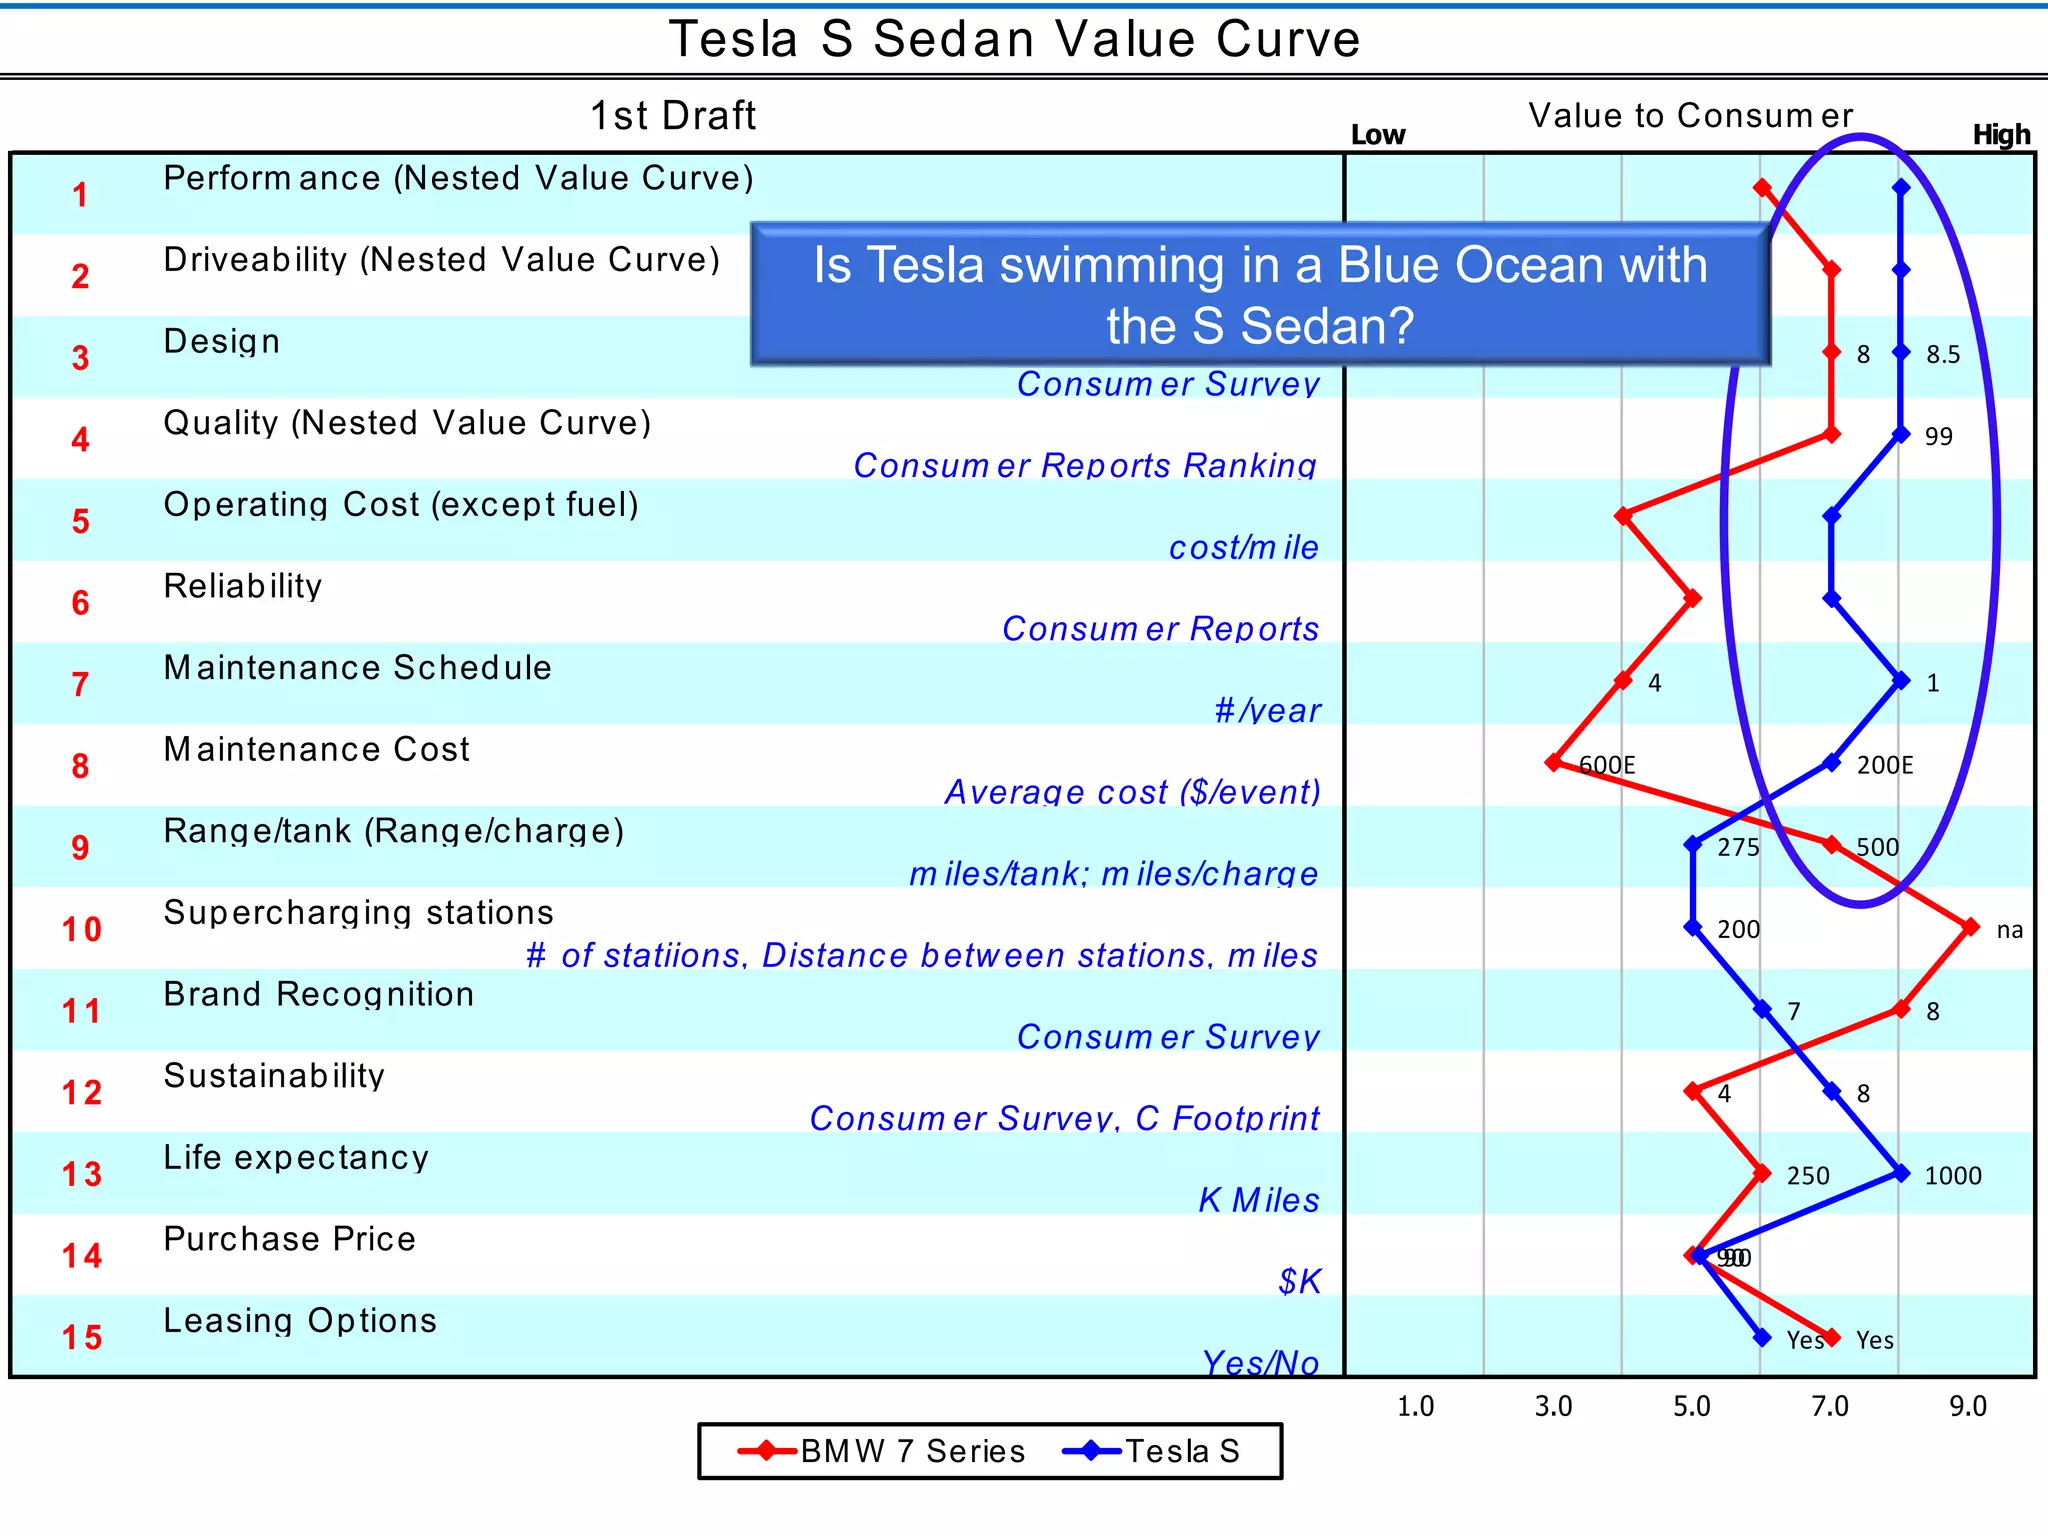
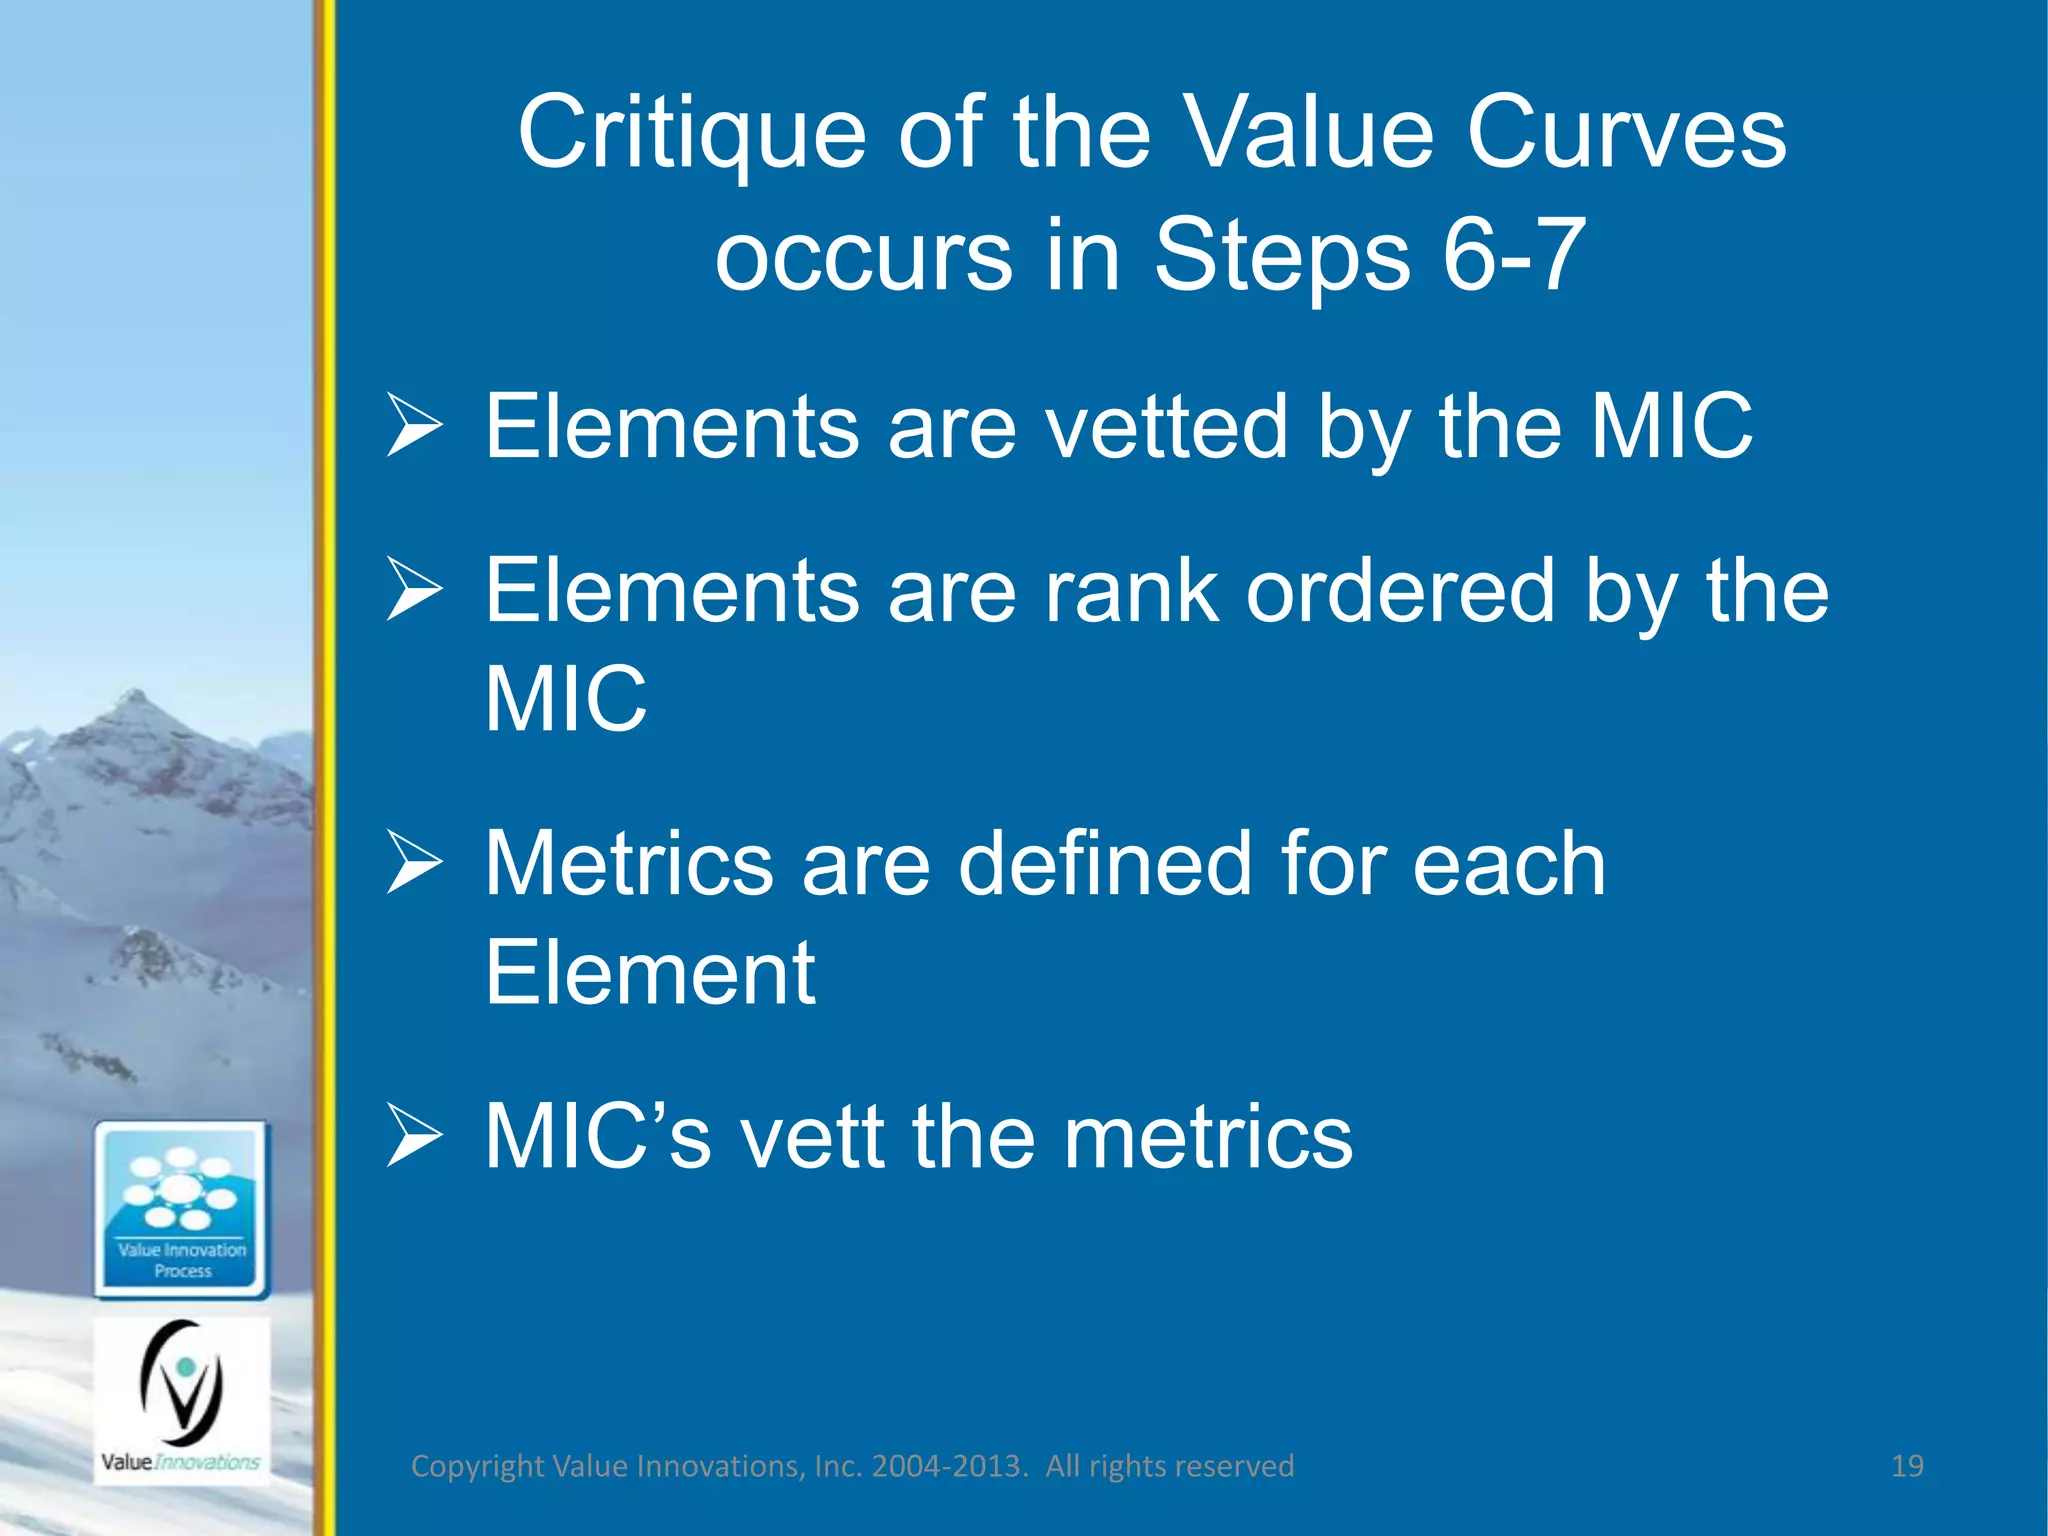
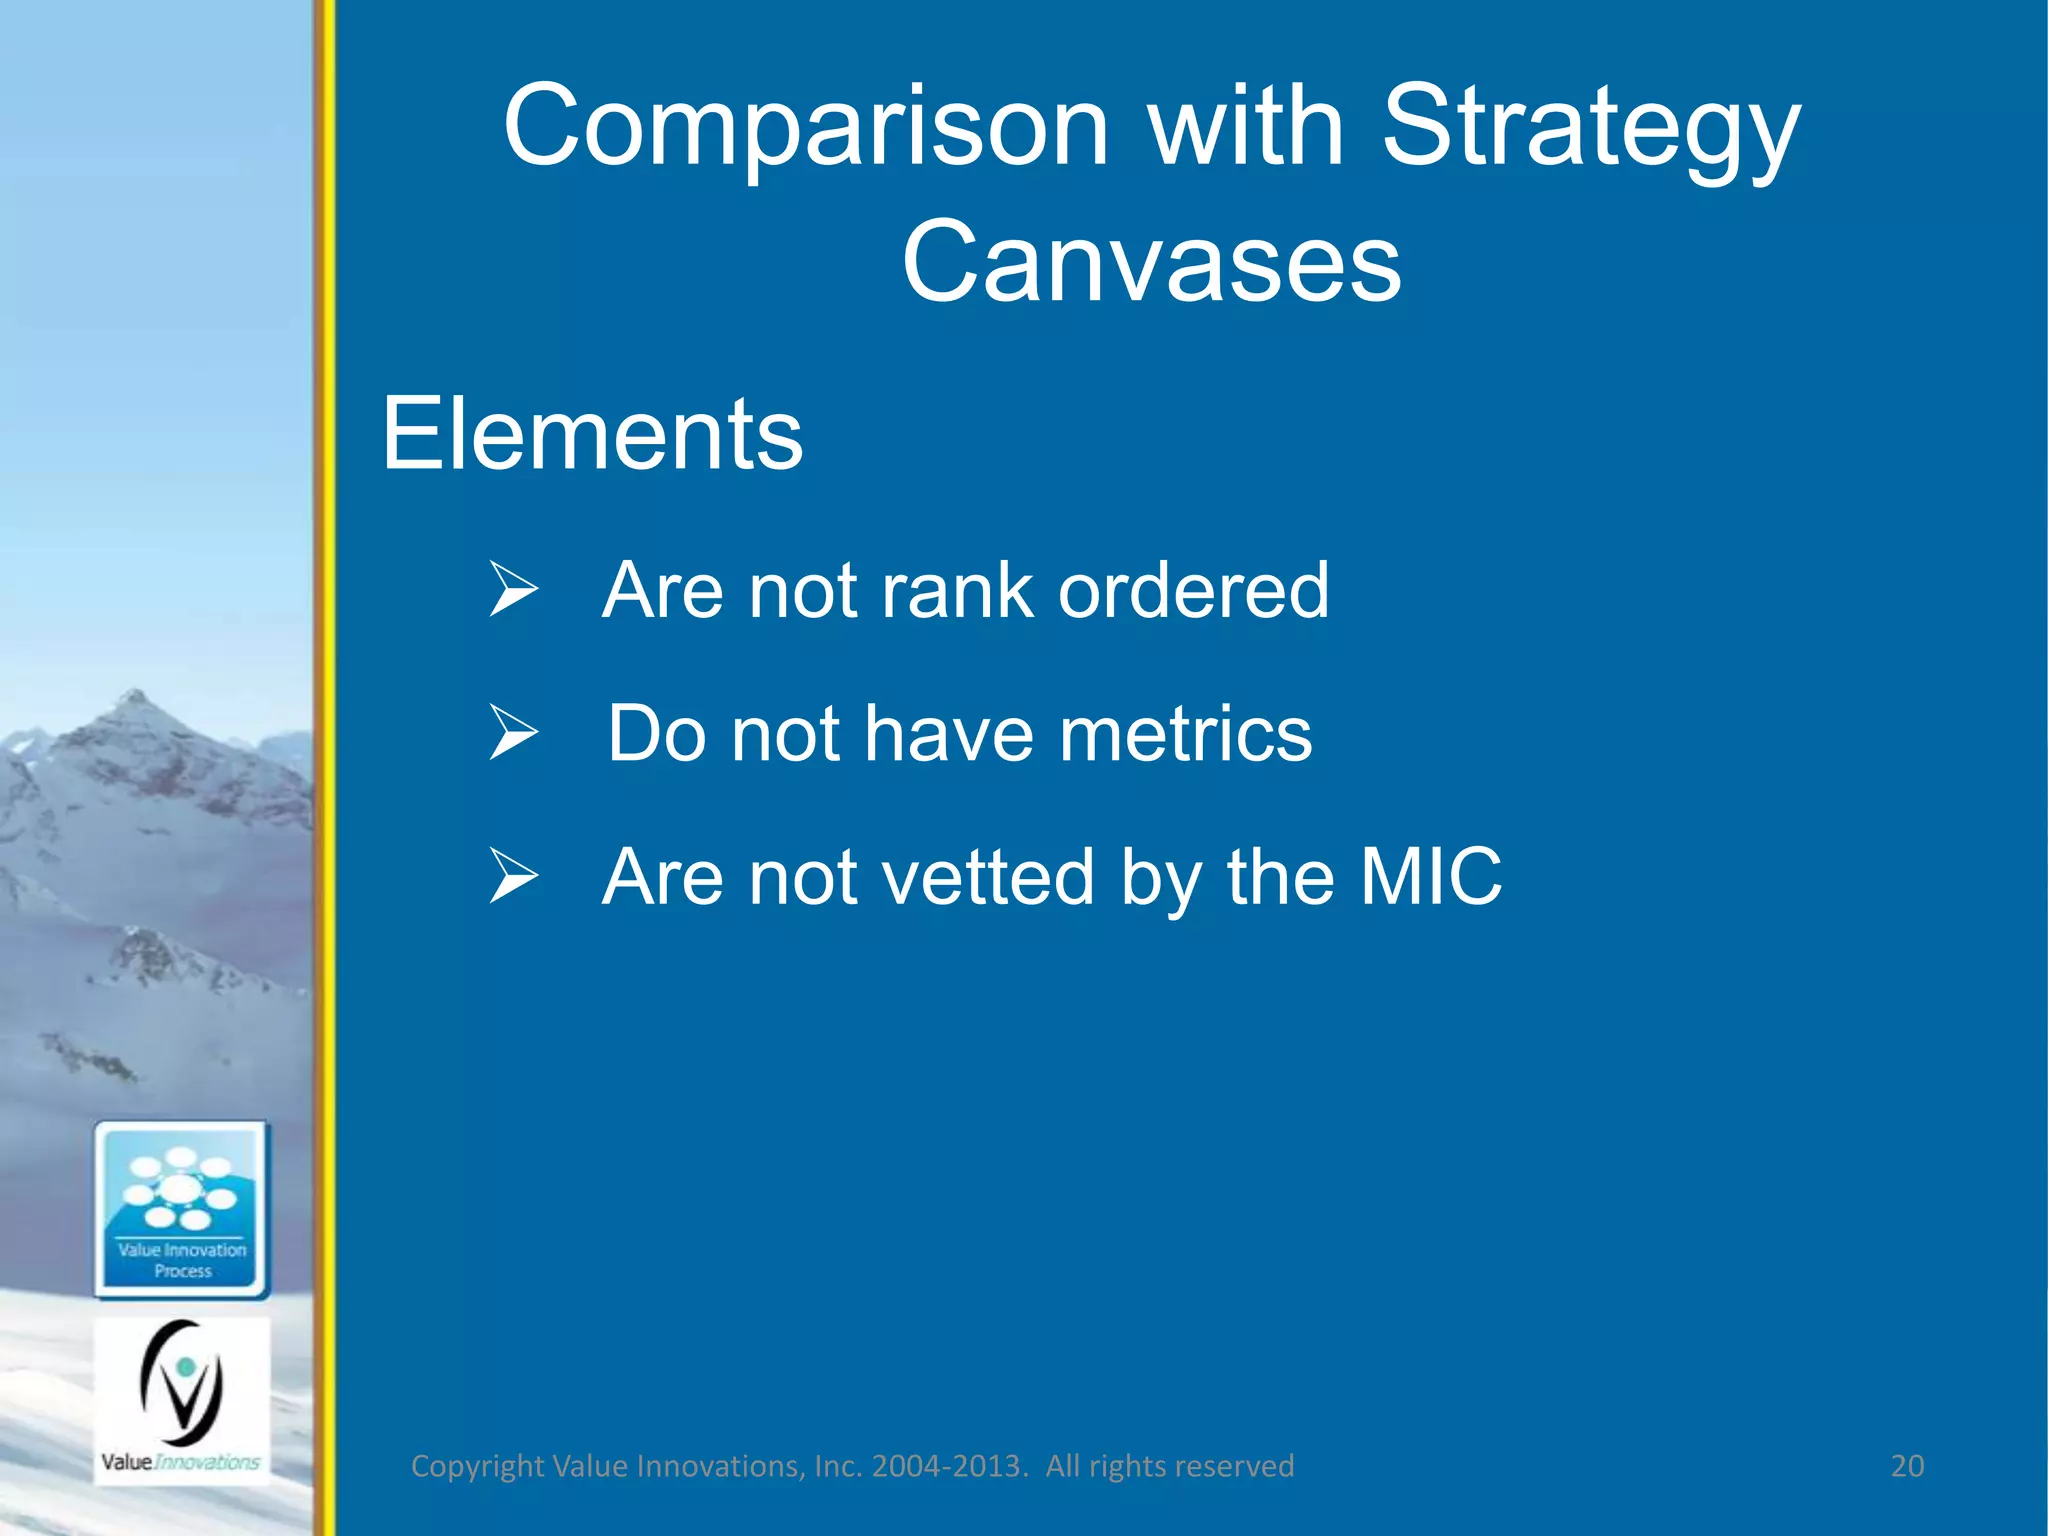
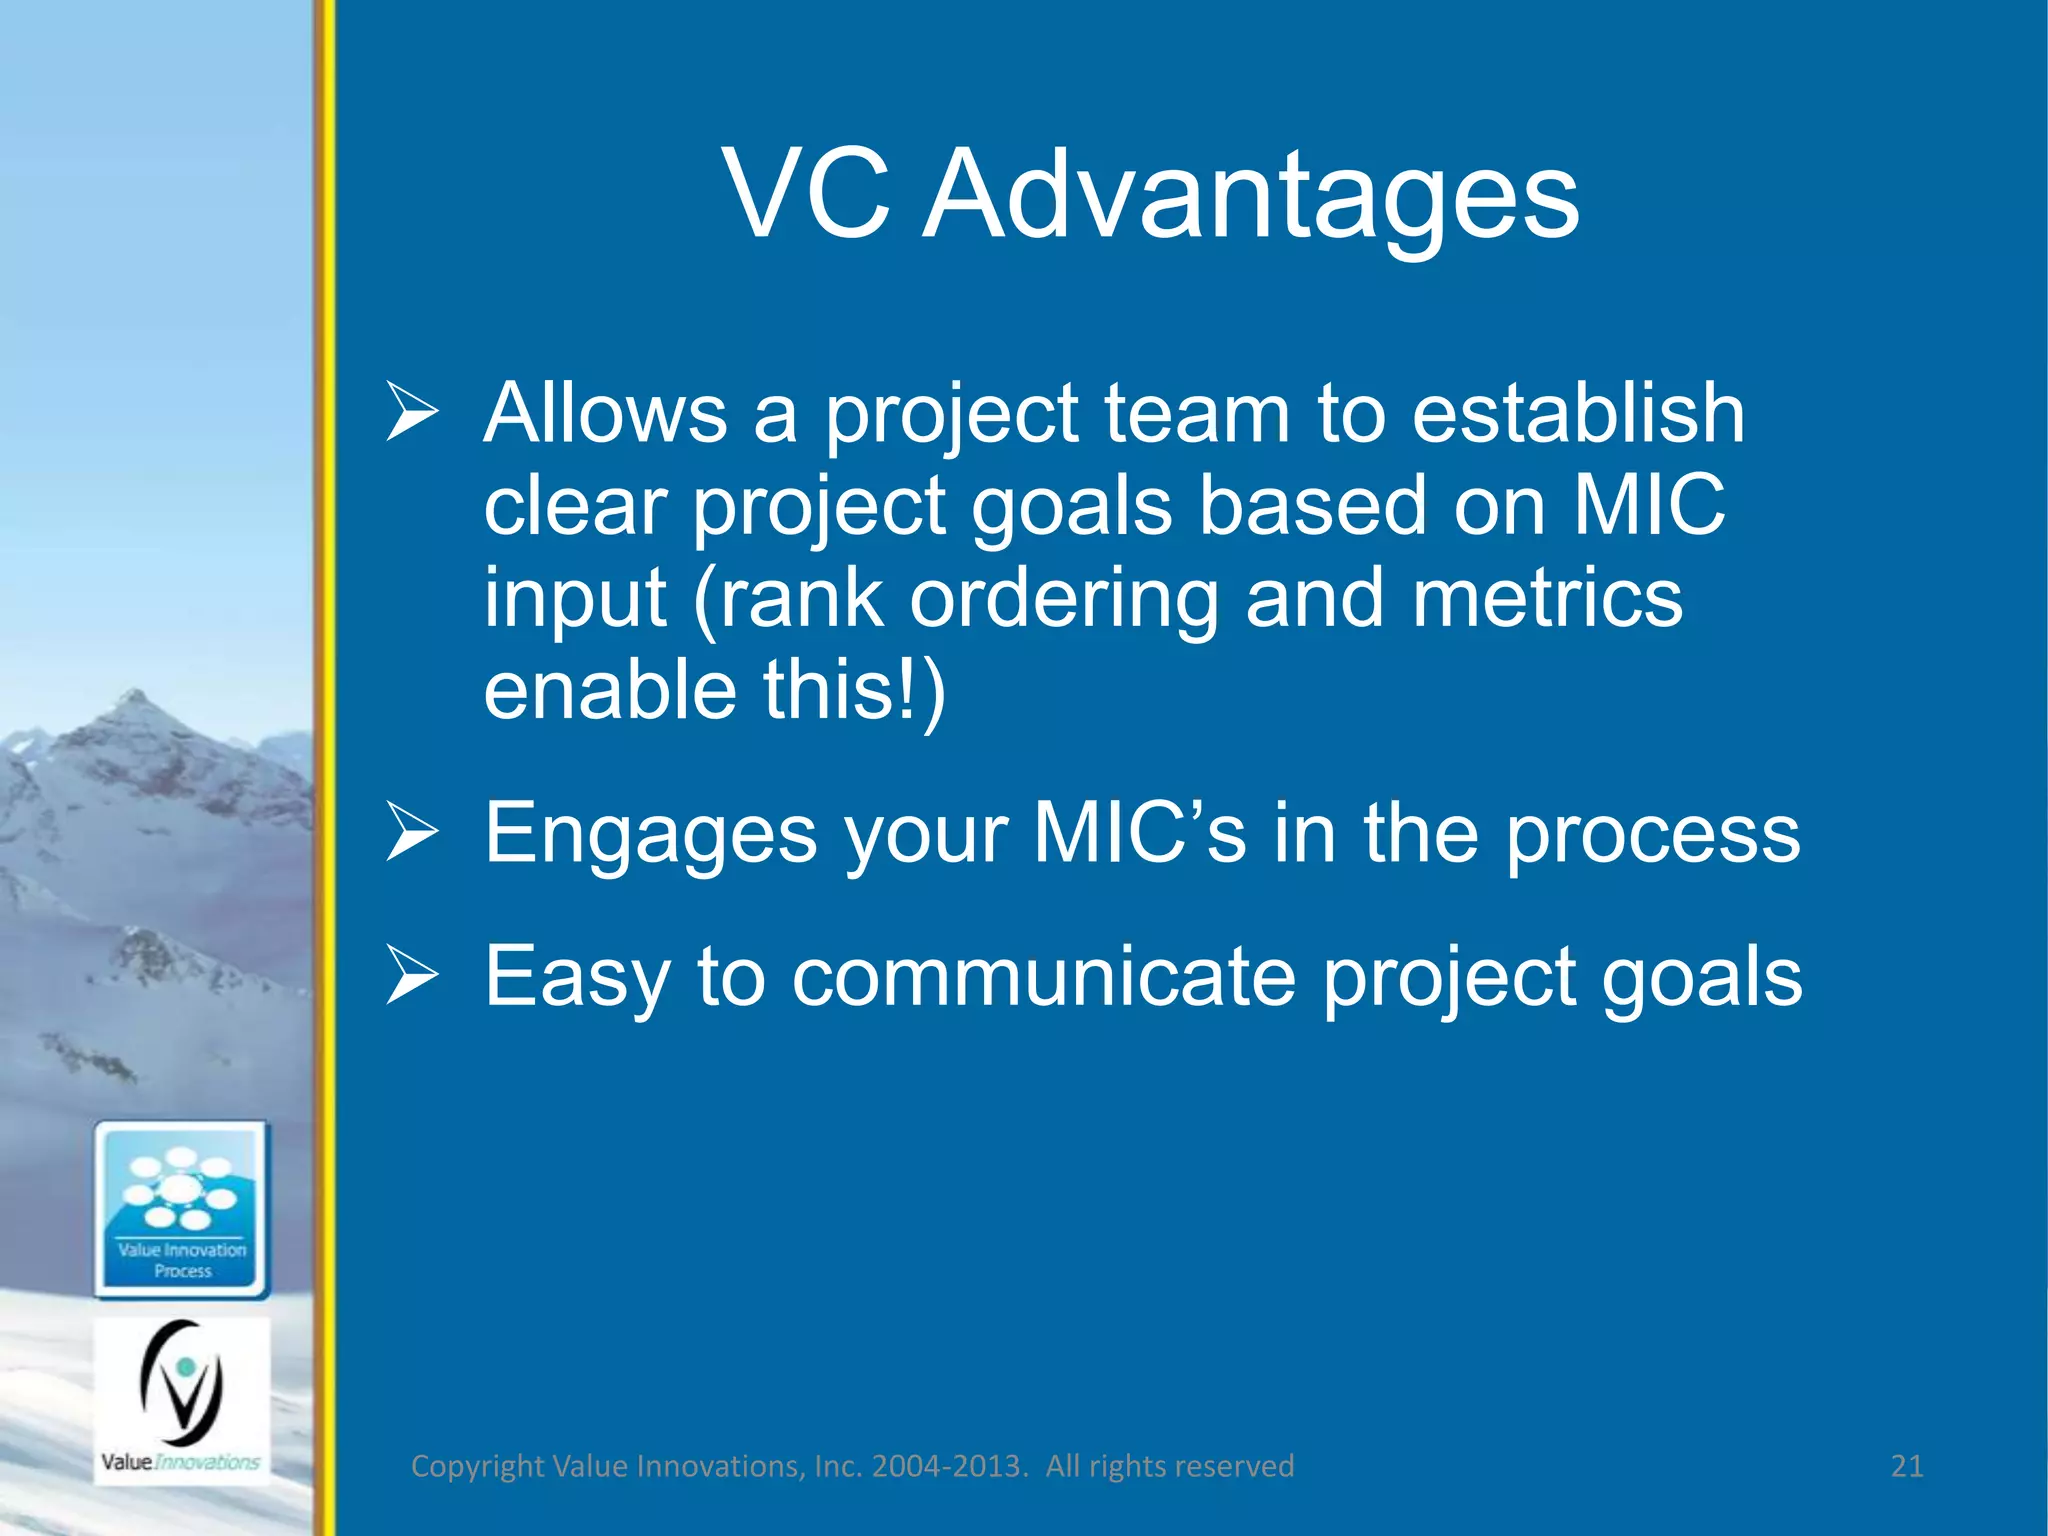
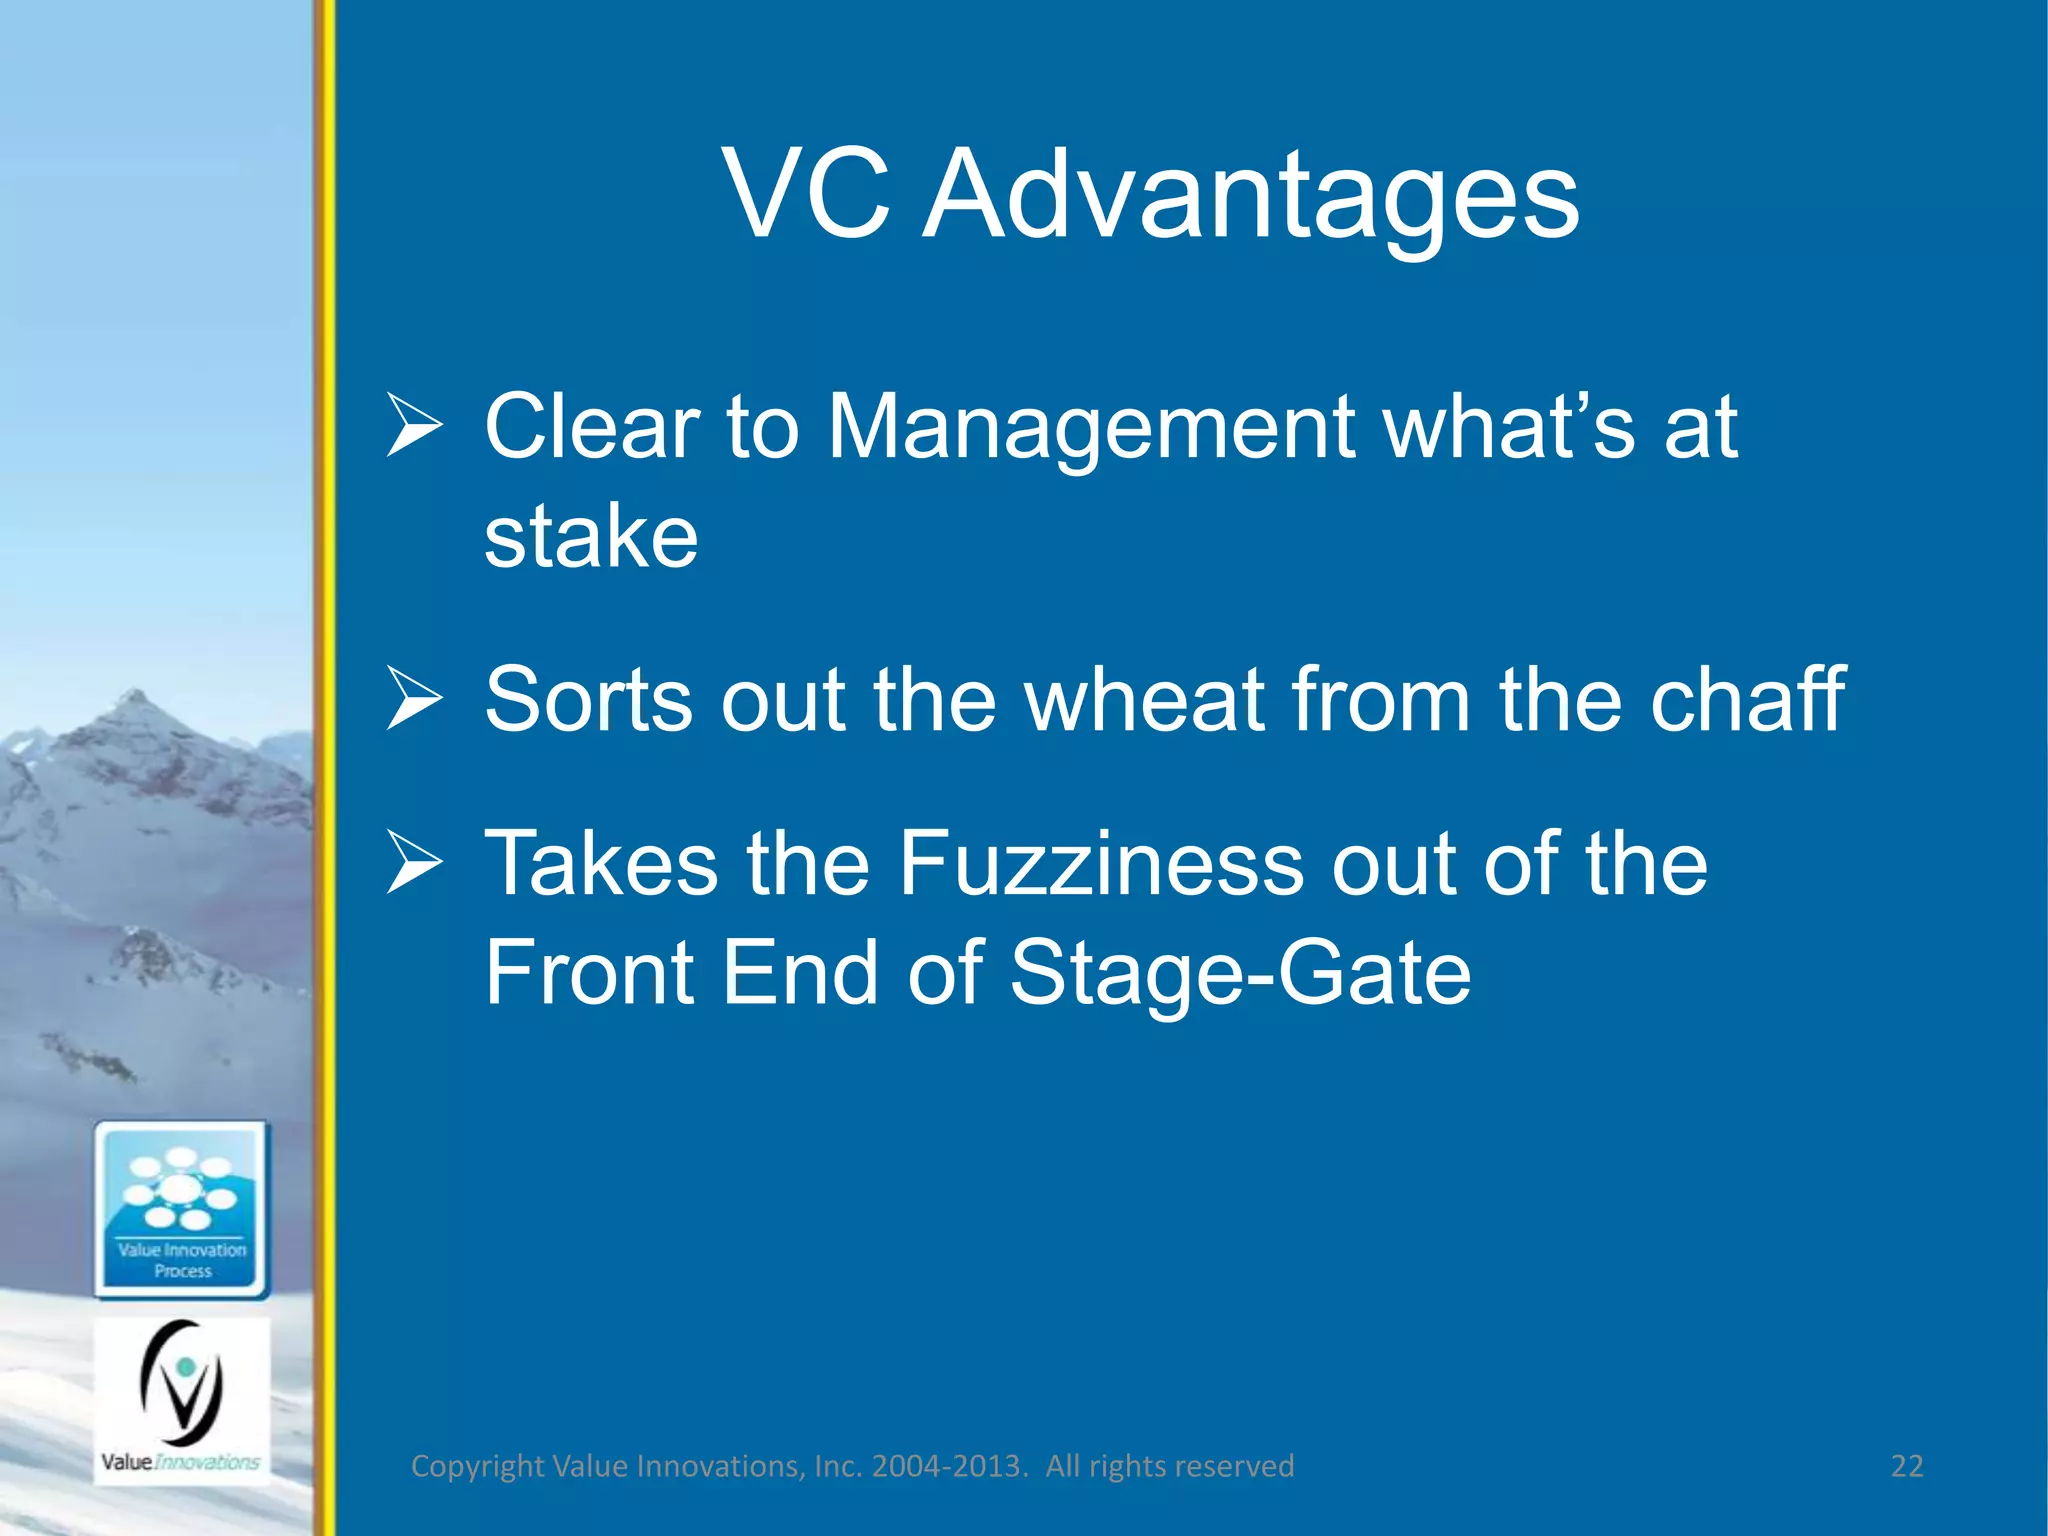
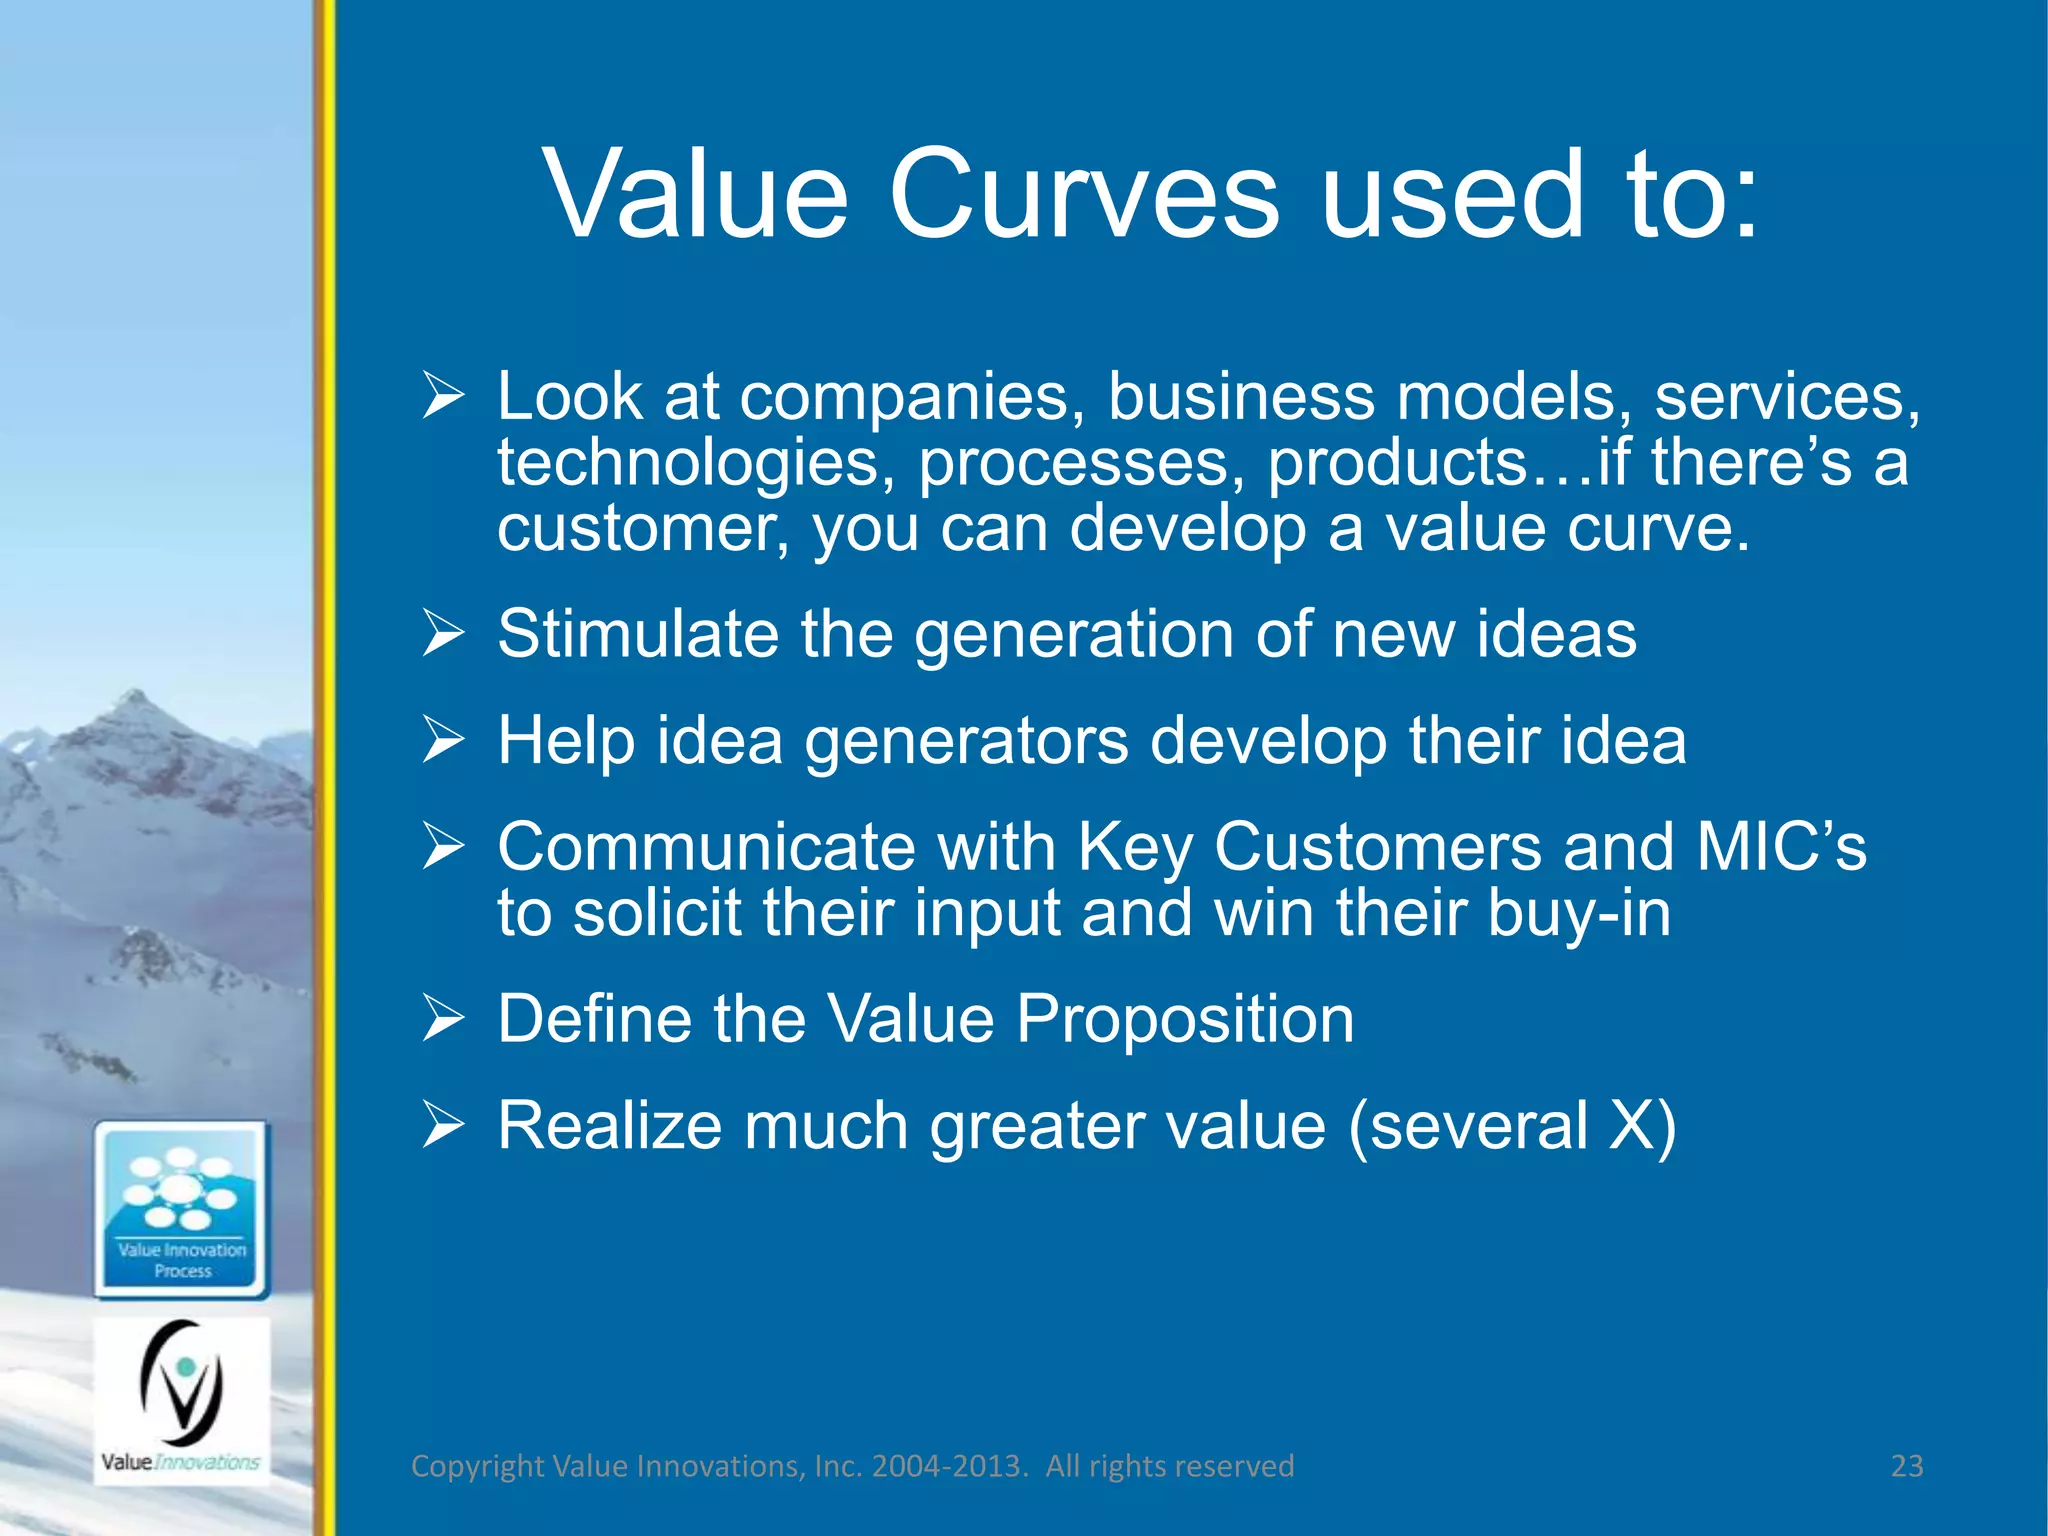
Value Curves with Metrics 
Low High 
Perform ance (Nested Value Curve) 
Driveability (Nested Value Curve) 
Design 
Consum er Survey 
Quality (Nested Value Curve) 
Consum er Reports Ranking 
Operating Cost (except fuel) 
cost/m ile 
Reliability 
Consum er Reports 
Maintenance Schedule 
# /year 
Maintenance Cost 
Average cost ($/event) 
Range/tank (Range/charge) 
m iles/tank; m iles/charge 
Supercharging stations 
# of statiions, Distance between stations, m iles 
Brand Recognition 
Consum er Survey 
Sustainability 
Consum er Survey, C Footprint 
Life expectancy 
K Miles 
Purchase Price 
$K 
Leasing Options 
Yes/No 
1.0 3.0 5.0 7.0 9.0 
Tesla S Sedan Value Curve 
1st Draft Value to Consum er 
1 
2 
3 
4 
5 
6 
7 
8 
9 
10 
11 
12 
13 
14 
15 
8 
4 
600E 
500 
na 
8 
4 
250 
90 
Yes 
8.5 
99 
1 
200E 
275 
200 
7 
8 
1000 
90 
Yes 
BMW 7 Series Tesla S
Value Curve Genesis 
 First used by Accor in 1985 
 Kim, W.C. and Mauborgne, R. 
Value Innovation: The Strategic 
Logic of High Growth. HBR Jan- 
Feb, 1997. p. 103-112. Reprint 
#97108 
 Half million reprints 
 “House of Quality”? 
Copyright Value Innovations, Inc. 2004-2013. All rights reserved 2
Value Curves 
Are actionable 
As a result project goals are: 
 Quantified and 
 Very Clear 
Copyright Value Innovations, Inc. 2004-2013. All rights reserved 3
Value Curve with Metrics 
for the Tesla S 
Most Important Customer: The 
Consumer 
Copyright Value Innovations, Inc. 2004-2013. All rights reserved 4
Our first Value Curve 
Let’s take a look at it, then 
We’ll break it down & explain it 
Copyright Value Innovations, Inc. 2004-2013. All rights reserved 5
Copyright Value Innovations, Inc6. 2004-2013. All rights reserved 
Low High 
Perform ance (Nested Value Curve) 
Driveability (Nested Value Curve) 
Design 
Consum er Survey 
Quality (Nested Value Curve) 
Consum er Reports Ranking 
Operating Cost (except fuel) 
cost/m ile 
Reliability 
Consum er Reports 
Maintenance Schedule 
# /year 
Maintenance Cost 
Average cost ($/event) 
Range/tank (Range/charge) 
m iles/tank; m iles/charge 
Supercharging stations 
# of statiions, Distance between stations, m iles 
Brand Recognition 
Consum er Survey 
Sustainability 
Consum er Survey, C Footprint 
Life expectancy 
K Miles 
Purchase Price 
$K 
Leasing Options 
Yes/No 
1.0 3.0 5.0 7.0 9.0 
Tesla S Sedan Value Curve 
1st Draft Value to Consum er 
1 
2 
3 
4 
5 
6 
7 
8 
9 
10 
11 
12 
13 
14 
15 
8 
4 
600E 
500 
na 
8 
4 
250 
90 
Yes 
8.5 
99 
1 
200E 
275 
200 
7 
8 
1000 
90 
Yes 
BMW 7 Series Tesla S
On the left side: 
Copyright Value Innovations, Inc7. 2004-2013. All rights reserved 
Low High 
Perform ance (Nested Value Curve) 
Driveability (Nested Value Curve) 
Design 
Consum er Survey 
Quality (Nested Value Curve) 
Consum er Reports Ranking 
Operating Cost (except fuel) 
cost/m ile 
Reliability 
Consum er Reports 
Maintenance Schedule 
# /year 
Maintenance Cost 
Average cost ($/event) 
Range/tank (Range/charge) 
m iles/tank; m iles/charge 
Supercharging stations 
# of statiions, Distance between stations, m iles 
Brand Recognition 
Consum er Survey 
Sustainability 
Consum er Survey, C Footprint 
Life expectancy 
K Miles 
Purchase Price 
$K 
Leasing Options 
Yes/No 
1.0 3.0 5.0 7.0 9.0 
Tesla S Sedan Value Curve 
1st Draft Value to Consum er 
1 
2 
3 
4 
5 
6 
7 
8 
9 
10 
11 
12 
13 
14 
15 
8 
4 
600E 
500 
na 
8 
4 
250 
90 
Yes 
8.5 
99 
1 
200E 
275 
200 
7 
8 
1000 
90 
Yes 
BMW 7 Series Tesla S 
 The Elements of 
Performance (define 
the product, service 
or offering) 
 Elements are listed in 
rank order
Left Hand Side 
Let’s look at: 
1. What we mean by Elements of 
Performance and then 
2. Rank Ordering 
Copyright Value Innovations, Inc. 2004-2013. All rights reserved 8
Element of Performance 
Capability or characteristic of the 
product or service that it is important 
to the Most Important Customer that 
can be performed/observed in a 
measurable way. 
Steve Schacher, Chevron EPMO 
Copyright Value Innovations, Inc. 2004-2013. All rights reserved 9
Element of Performance 
In aggregate the Elements define the 
service or product. An Element is: 
 A succinct statement 
 Not an objective 
 Not a feature or benefit 
 Measurable 
Copyright Value Innovations, Inc. 2004-2013. All rights reserved 10
Element of Performance 
Consider: 
 Stella Artois developing a new beer 
Objective 
Feature/Benefit 
Element of Performance 
Improve taste 
Tastes great 
Taste 
Copyright Value Innovations, Inc. 2004-2013. All rights reserved 11
Elements of Performance 
Limit to 15 
 Use Nested Value Curves to achieve 
this limit 
 Examples of Nested Value Curves 
 Performance 
 Drivability 
Copyright Value Innovations, Inc. 2004-2013. All rights reserved 12
Rank Ordering Tools 
Tool Description Time to 
complete 
You rank 
(Delphi) 
5 to 10 min. 
Pairwise 
Comparison 
(PWC) 
Which is the more 
important of the 2 
Elements? 
20-40 min. 
Analytical 
Hierarchy 
Process 
(AHP) 
What is the relative 
importance of the 2 
Elements? 
1 to 2h. 
Copyright Value Innovations, Inc. 2004-2013. All rights reserved 13
Copyright Value Innovations, In1c4. 2004-2013. All rights reserved 
Low High 
Perform ance (Nested Value Curve) 
Driveability (Nested Value Curve) 
Design 
Consum er Survey 
Quality (Nested Value Curve) 
Consum er Reports Ranking 
Operating Cost (except fuel) 
cost/m ile 
Reliability 
Consum er Reports 
Maintenance Schedule 
# /year 
Maintenance Cost 
Average cost ($/event) 
Range/tank (Range/charge) 
m iles/tank; m iles/charge 
Supercharging stations 
# of statiions, Distance between stations, m iles 
Brand Recognition 
Consum er Survey 
Sustainability 
Consum er Survey, C Footprint 
Life expectancy 
K Miles 
Purchase Price 
$K 
Leasing Options 
Yes/No 
1.0 3.0 5.0 7.0 9.0 
Tesla S Sedan Value Curve 
1st Draft Value to Consum er 
1 
2 
3 
4 
5 
6 
7 
8 
9 
10 
11 
12 
13 
14 
15 
8 
4 
600E 
500 
na 
8 
4 
250 
90 
Yes 
8.5 
99 
1 
200E 
275 
200 
7 
8 
1000 
90 
Yes 
BMW 7 Series Tesla S 
On the right hand: 
 The values to the 
Most Important 
Customer for each 
Element (low value on 
left; high value on right) 
 Metrics for each 
Element allow you to 
define absolute 
values
Right Hand Side 
Let’s look at: 
1. Value delivered – you determine 
the value range 
2. Metrics – You define initially, Most 
Important Customers will critique 
in Steps 6-7 
Copyright Value Innovations, Inc. 2004-2013. All rights reserved 15
Nested Value Curves 
 Help you to keep # of Elements to 15 
or less 
 Allow you to drill into Elements like 
Quality, Ease of Use 
Copyright Value Innovations, Inc. 2004-2013. All rights reserved 16
Nested Value Curve - Drivability 
1st Draft Value to the Consum er 
17 
Low High 
Acceleration 
0- 60m ph, seconds 
Braking distance 
60- 0m ph, feet 
Safety 
Crash Testing, Exceeds NHTSA standards; Yes/No 
Top Speed 
m ph 
1.0 3.0 5.0 7.0 9.0 
1 
2 
3 
4 
Nested Value Curve - Performance 
Value 1st Draft to the Consum er 
4.7 4 
BMW 7 Series Tesla S 
Low High 
Road Handling 
Custom er Survey, Consum er Report 
Stability 
Custom er Survey, Consum er Report 
Cornering 
Custom er Survey, Consum er Report 
1.0 3.0 5.0 7.0 9.0 
1 
2 
3 
BMW 7 Series Tesla S 
Copyright Value Innovations, Inc. 2004-2013. All rights reserved
Is Tesla swimming in a Blue Ocean with 
the S Sedan? 
Copyright Value Innovations, In1c8. 2004-2013. All rights reserved 
Low High 
Perform ance (Nested Value Curve) 
Driveability (Nested Value Curve) 
Design 
Consum er Survey 
Quality (Nested Value Curve) 
Consum er Reports Ranking 
Operating Cost (except fuel) 
cost/m ile 
Reliability 
Consum er Reports 
Maintenance Schedule 
# /year 
Maintenance Cost 
Average cost ($/event) 
Range/tank (Range/charge) 
m iles/tank; m iles/charge 
Supercharging stations 
# of statiions, Distance between stations, m iles 
Brand Recognition 
Consum er Survey 
Sustainability 
Consum er Survey, C Footprint 
Life expectancy 
K Miles 
Purchase Price 
$K 
Leasing Options 
Yes/No 
1.0 3.0 5.0 7.0 9.0 
Tesla S Sedan Value Curve 
1st Draft Value to Consum er 
1 
2 
3 
4 
5 
6 
7 
8 
9 
10 
11 
12 
13 
14 
15 
8 
4 
600E 
500 
na 
8 
4 
250 
90 
Yes 
8.5 
99 
1 
200E 
275 
200 
7 
8 
1000 
90 
Yes 
BMW 7 Series Tesla S
Critique of the Value Curves 
occurs in Steps 6-7 
 Elements are vetted by the MIC 
 Elements are rank ordered by the 
MIC 
 Metrics are defined for each 
Element 
 MIC’s vett the metrics 
Copyright Value Innovations, Inc. 2004-2013. All rights reserved 19
Comparison with Strategy 
Canvases 
Elements 
 Are not rank ordered 
 Do not have metrics 
 Are not vetted by the MIC 
Copyright Value Innovations, Inc. 2004-2013. All rights reserved 20
VC Advantages 
 Allows a project team to establish 
clear project goals based on MIC 
input (rank ordering and metrics 
enable this!) 
 Engages your MIC’s in the process 
 Easy to communicate project goals 
Copyright Value Innovations, Inc. 2004-2013. All rights reserved 21
VC Advantages 
 Clear to Management what’s at 
stake 
 Sorts out the wheat from the chaff 
 Takes the Fuzziness out of the 
Front End of Stage-Gate 
Copyright Value Innovations, Inc. 2004-2013. All rights reserved 22
Value Curves used to: 
 Look at companies, business models, services, 
technologies, processes, products…if there’s a 
customer, you can develop a value curve. 
 Stimulate the generation of new ideas 
 Help idea generators develop their idea 
 Communicate with Key Customers and MIC’s 
to solicit their input and win their buy-in 
 Define the Value Proposition 
 Realize much greater value (several X) 
Copyright Value Innovations, Inc. 2004-2013. All rights reserved 23
Value Curves featured in: 
VIP 
Step # 
Value 
Curve 
Description 
3 “As Is” Your current offering, or, a 
competitor’s offering, if you are 
not in the space 
3 “Closest 
Competitor” 
or 
“Best in 
Class” 
One product or service; or the 
best value delivered by a product 
or service for that Element (e.g., 
Toyota Camry, Honda Accord, 
Hyundai Sonata) 
5 “To Be” Shows the Value you plan to 
deliver for each Element (Defines 
the “What”) 
Copyright Value Innovations, Inc. 2004-2013. All rights reserved 24
© Value Innovations, Inc., 2004-2013. All rights reserved. 
Copyright Value Innovations, Inc. 2004-2013. All rights reserved 25

Value curve with_metrics_190914

  • 1.
    Value Curves withMetrics Low High Perform ance (Nested Value Curve) Driveability (Nested Value Curve) Design Consum er Survey Quality (Nested Value Curve) Consum er Reports Ranking Operating Cost (except fuel) cost/m ile Reliability Consum er Reports Maintenance Schedule # /year Maintenance Cost Average cost ($/event) Range/tank (Range/charge) m iles/tank; m iles/charge Supercharging stations # of statiions, Distance between stations, m iles Brand Recognition Consum er Survey Sustainability Consum er Survey, C Footprint Life expectancy K Miles Purchase Price $K Leasing Options Yes/No 1.0 3.0 5.0 7.0 9.0 Tesla S Sedan Value Curve 1st Draft Value to Consum er 1 2 3 4 5 6 7 8 9 10 11 12 13 14 15 8 4 600E 500 na 8 4 250 90 Yes 8.5 99 1 200E 275 200 7 8 1000 90 Yes BMW 7 Series Tesla S
  • 2.
    Value Curve Genesis  First used by Accor in 1985  Kim, W.C. and Mauborgne, R. Value Innovation: The Strategic Logic of High Growth. HBR Jan- Feb, 1997. p. 103-112. Reprint #97108  Half million reprints  “House of Quality”? Copyright Value Innovations, Inc. 2004-2013. All rights reserved 2
  • 3.
    Value Curves Areactionable As a result project goals are:  Quantified and  Very Clear Copyright Value Innovations, Inc. 2004-2013. All rights reserved 3
  • 4.
    Value Curve withMetrics for the Tesla S Most Important Customer: The Consumer Copyright Value Innovations, Inc. 2004-2013. All rights reserved 4
  • 5.
    Our first ValueCurve Let’s take a look at it, then We’ll break it down & explain it Copyright Value Innovations, Inc. 2004-2013. All rights reserved 5
  • 6.
    Copyright Value Innovations,Inc6. 2004-2013. All rights reserved Low High Perform ance (Nested Value Curve) Driveability (Nested Value Curve) Design Consum er Survey Quality (Nested Value Curve) Consum er Reports Ranking Operating Cost (except fuel) cost/m ile Reliability Consum er Reports Maintenance Schedule # /year Maintenance Cost Average cost ($/event) Range/tank (Range/charge) m iles/tank; m iles/charge Supercharging stations # of statiions, Distance between stations, m iles Brand Recognition Consum er Survey Sustainability Consum er Survey, C Footprint Life expectancy K Miles Purchase Price $K Leasing Options Yes/No 1.0 3.0 5.0 7.0 9.0 Tesla S Sedan Value Curve 1st Draft Value to Consum er 1 2 3 4 5 6 7 8 9 10 11 12 13 14 15 8 4 600E 500 na 8 4 250 90 Yes 8.5 99 1 200E 275 200 7 8 1000 90 Yes BMW 7 Series Tesla S
  • 7.
    On the leftside: Copyright Value Innovations, Inc7. 2004-2013. All rights reserved Low High Perform ance (Nested Value Curve) Driveability (Nested Value Curve) Design Consum er Survey Quality (Nested Value Curve) Consum er Reports Ranking Operating Cost (except fuel) cost/m ile Reliability Consum er Reports Maintenance Schedule # /year Maintenance Cost Average cost ($/event) Range/tank (Range/charge) m iles/tank; m iles/charge Supercharging stations # of statiions, Distance between stations, m iles Brand Recognition Consum er Survey Sustainability Consum er Survey, C Footprint Life expectancy K Miles Purchase Price $K Leasing Options Yes/No 1.0 3.0 5.0 7.0 9.0 Tesla S Sedan Value Curve 1st Draft Value to Consum er 1 2 3 4 5 6 7 8 9 10 11 12 13 14 15 8 4 600E 500 na 8 4 250 90 Yes 8.5 99 1 200E 275 200 7 8 1000 90 Yes BMW 7 Series Tesla S  The Elements of Performance (define the product, service or offering)  Elements are listed in rank order
  • 8.
    Left Hand Side Let’s look at: 1. What we mean by Elements of Performance and then 2. Rank Ordering Copyright Value Innovations, Inc. 2004-2013. All rights reserved 8
  • 9.
    Element of Performance Capability or characteristic of the product or service that it is important to the Most Important Customer that can be performed/observed in a measurable way. Steve Schacher, Chevron EPMO Copyright Value Innovations, Inc. 2004-2013. All rights reserved 9
  • 10.
    Element of Performance In aggregate the Elements define the service or product. An Element is:  A succinct statement  Not an objective  Not a feature or benefit  Measurable Copyright Value Innovations, Inc. 2004-2013. All rights reserved 10
  • 11.
    Element of Performance Consider:  Stella Artois developing a new beer Objective Feature/Benefit Element of Performance Improve taste Tastes great Taste Copyright Value Innovations, Inc. 2004-2013. All rights reserved 11
  • 12.
    Elements of Performance Limit to 15  Use Nested Value Curves to achieve this limit  Examples of Nested Value Curves  Performance  Drivability Copyright Value Innovations, Inc. 2004-2013. All rights reserved 12
  • 13.
    Rank Ordering Tools Tool Description Time to complete You rank (Delphi) 5 to 10 min. Pairwise Comparison (PWC) Which is the more important of the 2 Elements? 20-40 min. Analytical Hierarchy Process (AHP) What is the relative importance of the 2 Elements? 1 to 2h. Copyright Value Innovations, Inc. 2004-2013. All rights reserved 13
  • 14.
    Copyright Value Innovations,In1c4. 2004-2013. All rights reserved Low High Perform ance (Nested Value Curve) Driveability (Nested Value Curve) Design Consum er Survey Quality (Nested Value Curve) Consum er Reports Ranking Operating Cost (except fuel) cost/m ile Reliability Consum er Reports Maintenance Schedule # /year Maintenance Cost Average cost ($/event) Range/tank (Range/charge) m iles/tank; m iles/charge Supercharging stations # of statiions, Distance between stations, m iles Brand Recognition Consum er Survey Sustainability Consum er Survey, C Footprint Life expectancy K Miles Purchase Price $K Leasing Options Yes/No 1.0 3.0 5.0 7.0 9.0 Tesla S Sedan Value Curve 1st Draft Value to Consum er 1 2 3 4 5 6 7 8 9 10 11 12 13 14 15 8 4 600E 500 na 8 4 250 90 Yes 8.5 99 1 200E 275 200 7 8 1000 90 Yes BMW 7 Series Tesla S On the right hand:  The values to the Most Important Customer for each Element (low value on left; high value on right)  Metrics for each Element allow you to define absolute values
  • 15.
    Right Hand Side Let’s look at: 1. Value delivered – you determine the value range 2. Metrics – You define initially, Most Important Customers will critique in Steps 6-7 Copyright Value Innovations, Inc. 2004-2013. All rights reserved 15
  • 16.
    Nested Value Curves  Help you to keep # of Elements to 15 or less  Allow you to drill into Elements like Quality, Ease of Use Copyright Value Innovations, Inc. 2004-2013. All rights reserved 16
  • 17.
    Nested Value Curve- Drivability 1st Draft Value to the Consum er 17 Low High Acceleration 0- 60m ph, seconds Braking distance 60- 0m ph, feet Safety Crash Testing, Exceeds NHTSA standards; Yes/No Top Speed m ph 1.0 3.0 5.0 7.0 9.0 1 2 3 4 Nested Value Curve - Performance Value 1st Draft to the Consum er 4.7 4 BMW 7 Series Tesla S Low High Road Handling Custom er Survey, Consum er Report Stability Custom er Survey, Consum er Report Cornering Custom er Survey, Consum er Report 1.0 3.0 5.0 7.0 9.0 1 2 3 BMW 7 Series Tesla S Copyright Value Innovations, Inc. 2004-2013. All rights reserved
  • 18.
    Is Tesla swimmingin a Blue Ocean with the S Sedan? Copyright Value Innovations, In1c8. 2004-2013. All rights reserved Low High Perform ance (Nested Value Curve) Driveability (Nested Value Curve) Design Consum er Survey Quality (Nested Value Curve) Consum er Reports Ranking Operating Cost (except fuel) cost/m ile Reliability Consum er Reports Maintenance Schedule # /year Maintenance Cost Average cost ($/event) Range/tank (Range/charge) m iles/tank; m iles/charge Supercharging stations # of statiions, Distance between stations, m iles Brand Recognition Consum er Survey Sustainability Consum er Survey, C Footprint Life expectancy K Miles Purchase Price $K Leasing Options Yes/No 1.0 3.0 5.0 7.0 9.0 Tesla S Sedan Value Curve 1st Draft Value to Consum er 1 2 3 4 5 6 7 8 9 10 11 12 13 14 15 8 4 600E 500 na 8 4 250 90 Yes 8.5 99 1 200E 275 200 7 8 1000 90 Yes BMW 7 Series Tesla S
  • 19.
    Critique of theValue Curves occurs in Steps 6-7  Elements are vetted by the MIC  Elements are rank ordered by the MIC  Metrics are defined for each Element  MIC’s vett the metrics Copyright Value Innovations, Inc. 2004-2013. All rights reserved 19
  • 20.
    Comparison with Strategy Canvases Elements  Are not rank ordered  Do not have metrics  Are not vetted by the MIC Copyright Value Innovations, Inc. 2004-2013. All rights reserved 20
  • 21.
    VC Advantages Allows a project team to establish clear project goals based on MIC input (rank ordering and metrics enable this!)  Engages your MIC’s in the process  Easy to communicate project goals Copyright Value Innovations, Inc. 2004-2013. All rights reserved 21
  • 22.
    VC Advantages Clear to Management what’s at stake  Sorts out the wheat from the chaff  Takes the Fuzziness out of the Front End of Stage-Gate Copyright Value Innovations, Inc. 2004-2013. All rights reserved 22
  • 23.
    Value Curves usedto:  Look at companies, business models, services, technologies, processes, products…if there’s a customer, you can develop a value curve.  Stimulate the generation of new ideas  Help idea generators develop their idea  Communicate with Key Customers and MIC’s to solicit their input and win their buy-in  Define the Value Proposition  Realize much greater value (several X) Copyright Value Innovations, Inc. 2004-2013. All rights reserved 23
  • 24.
    Value Curves featuredin: VIP Step # Value Curve Description 3 “As Is” Your current offering, or, a competitor’s offering, if you are not in the space 3 “Closest Competitor” or “Best in Class” One product or service; or the best value delivered by a product or service for that Element (e.g., Toyota Camry, Honda Accord, Hyundai Sonata) 5 “To Be” Shows the Value you plan to deliver for each Element (Defines the “What”) Copyright Value Innovations, Inc. 2004-2013. All rights reserved 24
  • 25.
    © Value Innovations,Inc., 2004-2013. All rights reserved. Copyright Value Innovations, Inc. 2004-2013. All rights reserved 25