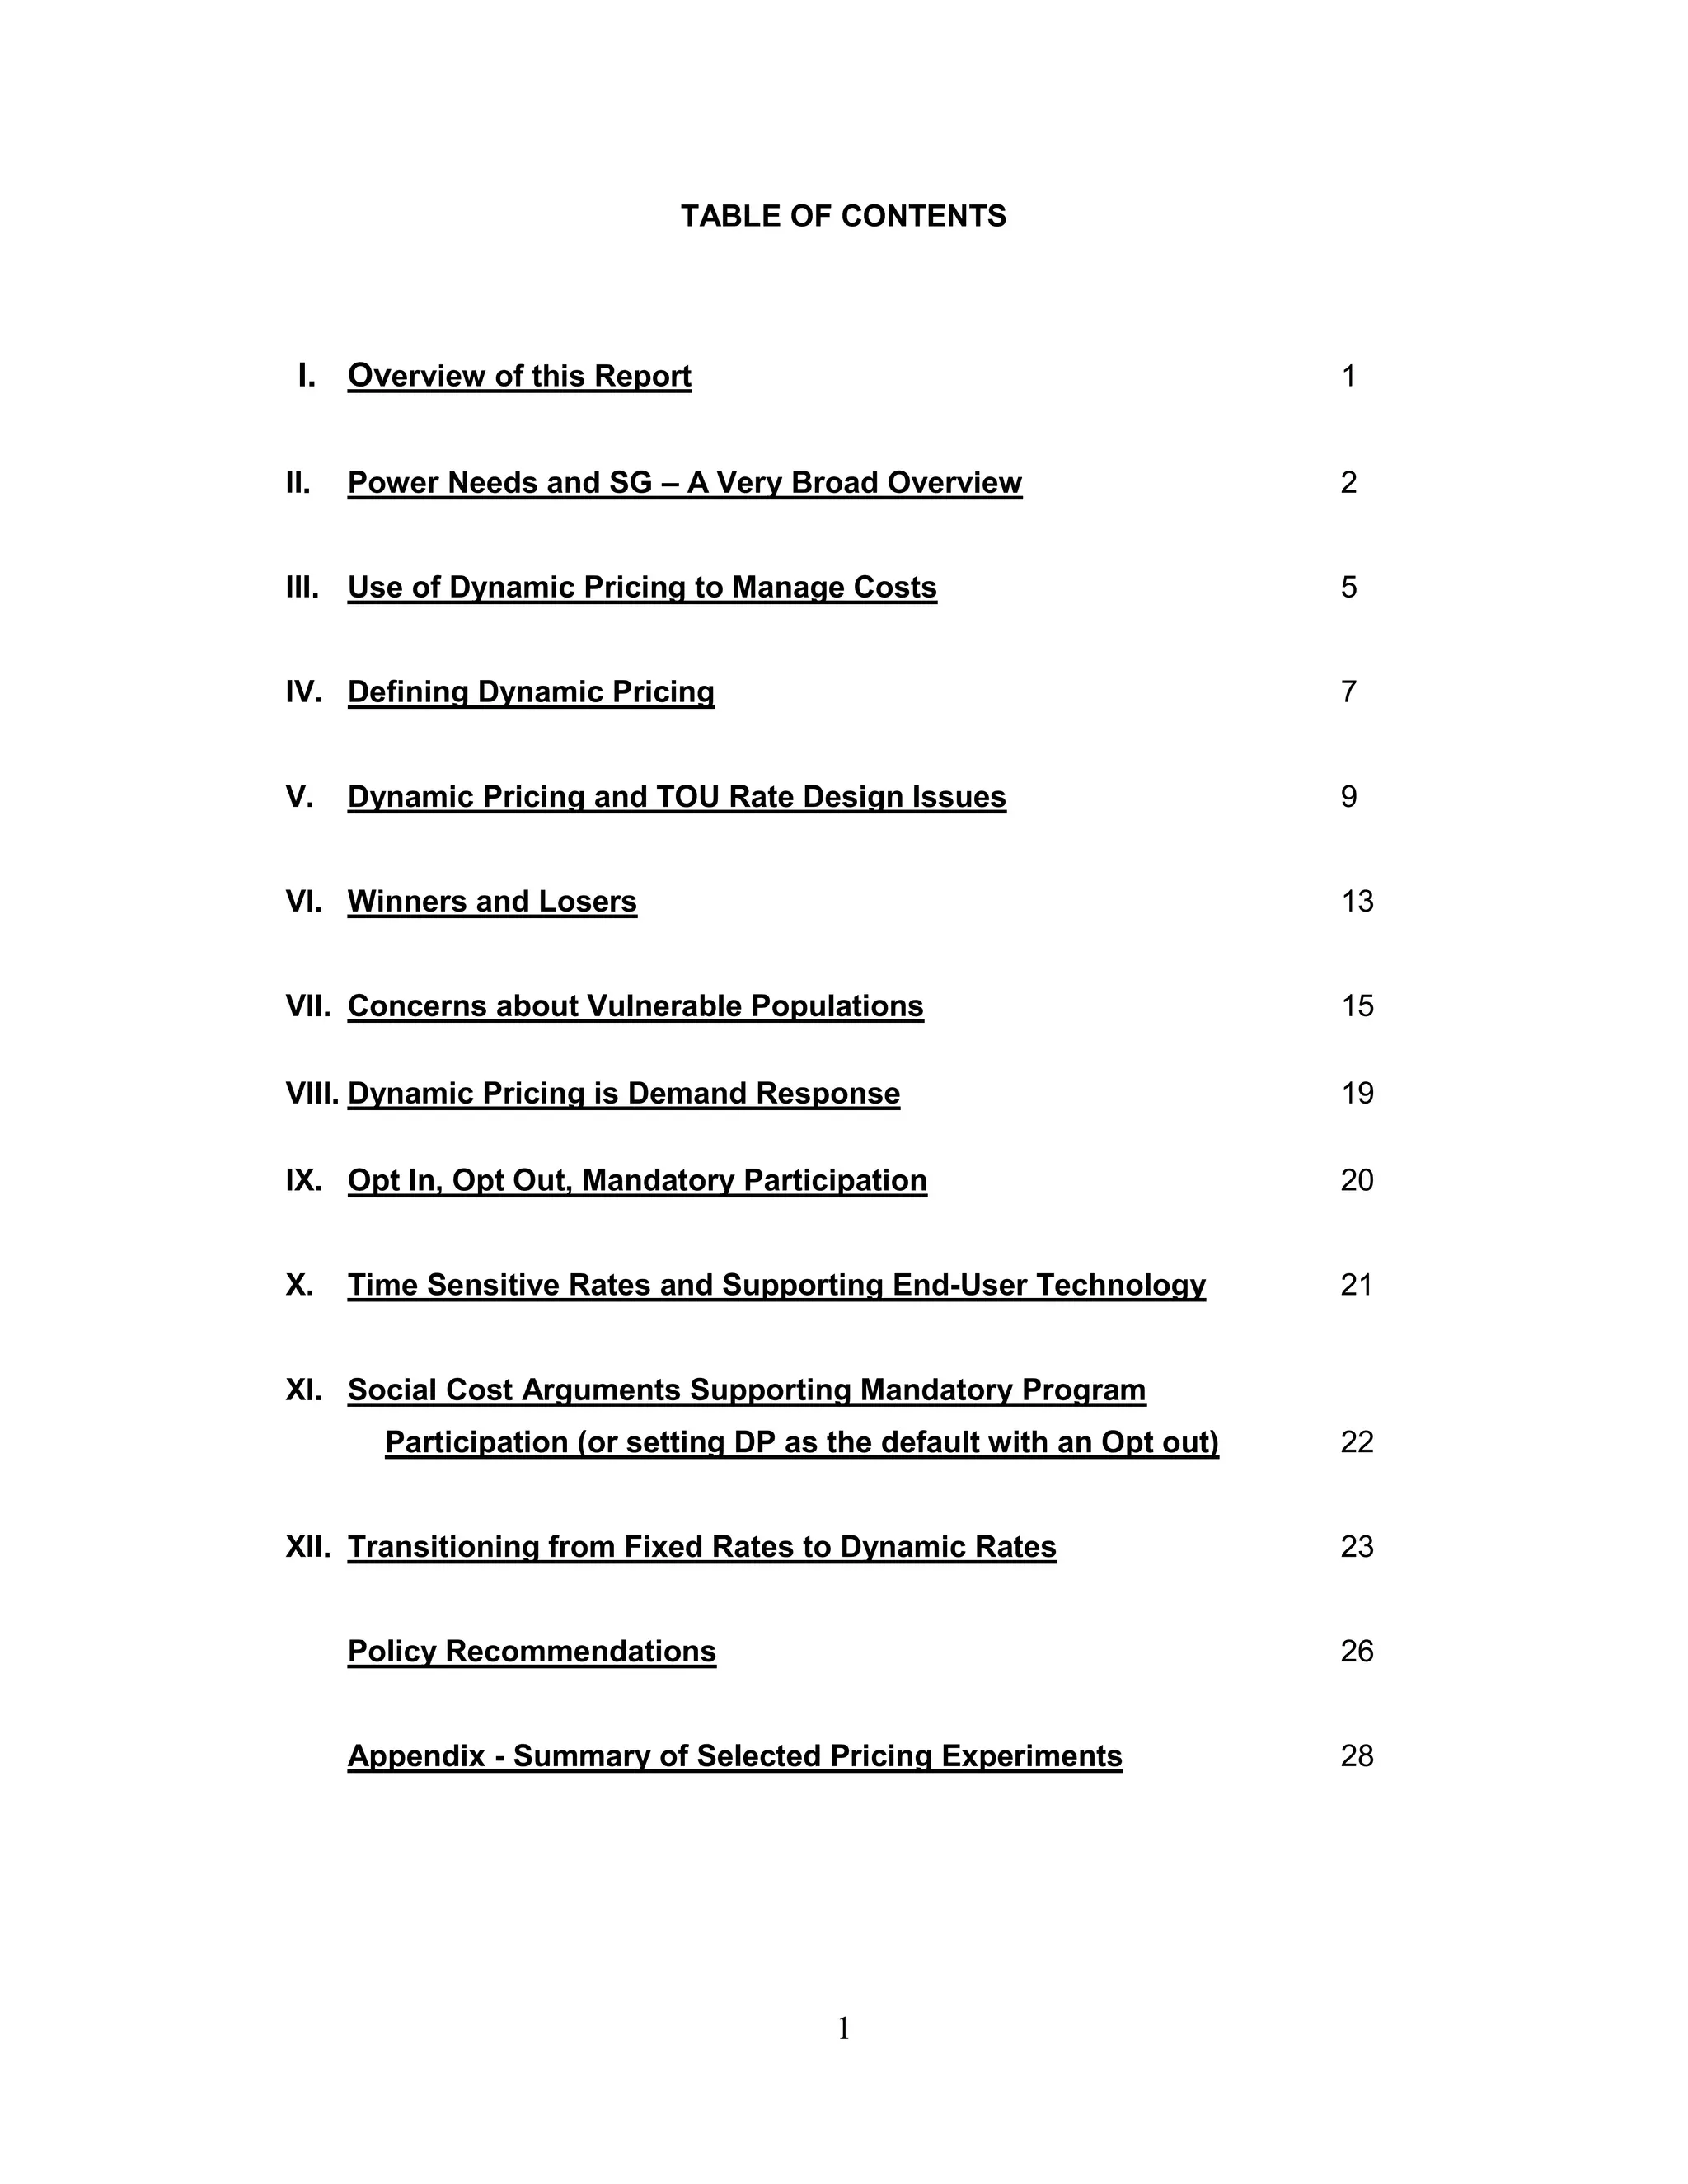
This document provides an overview of using time-differentiated electricity rates to control power system costs from a national perspective. It discusses how electricity pricing has resulted in consumption patterns that do not match production and delivery cost patterns, leading to increasing costs. Dynamic pricing is presented as a way to better align prices with underlying costs. The document covers definitions of dynamic pricing, related rate design issues, potential impacts on different customer groups, enabling technology needs, and transition challenges. It argues dynamic pricing could significantly reduce peak consumption and lower future electricity costs if designed and implemented properly while accounting for different stakeholder impacts.
![been forming around an integrated approach combining peak capacity expansion
with ways to manage peak demand that enhance customer‟s ability to better
control their electric consumption.3 DP is seen as an important piece of the
overall approach to peak demand management, and one element to help bridge
this peak demand – peak supply imbalance and also help manage overall power
supply costs.4
DP does not require that the utility invest in an expensive AMI system. Getting
price signals to customers with no AMI is fairly easy. In Illinois, part of the
answer is the belief that for the vast majority of customers, it is counter-
productive to send them prices every hour. Rather, their approach is to post
hourly prices on a web-site, educate customers about the general price pattern,
and only send them alerts when prices are going to be exceptionally high5.
Turning to other elements of SG, a short article by Pike Research issued in
December 2009, argued that smart meters, while the most visible part of SG,
aren‟t where the real benefits exist. They argue that grid infrastructure projects
(transmission upgrades, substation automation, and distribution automation) will
likely find the best return on investment.6
They further predict that grid automation (i.e., the actions noted in the prior
paragraph) will capture 84 percent of global SG investment through 2015,
compared to just 14 percent for AMI, and 2 percent for electric vehicle (EV)
management systems.”7 According to their research, “…revenues [from the sale
of SG equipment] will peak in 2013 after several years of a strong push by key
3
Ibid.
4
It should be noted that AMI isn‟t necessary for DP. If AMI has been installed, and is operational, then it
is relatively easy to implement DP. DP can still be implemented in the absence of AMI. Doing so does
require targeted meter exchanges. For example, the RTP program in Illinois does not rely on AMI.
ComEd uses interval meters read once per month and Ameren uses a one-way Automated Meter Reading
(AMR) for some customers. Implementing meter data management systems may however be as important
as the technology choices for the meters themselves.
5
When there is one or more hours the following day over a certain threshold (currently $0.13/kWh, energy
only, but this may be lowered to $0.10/kWh), customers are notified automatically via email and telephone
calls.
6
“Smart Grid Investment to Total $200 Billion Worldwide by 2015,” Pike Research, See:
http://www.pikeresearch.com/newsroom/smart-grid-investment-to-total-200-billion-worldwide-by-2015
7
Pike Research.
3](https://image.slidesharecdn.com/anationalperspectiveonusingratestocontrolpowersystemcostsrecommendationsversion-compatable5-24-11-111013130440-phpapp01/75/A-national-perspective-on-using-rates-to-control-power-system-costs-recommendations-version-compatable-5-24-11-5-2048.jpg)
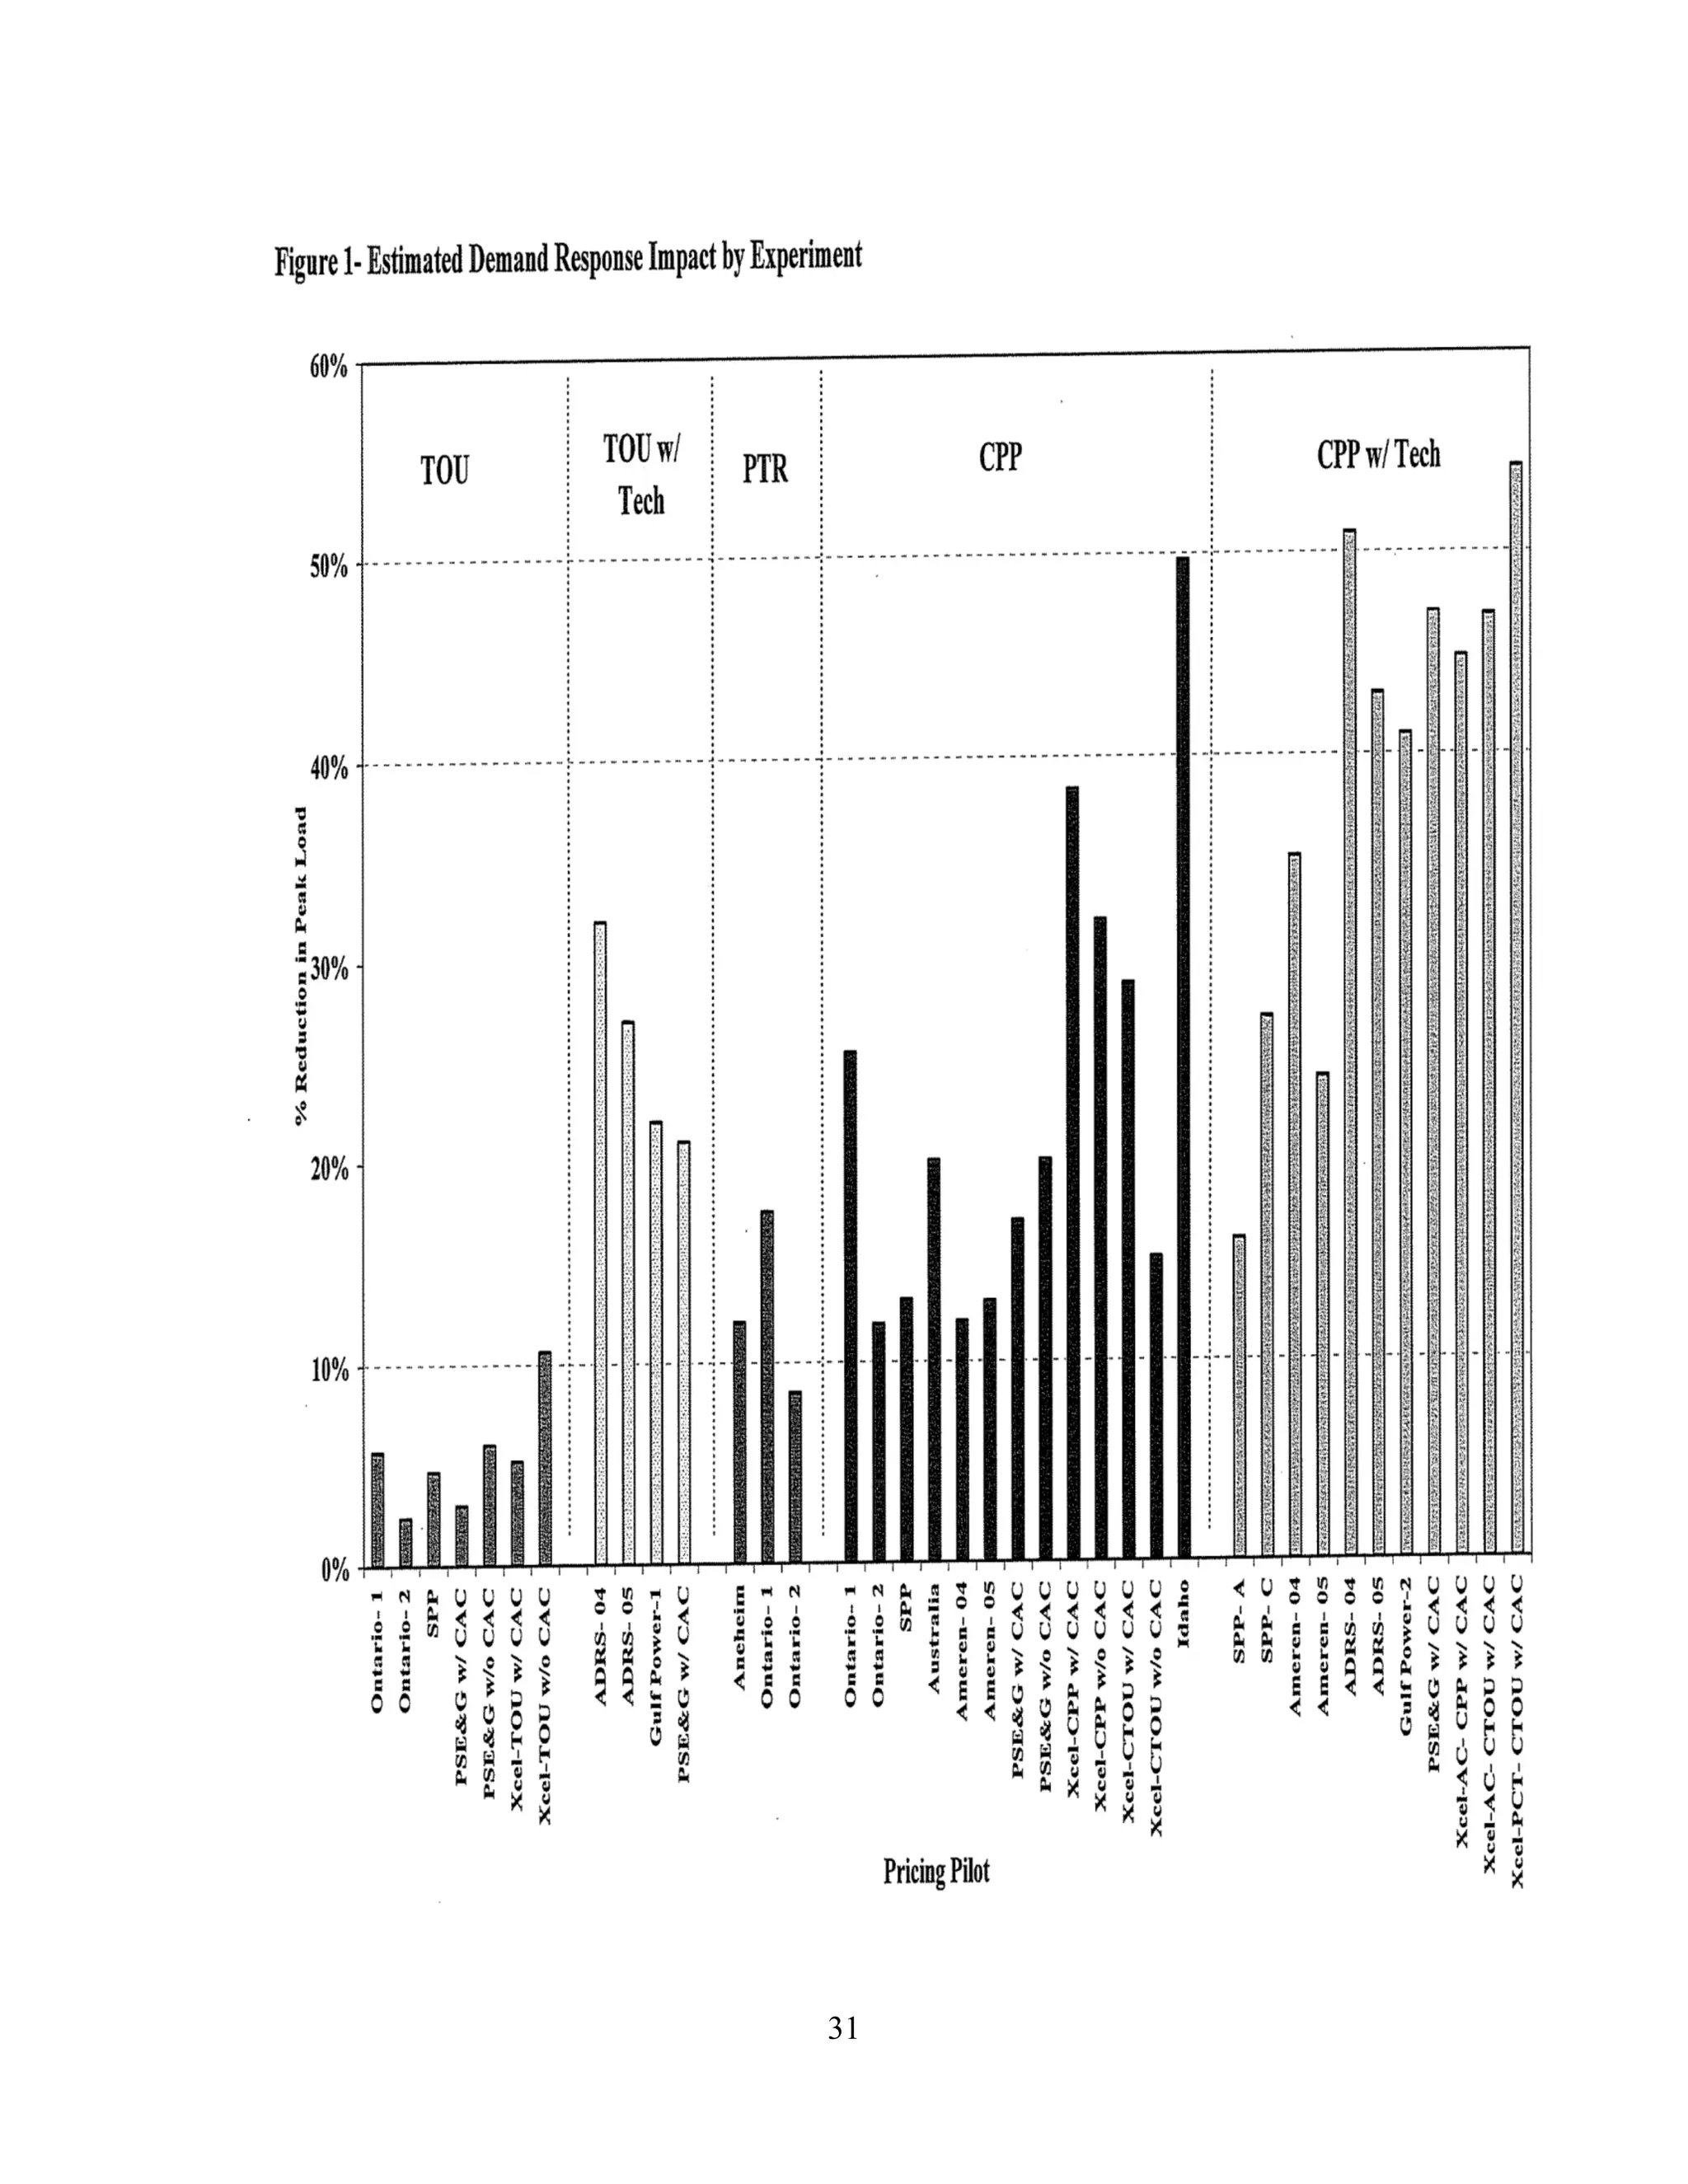
![Next was RTP. Then, three different forms of CPP each produced even higher
overall cost savings.12 This is consistent with results from other studies
summarized in the appendix to this report.
III. Use of Dynamic Pricing to Manage Costs
Taking a step back and looking more broadly at the use of DP, we see that it‟s
been with us since the beginning of economic exchange, be that barter exchange
or market-based trade. One writer notes that "Dynamic pricing has always been
with us…the classic hagglers in the market of a Middle East bazaar [is one
example]. People will pay very different prices for the same bolt of fabric. This is
more the norm in transactions than fixed pricing. Fixed pricing is a much later
phenomenon and it's an artificial one.”13 It‟s only been since the Industrial
Revolution that DP was replaced by standardized pricing schemes. DP has
come back into favor in various industries over the last 20 – 30 years.
Some applications of DP are e-commerce, eBay being one example. It‟s also
been reported that IBM uses it to establish prices for some of its computers.14
Auto and home purchases are two additional examples where timing affects
prices (as we will see, prices that vary by time are not necessarily dynamic).
Another place where more standardized pricing has been replaced by DP is the
airline industry.15 The authors note that airlines previously used what they refer
to as “…an allocation based fare-class model” and business success was
measured by load factor - the number of passengers per available seat on a
single leg trip.16 They argue that “The primary driving reason behind the
utilization of a variable pricing policy is capacity limitation or “hard constraints.”
12
Ahmed Faruqui and Lisa Wood, “Quantifying the Benefits of Dynamic Pricing in the Mass Market,”
Edison Electric Institute, January 2008, Table 7, p.18.
13
“What Consumers -- and Retailers -- Should Know about Dynamic Pricing,” in Knowledge@Wharton.
See: http://knowledge.wharton.upenn.edu/article.cfm?articleid=1245.
14
Nick Wreden, “Advantages of Dynamic Pricing,” Direct Marketing News, May 13, 2003. See:
http://www.dmnews.com/advantages-of-dynamic-pricing/article/80877/.
15
Leslie Anne Palamar and Victoria Edwards ,“Dynamic Pricing Friend or Foe, A report on the state of
dynamic pricing in the contracted, corporate rate segment of the North American hospitality industry,”
2007, bte tourism training and consulting, Buckhiester Management.
16
Ibid, p.4.
5](https://image.slidesharecdn.com/anationalperspectiveonusingratestocontrolpowersystemcostsrecommendationsversion-compatable5-24-11-111013130440-phpapp01/75/A-national-perspective-on-using-rates-to-control-power-system-costs-recommendations-version-compatable-5-24-11-7-2048.jpg)
![is, if the pricing scheme contains prices that are allowed to vary with time, then
that pricing scheme is dynamic.22 One example of this is a report by the Public
Utility Commission of Texas (PUCT) to the Texas Legislature defines “Dynamic
pricing [as] either time-of-use or real-time pricing…”23 In contrast, the National
Action Plan on Demand Response24 explicitly excludes TOU rates from DP.
They reject TOU as one form of DP since the peak period and rates do not
change in response to changes in system conditions.
Yet a third approach is contained in a report out of the Wharton School which
lumps DP in with other forms of flexible pricing.25 One example they use is drug
companies setting lower prices for low-income customers.
In a paper surveying the results of 17 DP programs, the authors define dynamic
pricing as prices that reflect the wholesale market prices.26 They also reject TOU
as a form of dynamic pricing since the peak period and the rate(s) are set in
advance. However, they do include CPP as a form of dynamic pricing even
though the rates are set in advance. They note that the CPP critical days are
called based on wholesale market conditions. Because of this feature, CPP
reflects power system conditions.
Given the confusion about what is and what is not DP, the clearest and cleanest
approach is to define a pricing scheme as dynamic if it reflects system conditions
at the moment the prices are established or the critical day is called. Therefore,
RTP is dynamic as is CPP. PTR may be dynamic if either the rebate amount or
when it is effective varies with system conditions. Day ahead pricing (DAP) is
also a form of DP since prices reflect system conditions at the time they are
posted. TOU rates are not dynamic pricing even though it‟s a scheme with
different prices at different points in time that have some relationship to historical
22
For example, Faruqiu argues that „Dynamic pricing is a form of time-of-use (TOU) pricing.” See:
Ahmad Faruqui, “The Ethics of Dynamic Pricing,” The Energy Journal, July 2010, p. 13.
23
“A Report on Advanced Metering as Required by House Bill 2129 Public Utility Commission of Texas
September 2010,” Public Utility Commission of Texas September 2010
24
National Action Plan on Demand Response, FERC, June 17, 2010, footnote 15 on pg. 4.
25
“What Consumers -- and Retailers -- Should Know about Dynamic Pricing”
26
Ahmad Faruqui and Sanem Sergici, “Household Response to Dynamic Pricing of Electricity a Survey of
Seventeen Pricing Experiments,” November 13, 2008.
8](https://image.slidesharecdn.com/anationalperspectiveonusingratestocontrolpowersystemcostsrecommendationsversion-compatable5-24-11-111013130440-phpapp01/75/A-national-perspective-on-using-rates-to-control-power-system-costs-recommendations-version-compatable-5-24-11-10-2048.jpg)
![use patterns. Prices that vary across markets, such as those described in the
Wharton School paper, are also not dynamic.
V. Dynamic Pricing and TOU Rate Design Issues
This section is split into four sub-sections. Each sub-section addresses an issue
that should be addressed in DP and/or TOU rate design.
Length of Time Price is Stable
This issue applies to both DP and TOU. Referring first to RTP, experiments that
I‟ve seen use hourly day-ahead price, sometimes referred to as DAP, as the
price signal. Some, but not all, then use the actual RTP for a given hour for
billing.
One type of DP that has received consideration and that is the focus of a pilot
program development by PGE is CPP. One report argues that CPP is essentially
an alternative approach to pricing peak and off-peak energy differently.27 The
IEEE Whitepaper correctly note that CPP is an attempt to send price signals to
customers that accurately captures the actual cost of providing electricity on a
small number of hours on a few critical days during the year. They suggest that
CPP is “…particularly effective when high wholesale prices are limited to about
100 hours of the year, and their onset is somewhat predictable.”28 CPP is better
than TOU since from an efficiency perspective “…the additional charges are
based on consumption when the [electric] system is actually constrained. Since
CPP effectively allows retail prices to vary with some movements in the
wholesale market, it captures some of the efficiency aspects of RTP.
How far in advance prices are set
Borenstein distinguishes between what he calls the „granularity‟ of prices and
how far in advance prices are set, which he refers to as the „timeliness of
prices.‟29 It makes little sense to set hourly prices a year in advance, for
example. The implication here is that the shorter the timeframe to which a given
27
IEEE Whitepaper, p. 3.
28
Ibid.
29
Ibid, p. 8.
9](https://image.slidesharecdn.com/anationalperspectiveonusingratestocontrolpowersystemcostsrecommendationsversion-compatable5-24-11-111013130440-phpapp01/75/A-national-perspective-on-using-rates-to-control-power-system-costs-recommendations-version-compatable-5-24-11-11-2048.jpg)
![This raises a thorny design problem of how to design rates to encourage the
needed efficiency improvements and simultaneously address the needs of
vulnerable populations. As a result, it is important to pay close attention to rate
designs and rate levels that both reduce the pressure for expansion of the
existing power system and that also have a greater chance of reducing a
customer‟s monthly bill. Those two goals may be mutually exclusive in the near-
term and compatible only in the long-run. In the near-term this will probably
require some type of „work around‟ that will help to blunt the impact on vulnerable
populations. This issue is addressed more fully in section VII.
Interoperability34 has been identified as a factor affecting DR adoption and it can
also be seen as one aspect of equity. Interoperability eases implementation as it
removes concerns about equipment being able to talk with each other. The
customer needn‟t worry if the software and hardware can communicate
effectively. This removes some risk from investment decisions, especially when
standards are not yet in place. Since more affluent customers will be less
concerned about this issue than will the more vulnerable customers, this
requirement is especially important as one part of managing the impact of DP
(and maybe TOU) on vulnerable populations.
Degree of Market Segmentation
If some rates are optional, one question is how to design of those rates to make
them attractive option relative to current rates. Lewis characterizes rate choice
by customers as a risk management issue. What is striking is the shift in focus
away from focusing solely on cost recovery to rate designs that offer customers
options to individual risk-reward profiles.
This isn‟t a new concept even when applied to regulated electric utilities, though
the industry is on the cusp of a sea-change in product and price offerings.
Mohler put it thusly, "We should have [the] ability to differentially price [EV
charging services],".The fast-charge price could be equivalent to $20 for a gallon
34
Interoperability is the notion that different equipment potentially from different suppliers be able to „talk‟
to each other. For example, the communication protocols allow for information, data, to be passed through
the system. Imagine that you could use your cell phones with any carrier? If that were the case, cell
phones and communications infra-structure would be interoperable.
12](https://image.slidesharecdn.com/anationalperspectiveonusingratestocontrolpowersystemcostsrecommendationsversion-compatable5-24-11-111013130440-phpapp01/75/A-national-perspective-on-using-rates-to-control-power-system-costs-recommendations-version-compatable-5-24-11-14-2048.jpg)
![resources devoted to electric production and thereby reduces the environmental
impacts associated of expansions.
Faruqui suggests targeting those most likely to benefit while avoiding those most
likely to be harmed by DP. He argues that the benefits of DP can be achieved
without having all customers participate. While there‟s isn‟t adequate room in
this paper to layout his argument with the accompanying graphs, suffice it to say
that a customer with a load profile flatter than the class average will benefit
immediately from DP and should enroll.
VII. Concerns about Vulnerable Populations
Earlier, I touched on the very hot issue of how a move from fixed rates impact
vulnerable populations. While there is no lack of opinion on this issue, there is a
lack of solid data upon which to reach conclusions about how best to protect
vulnerable populations while also designing prices to better reflect costs.
This concern about harming some ratepayers has its roots in a belief about what
constitutes a fair price. Faruqui references Vickery who, in a paper on
responsive pricing, proposed there was a sense of a just price as an ethical
norm. This belief in a fair price on an ethical basis was echoed by Eric Hirst who
wrote [regarding DP], “The greatest barriers are legislative and regulatory,
deriving from state efforts to protect retail customers from the vagaries of
competitive markets.42 It goes without saying (but I‟ll say it) that flat electric rates
while a time-honored design for residential customers in particular, result in
higher system costs and higher overall rates than need be the case.
Another issue is who to include as part of a vulnerable population. Often these
populations are identified as the elderly, or low-income customers, or the
medically fragile. As Alexander points out, it can be very difficult to find these
customers. She argues that utilities don‟t typically gather demographic date,
such as, a customer age and household income.43 She also argues that
reliance on the Low Income Home Energy Assistance Program doesn‟t solve this
42
Eric Hirst, “Price Responsive Demand in Wholesale Markets: Why is so Little Happening?”
43
Ibid, p. 44.
15](https://image.slidesharecdn.com/anationalperspectiveonusingratestocontrolpowersystemcostsrecommendationsversion-compatable5-24-11-111013130440-phpapp01/75/A-national-perspective-on-using-rates-to-control-power-system-costs-recommendations-version-compatable-5-24-11-17-2048.jpg)
![concise overview of this linkage was provided by Rick Bush, where he notes that
over 70 utilities offer RTP as either a pilot or a permanent program. In a
cautionary note from the telecom industry, Bush comments that consumers
appear to desire choice until a large bill arrives, and then choice isn‟t seen in
such favorable light.
Realizing DR requires more than just adopting some form of DP. It also requires
that enabling technology be installed that can take the price signals and
automatically change consumption (as pre-determined by the building
tenant/owner). One report on enabling technology, based on a review of 57
different residential sector initiatives performed between 1974 and 2010,
concludes that to realize higher program savings, smart meters must be used in
conjunction with real-time (or near-real time) web-based or in-home devices and
enhanced billing approaches and well-designed programs that successfully
inform, engage, empower, and motivate customers.68
Numerous studies demonstrate that DR potential varies from modest to
substantial, largely depending on the data used in the experiments and the
availability of enabling technologies. Across the range of experiments examined,
TOU rates induced a drop in peak demand that ranged between three to six
percent. By comparison, CPP tariffs led to a drop in peak demand of 13 to 20
percent. When enabling technologies were employed, reductions in peak
demand from CPP rates range from 27 to 44 percent.69
IX. Opt In, Opt Out, Mandatory Participation
Earlier in this paper, I made reference to a report titled “The Five Percent
Solution, How Dynamic Pricing Can Save $35 Billion in Electricity Costs.” The
authors of that paper used Monte Carlo simulation to estimate participation rates
of opt out versus opt in program designs. They concluded that “…about 80
percent [of customers] would stay on dynamic pricing if it is offered as the default
rate and that a substantially smaller number, perhaps 20 percent, would select in
68
Ehrhardt-Martinez, Karen, Kat A. Donelly and John A. “Skip” Laitner, “Advanced Metering Initiatives
and Residential Feedback Programs: A Meta-Review for Household Electricity-Saving Opportunities,”
June 2010, available at http://www.aceee.org/pubs/e105.htm.
69
Faruqui and Sergici.
20](https://image.slidesharecdn.com/anationalperspectiveonusingratestocontrolpowersystemcostsrecommendationsversion-compatable5-24-11-111013130440-phpapp01/75/A-national-perspective-on-using-rates-to-control-power-system-costs-recommendations-version-compatable-5-24-11-22-2048.jpg)


![Top Ten Utilities by Demand-Side Management 2011 [Smart Grid Research], Zprym...](https://cdn.slidesharecdn.com/ss_thumbnails/top10usutilitiesbydsminvestmentzprymesmartgridinsightsmarch2011-110403153820-phpapp02-thumbnail.jpg?width=640&height=640&fit=bounds)