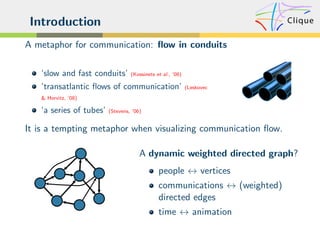
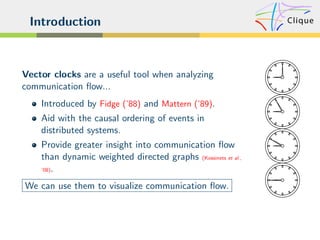
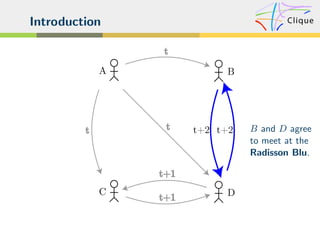
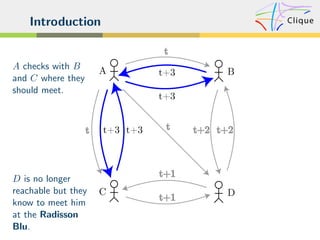
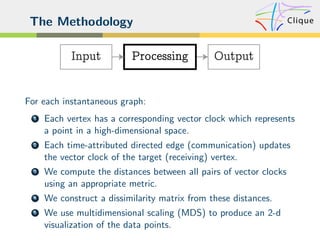
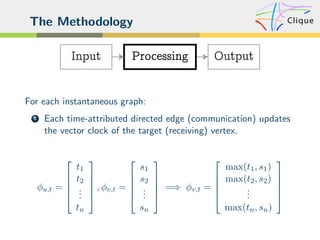
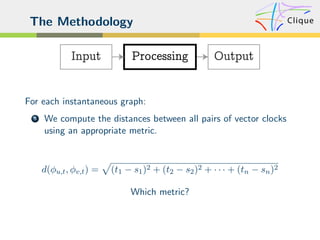
The document describes a methodology for visualizing communication flow using vector clocks. It begins with an introduction discussing communication flow as a metaphor and the need to ground visualizations in the analyzed substance. It then outlines the methodology which involves (1) assigning each vertex a vector clock representing its position in a high-dimensional space, (2) updating vector clocks based on communications, (3) computing distances between vector clocks, (4) constructing a dissimilarity matrix, and (5) using multidimensional scaling to produce a 2D visualization. Experiments applying the methodology to artificial and real communication datasets are discussed. The conclusion covers future work opportunities around the distance metric, modeling additional properties, and scalability issues.


![The Methodology
During a time interval [0, T ], we have a set of vertices V and
a set of time-attributed directed edges E.
The instantaneous graph Gt = (V, Et ) at time-slice t is the
graph with vertex set V and edge set
Et = {(u, v)|(u, v, t) ∈ E}.
Input: G0 , . . . , GT (instantaneous graphs)](https://image.slidesharecdn.com/vectorclocksasonam10-100810094620-phpapp02/85/Using-Vector-Clocks-to-Visualize-Communication-Flow-13-320.jpg)
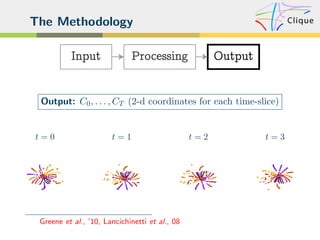


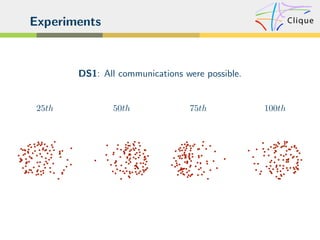
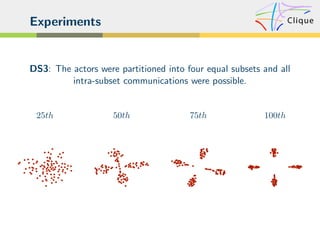
![Experiments
Four artificial datasets comprising temporal sequences of
communications between 100 actors during a time interval
[0, 99].
The datasets were generated by fixing the set of possible
communications and then selecting a communication from the
set of possible communications at time-slice t with probability
p = 0.005.
Each dataset had a distinct underlying communication
pattern.](https://image.slidesharecdn.com/vectorclocksasonam10-100810094620-phpapp02/85/Using-Vector-Clocks-to-Visualize-Communication-Flow-22-320.jpg)


![Digital Signal Processing[ECEG-3171]-Ch1_L07](https://cdn.slidesharecdn.com/ss_thumbnails/dspl7ch3-180427094425-thumbnail.jpg?width=640&height=640&fit=bounds)