Download to read offline

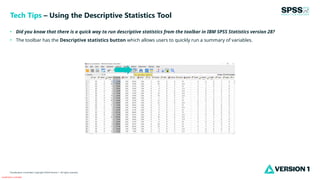
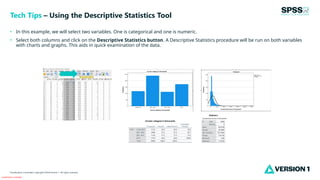

The document provides tips for using the descriptive statistics tool in IBM SPSS Statistics version 28. It explains how to quickly run descriptive statistics by selecting both categorical and numeric variables using a toolbar button, which generates a summary along with charts and graphs for data examination. For further details, readers are directed to visit spssanalyticspartner.com.