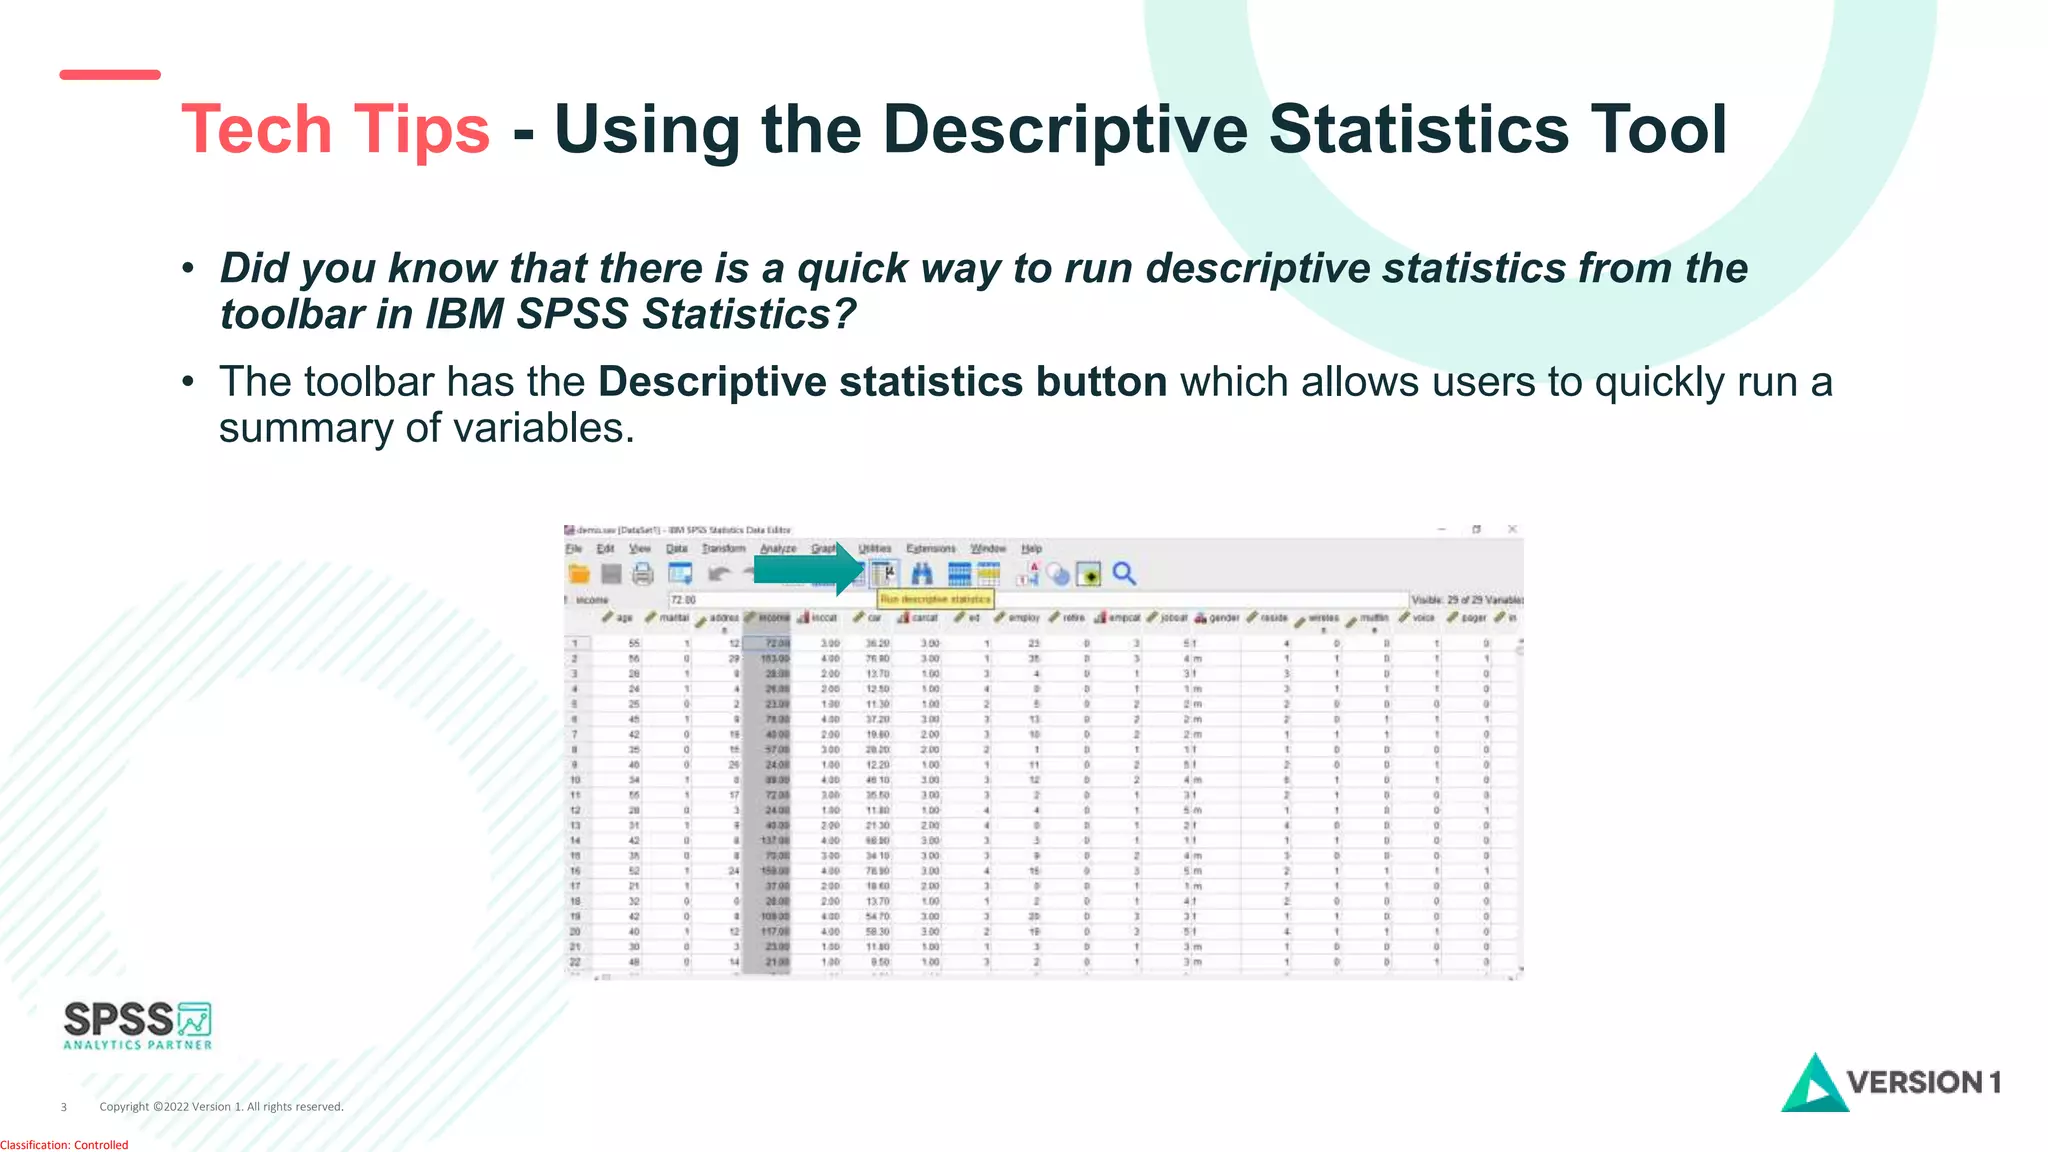
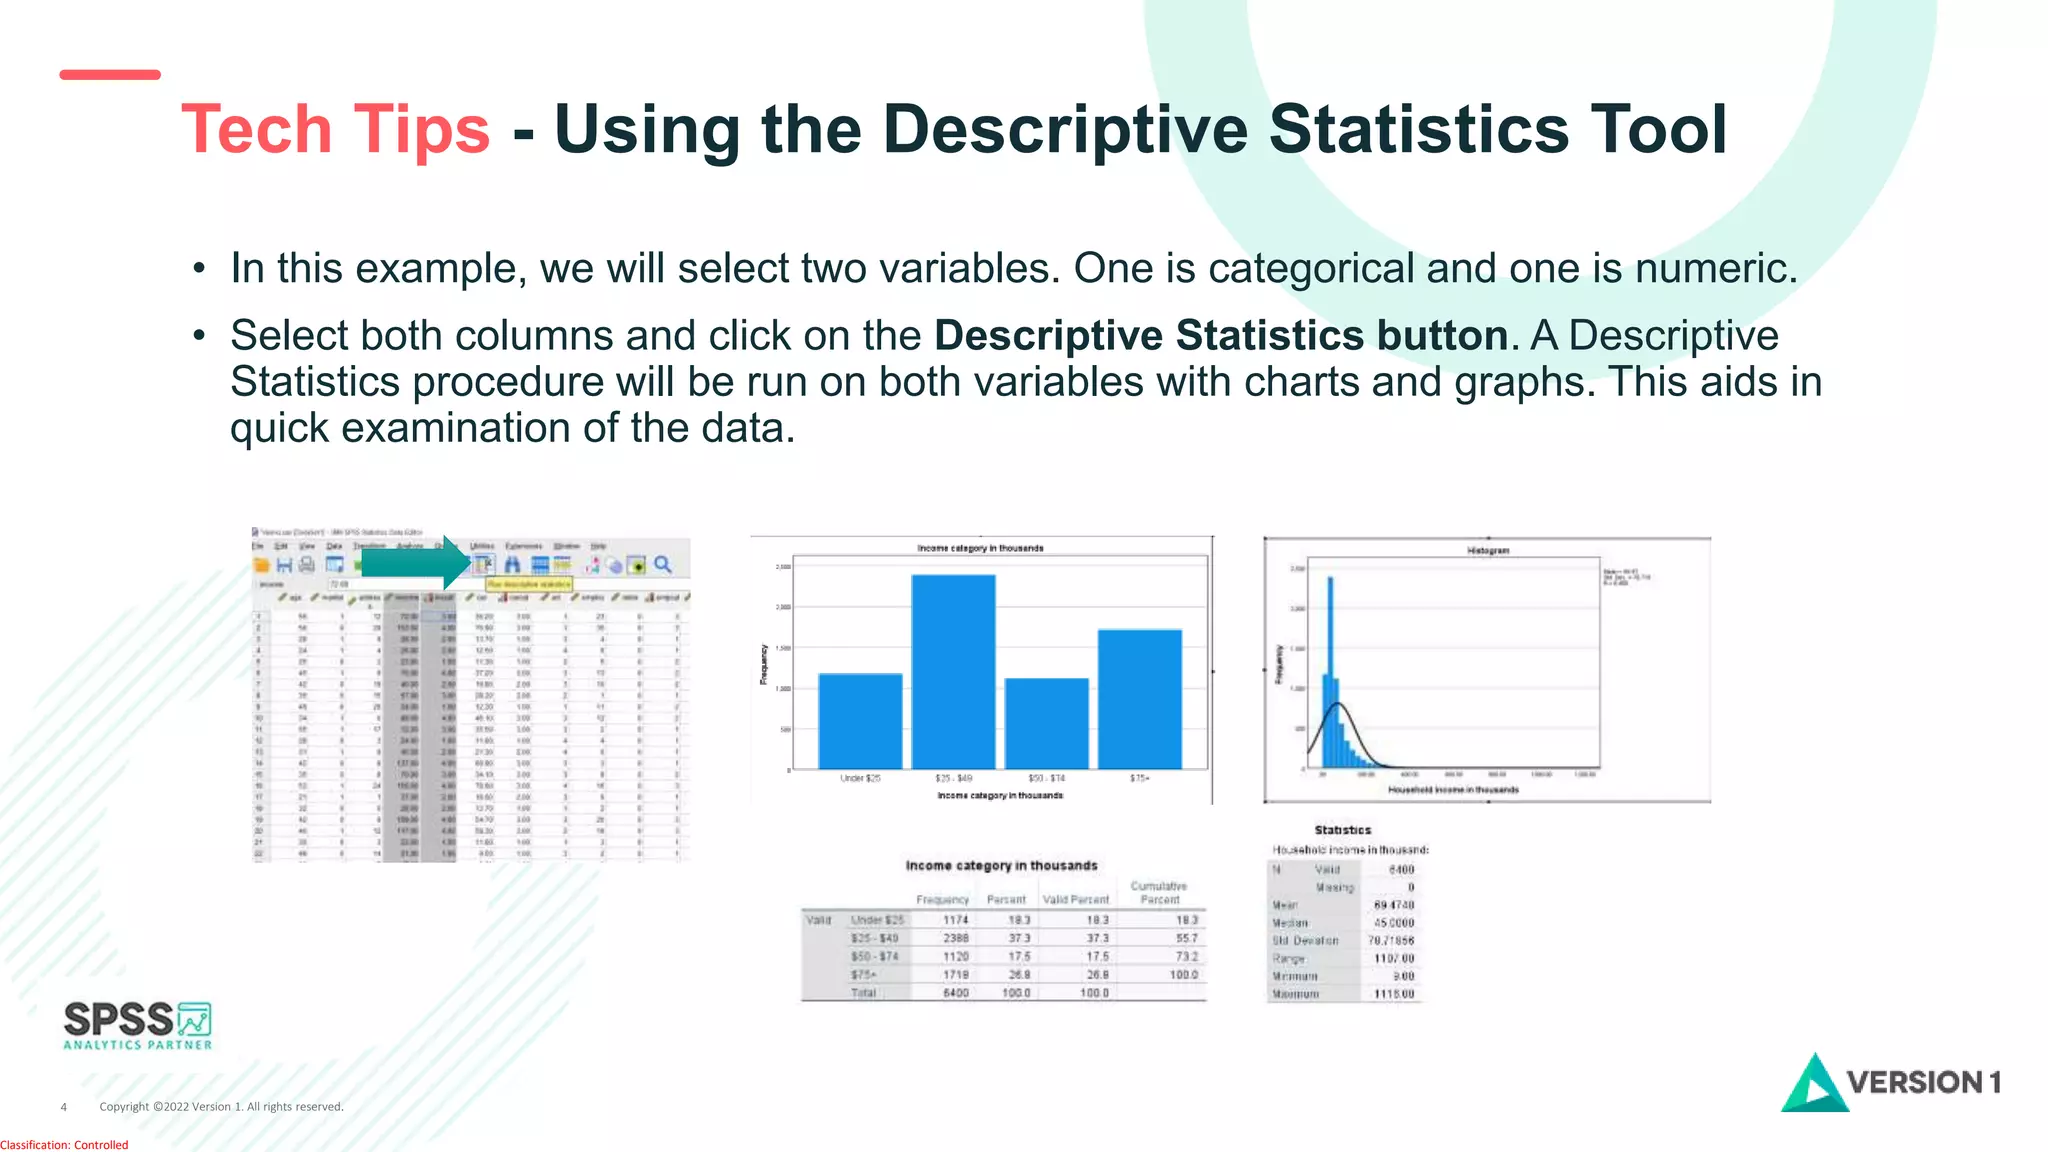
This document discusses using the descriptive statistics tool in IBM SPSS Statistics. It notes that the toolbar has a descriptive statistics button that allows users to quickly run summaries of variables. An example is given where a categorical and numeric variable are selected, and descriptive statistics are run on both variables using this button, generating charts and graphs to aid in examining the data. Contact details are provided for more information.