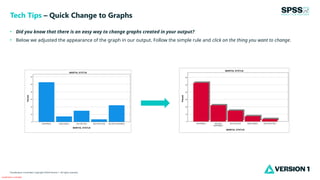
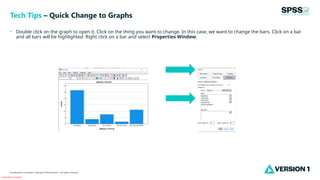
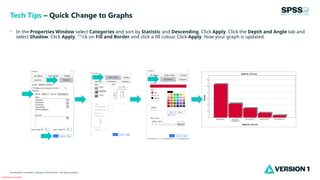
Classification: Controlled
Classification: Controlled. Copyright ©2024 Version 1. All rights reserved.
Quick Change
to Graphs
Tech Tips – IBM SPSS Statistics
Classification: Controlled
Classification: Controlled. Copyright ©2024 Version 1. All rights reserved.
• Did you know that there is an easy way to change graphs created in your output?
• Below we adjusted the appearance of the graph in our output. Follow the simple rule and click on the thing you want to change.
Tech Tips – Quick Change to Graphs
Classification: Controlled
Classification: Controlled. Copyright ©2024 Version 1. All rights reserved.
• Double click on the graph to open it. Click on the thing you want to change. In this case, we want to change the bars. Click on a bar
and all bars will be highlighted. Right click on a bar and select Properties Window.
Tech Tips – Quick Change to Graphs
Classification: Controlled
Classification: Controlled. Copyright ©2024 Version 1. All rights reserved.
• In the Properties Window select Categories and sort by Statistic and Descending. Click Apply. Click the Depth and Angle tab and
select Shadow. Click Apply. Click on Fill and Border and click a fill colour. Click Apply. Now your graph is updated.
Tech Tips – Quick Change to Graphs
,
w
e
w
a
n
t
t
o
c
h
a
n
g
e
t
Classification: Controlled
Classification: Controlled. Copyright ©2024 Version 1. All rights reserved.
For more information
please visit spssanalyticspartner.com
Thank You

Quick Change to Graphs in IBM SPSS Statistics.pptx

  • 1.
    Classification: Controlled Classification: Controlled.Copyright ©2024 Version 1. All rights reserved. Quick Change to Graphs Tech Tips – IBM SPSS Statistics
  • 2.
    Classification: Controlled Classification: Controlled.Copyright ©2024 Version 1. All rights reserved. • Did you know that there is an easy way to change graphs created in your output? • Below we adjusted the appearance of the graph in our output. Follow the simple rule and click on the thing you want to change. Tech Tips – Quick Change to Graphs
  • 3.
    Classification: Controlled Classification: Controlled.Copyright ©2024 Version 1. All rights reserved. • Double click on the graph to open it. Click on the thing you want to change. In this case, we want to change the bars. Click on a bar and all bars will be highlighted. Right click on a bar and select Properties Window. Tech Tips – Quick Change to Graphs
  • 4.
    Classification: Controlled Classification: Controlled.Copyright ©2024 Version 1. All rights reserved. • In the Properties Window select Categories and sort by Statistic and Descending. Click Apply. Click the Depth and Angle tab and select Shadow. Click Apply. Click on Fill and Border and click a fill colour. Click Apply. Now your graph is updated. Tech Tips – Quick Change to Graphs , w e w a n t t o c h a n g e t
  • 5.
    Classification: Controlled Classification: Controlled.Copyright ©2024 Version 1. All rights reserved. For more information please visit spssanalyticspartner.com Thank You