Downloaded 118 times


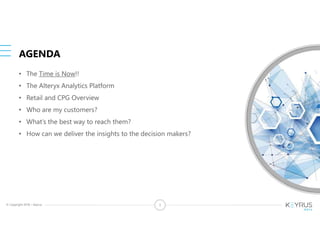
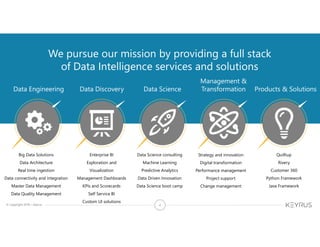
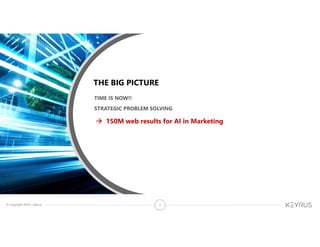
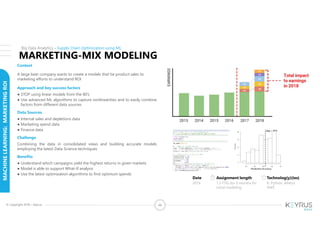
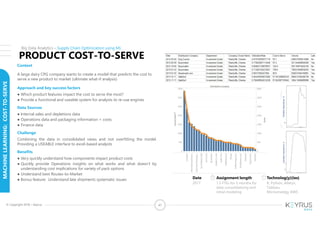

The document outlines a webinar presented by Keyrus and Alteryx focusing on leveraging machine learning and data analytics to enhance marketing ROI in retail and consumer packaged goods sectors. It covers topics including customer segmentation, marketing strategies, and the Alteryx analytics platform, emphasizing the importance of advanced analytics in optimizing marketing spend and improving decision-making. The presentation advocates for employing modern data science techniques over traditional methods to achieve better insight and results in marketing efforts.