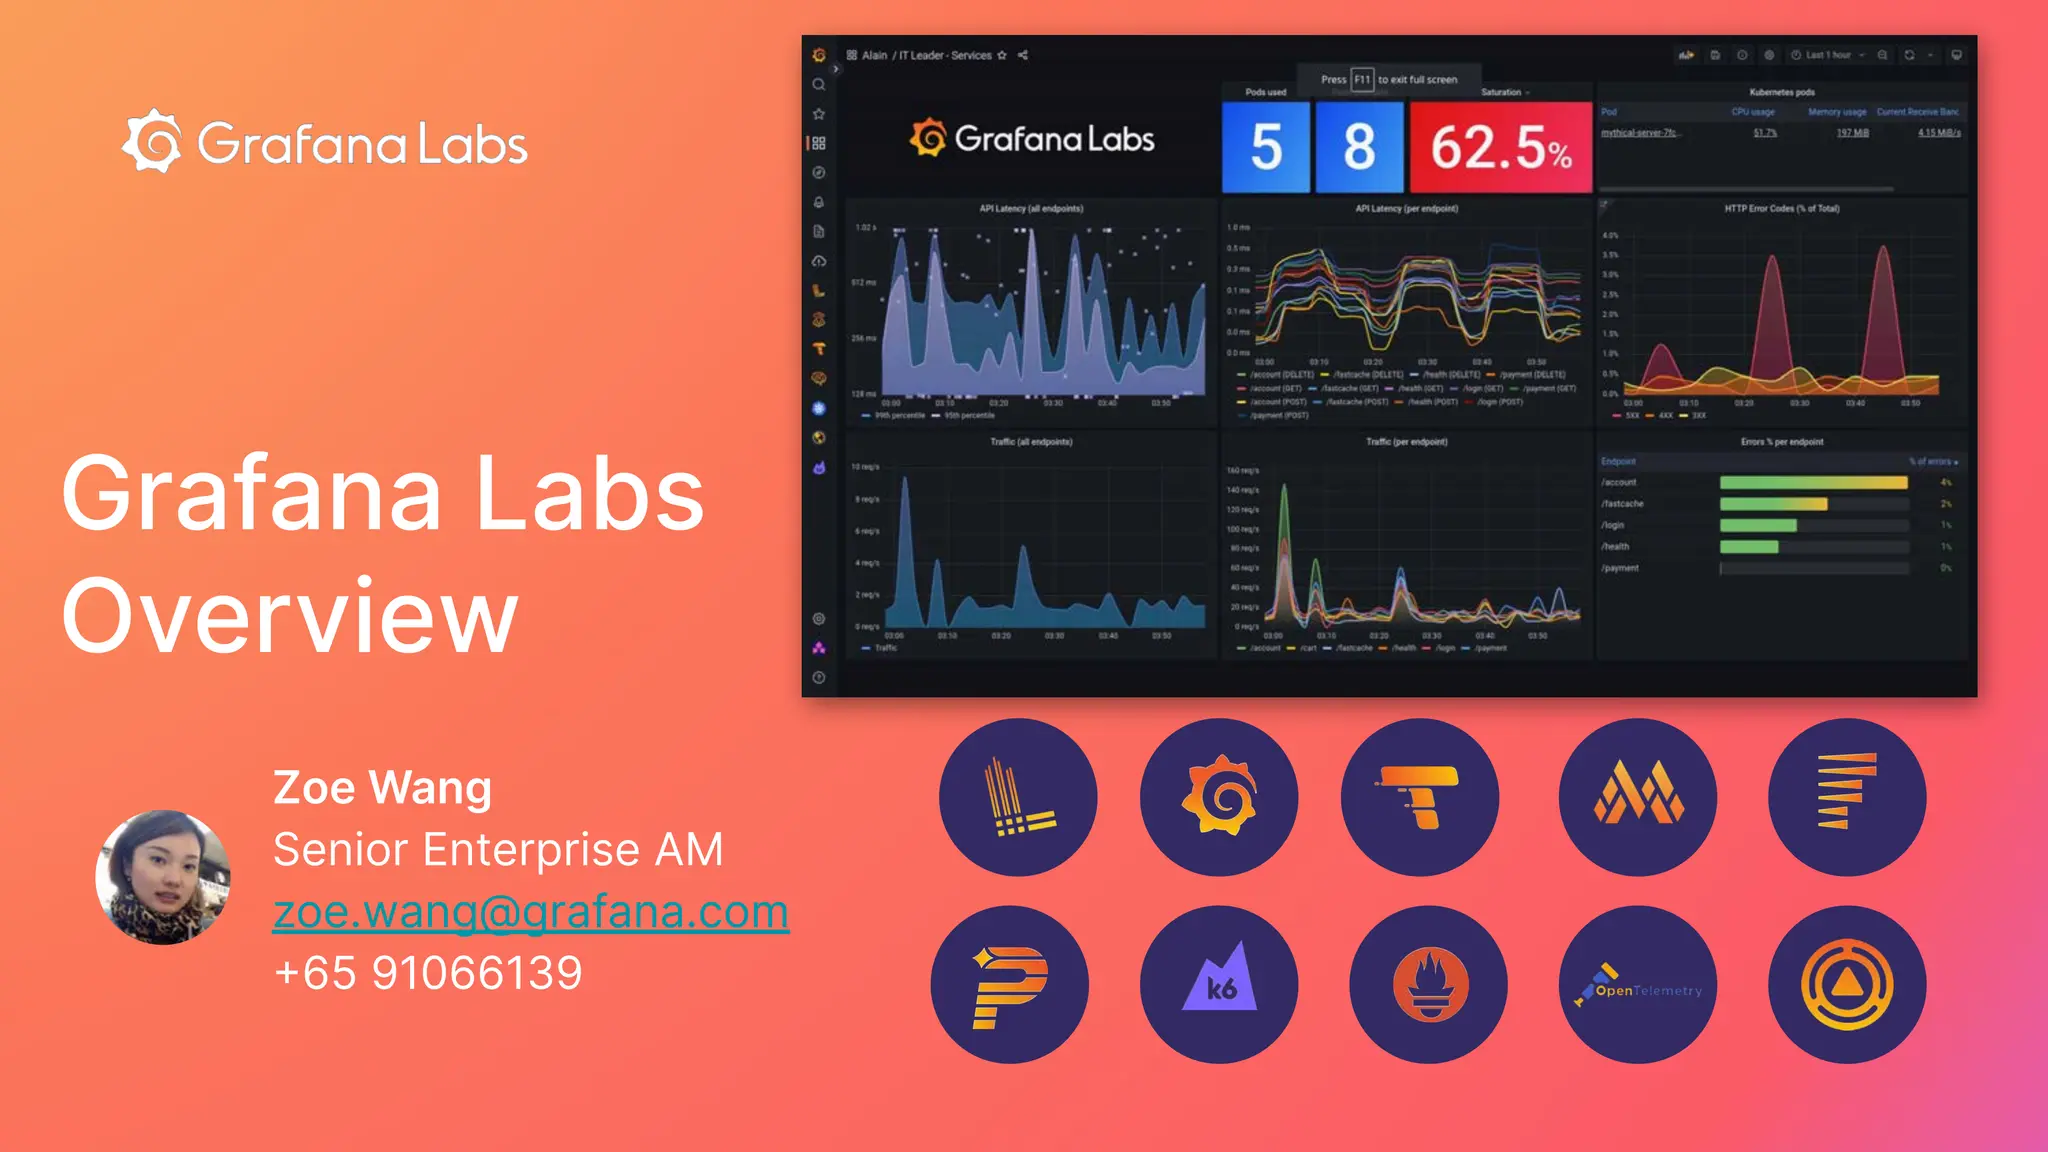
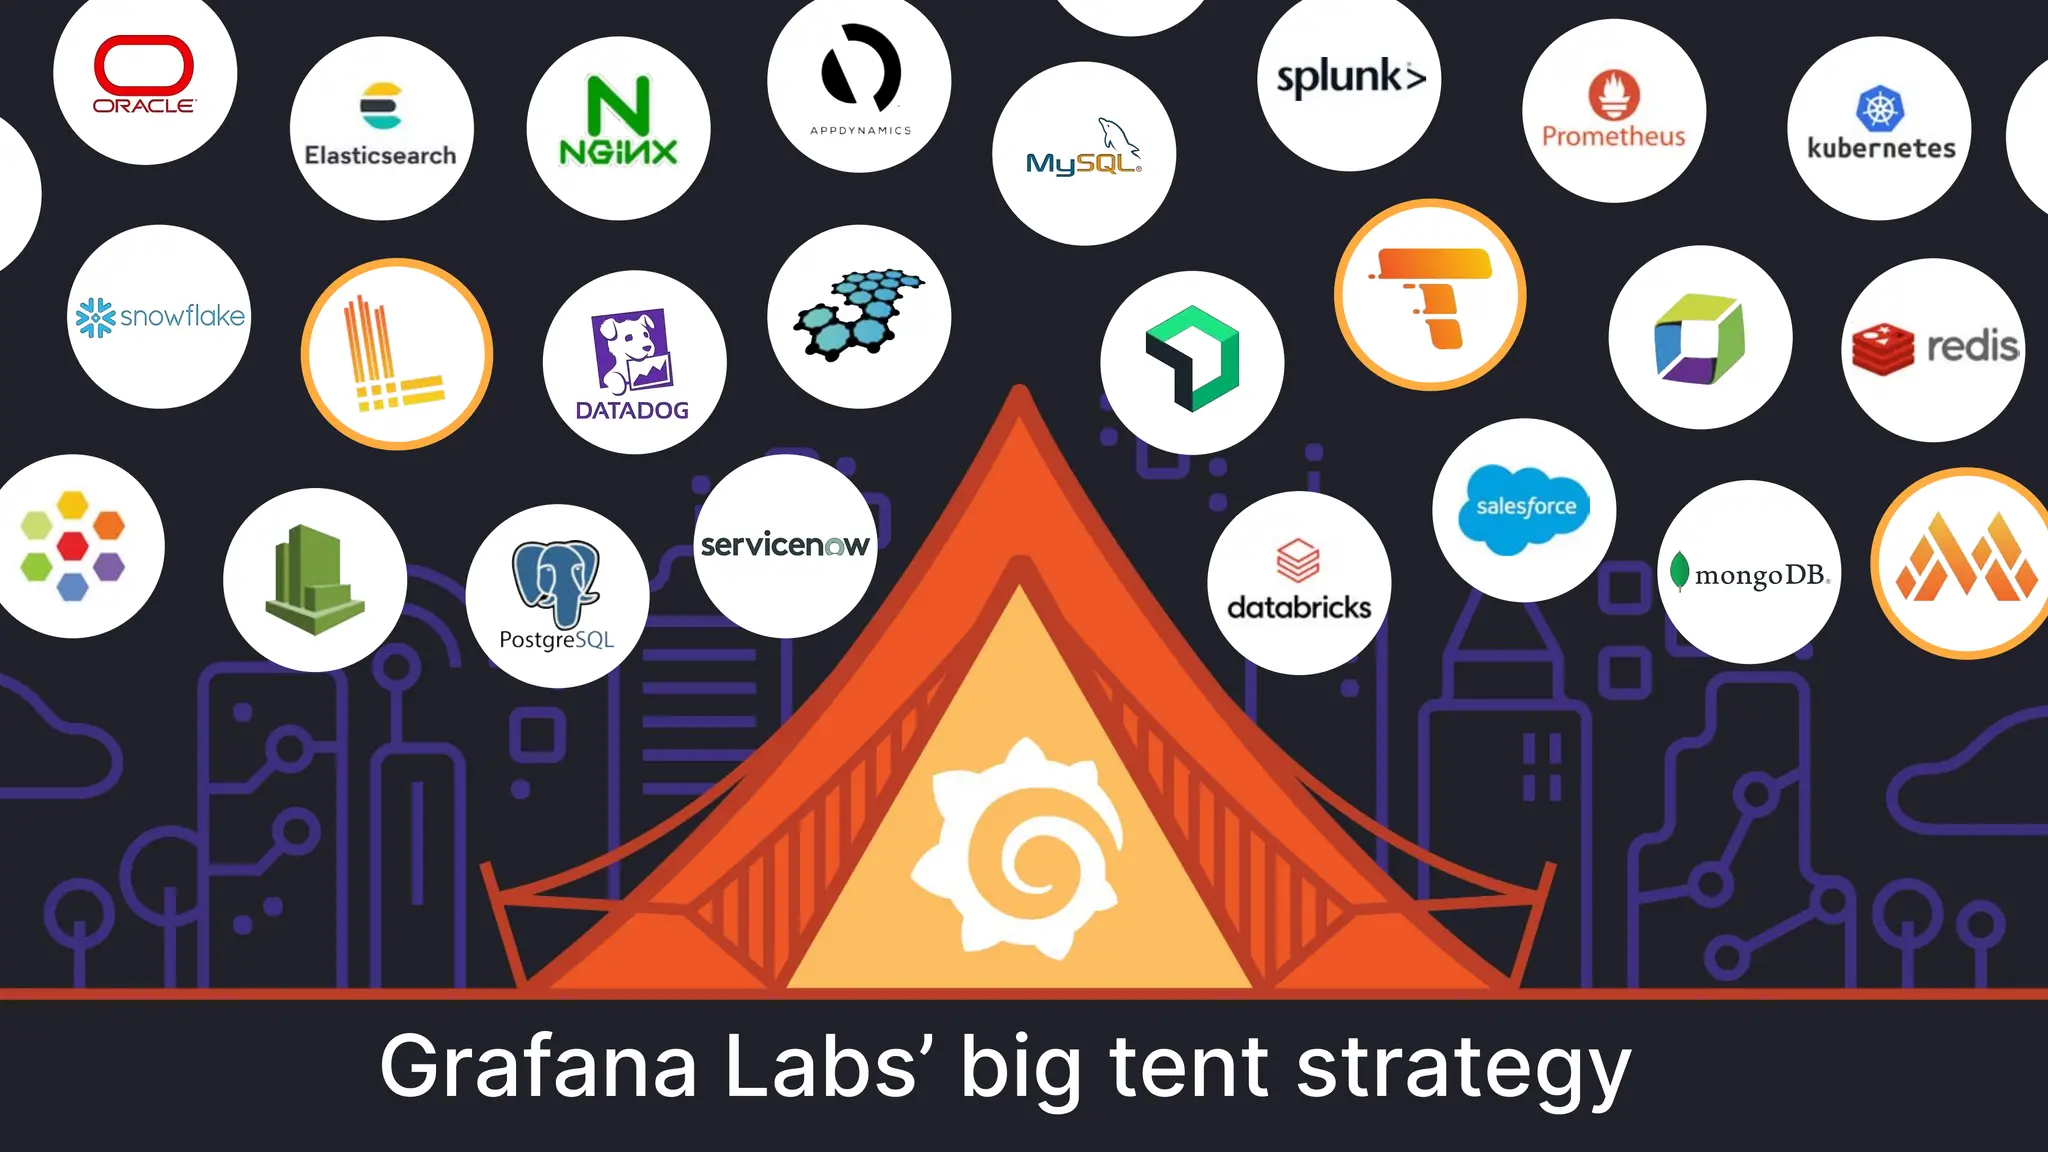
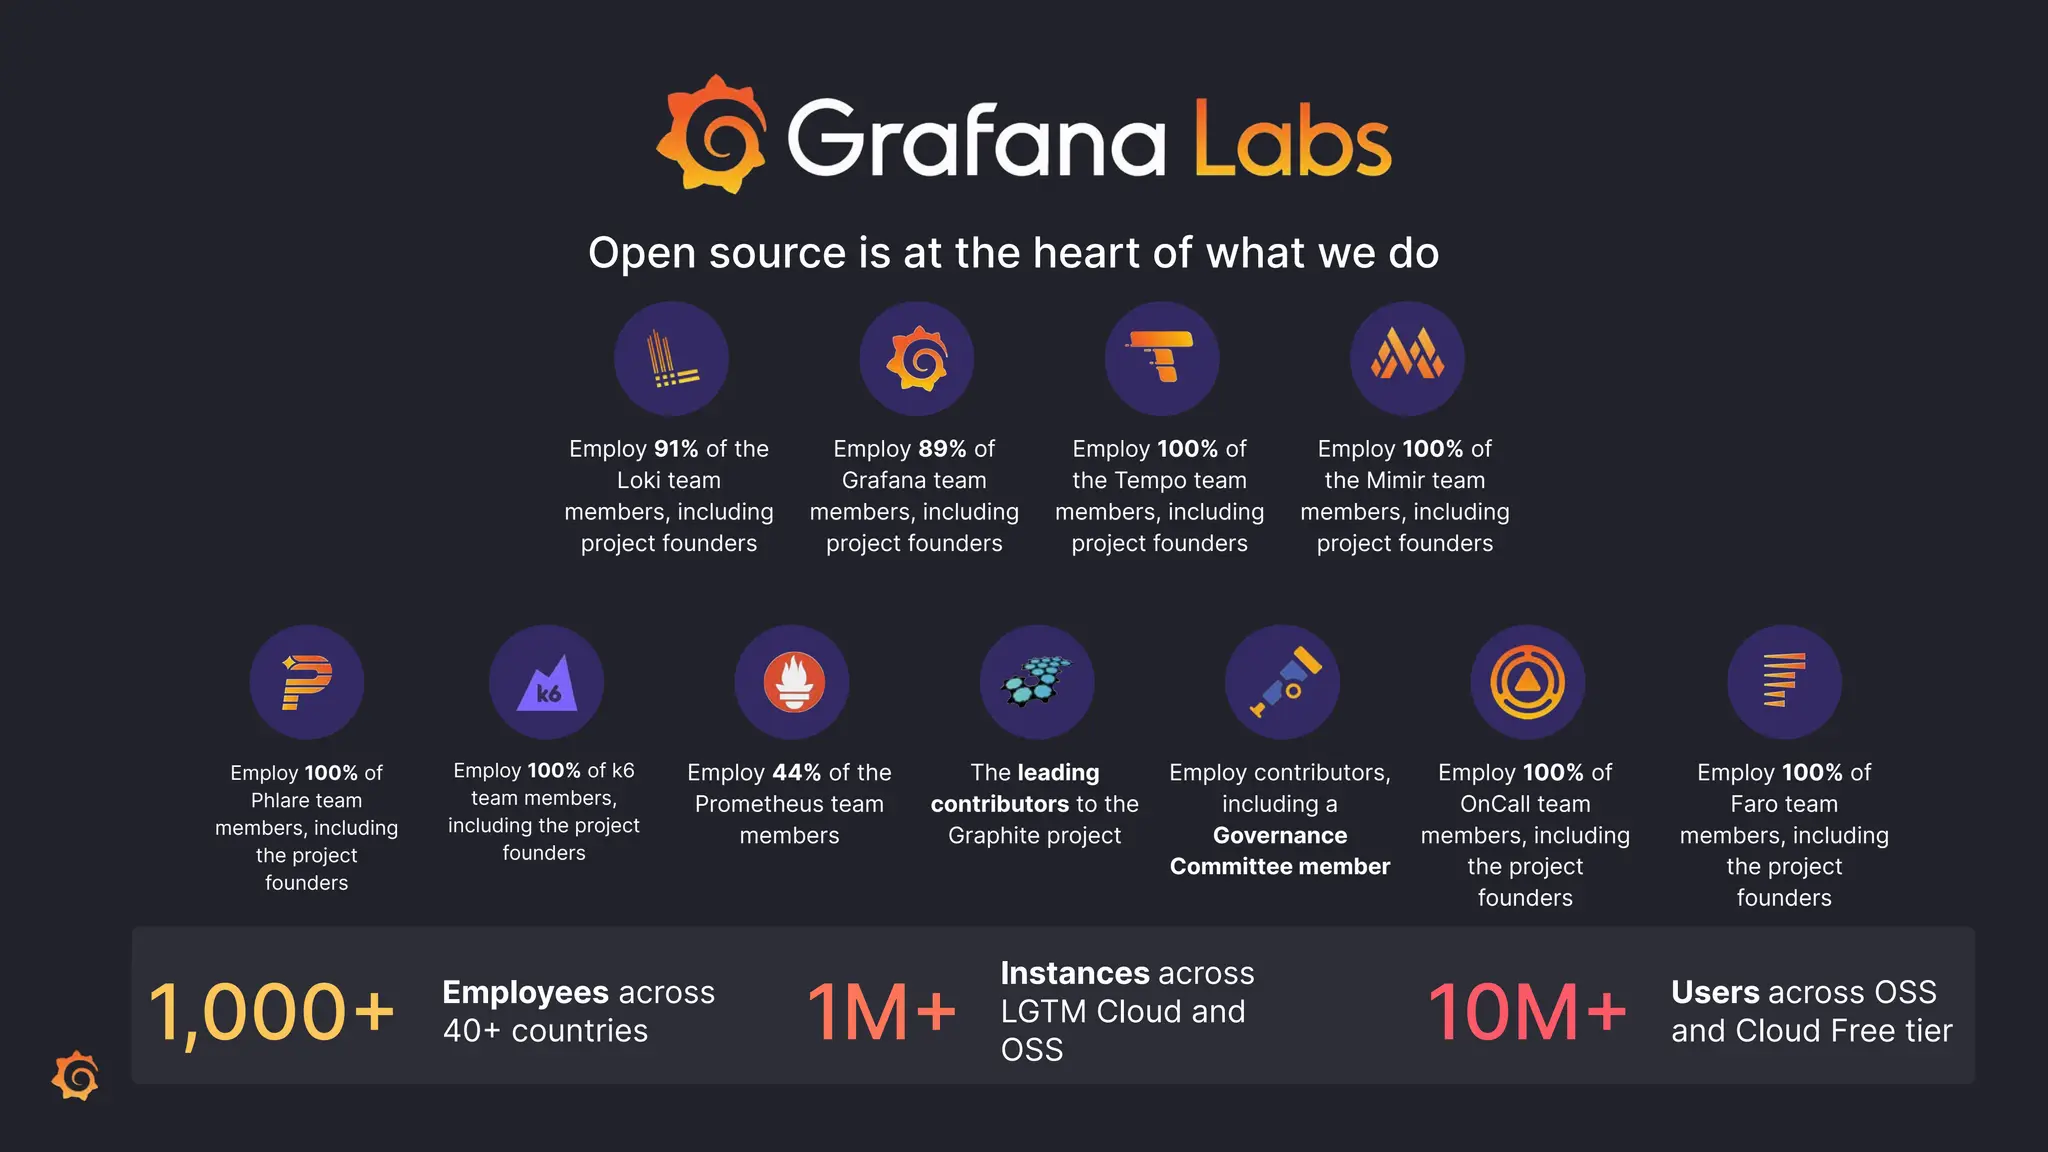
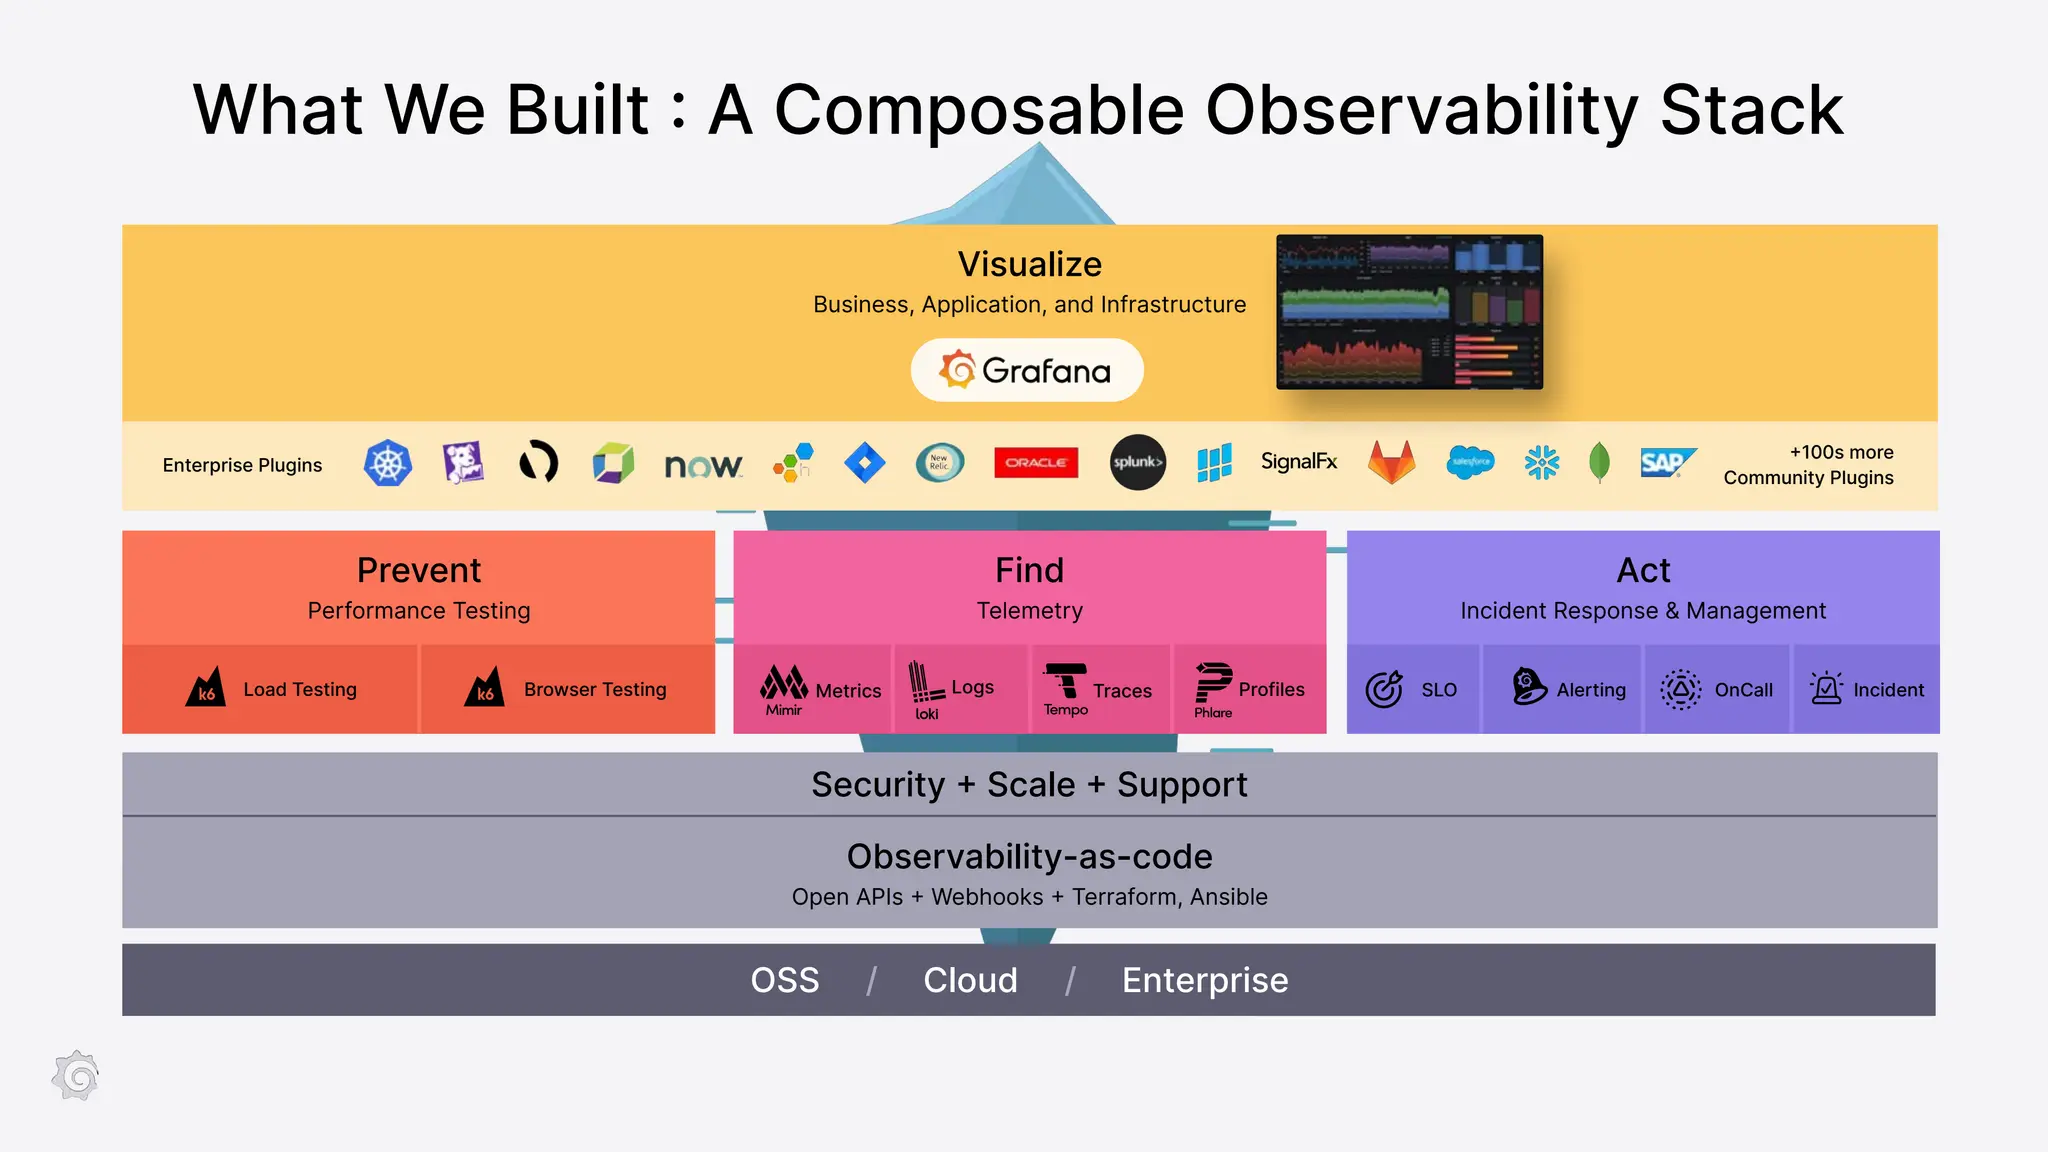
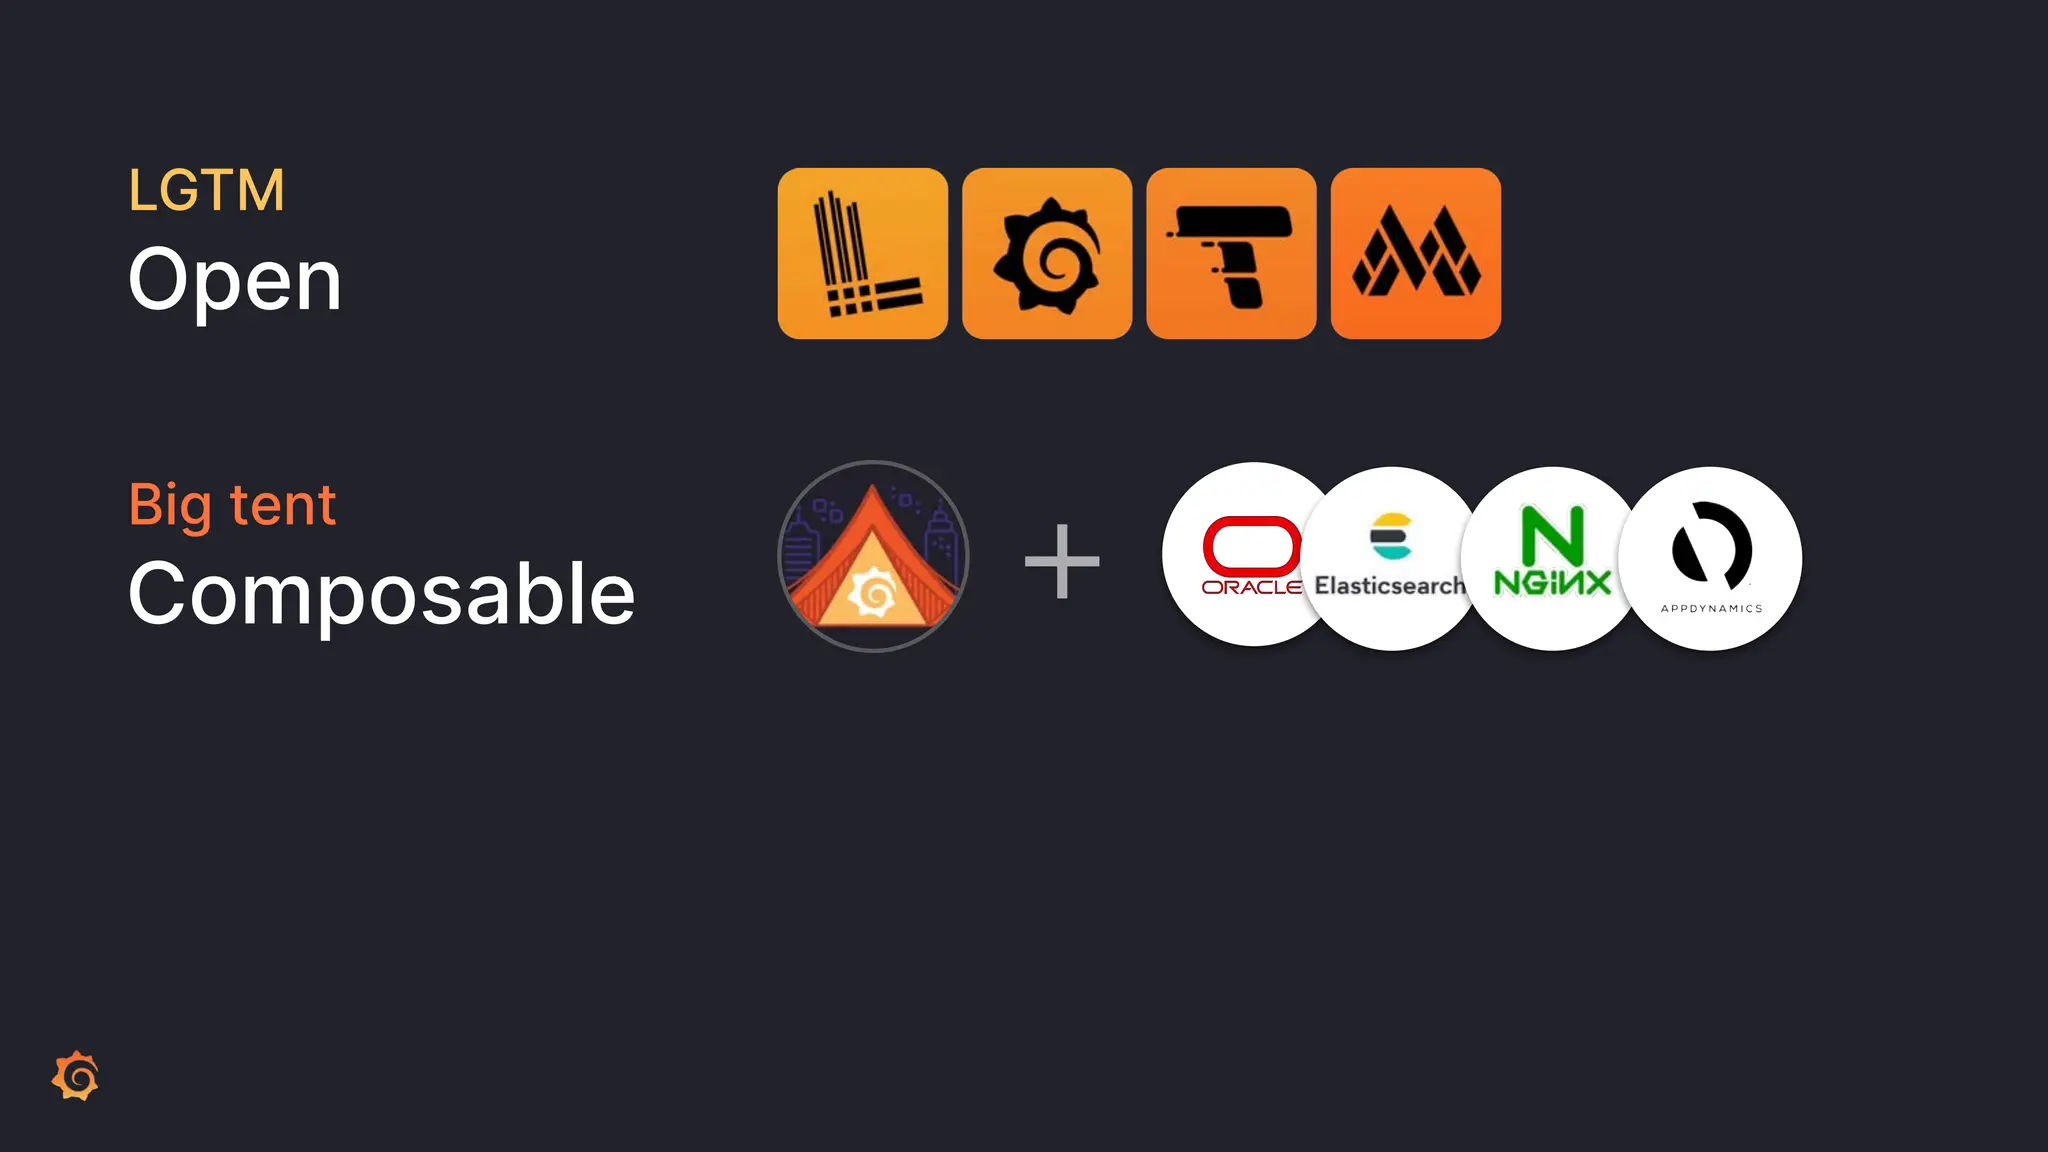
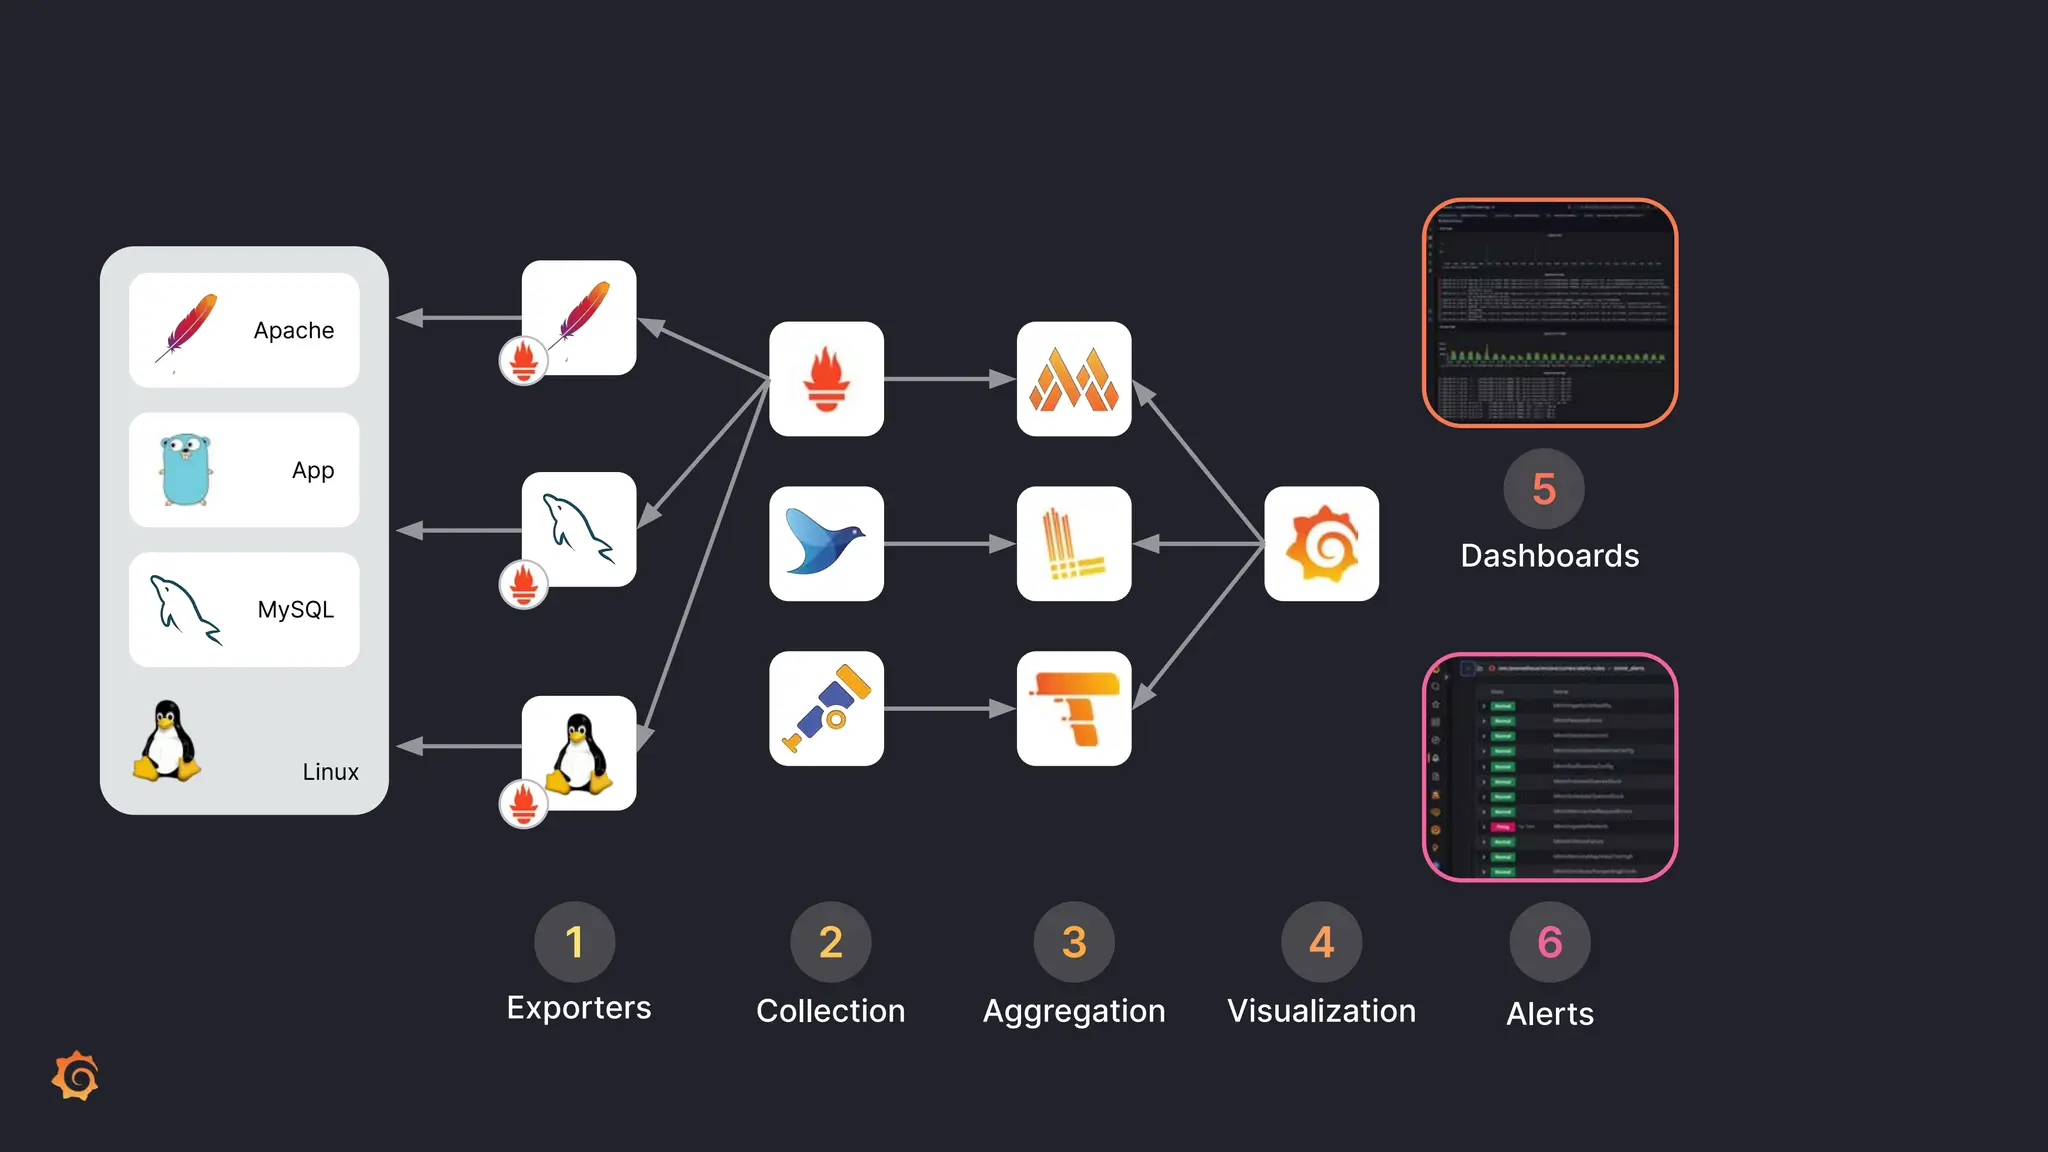
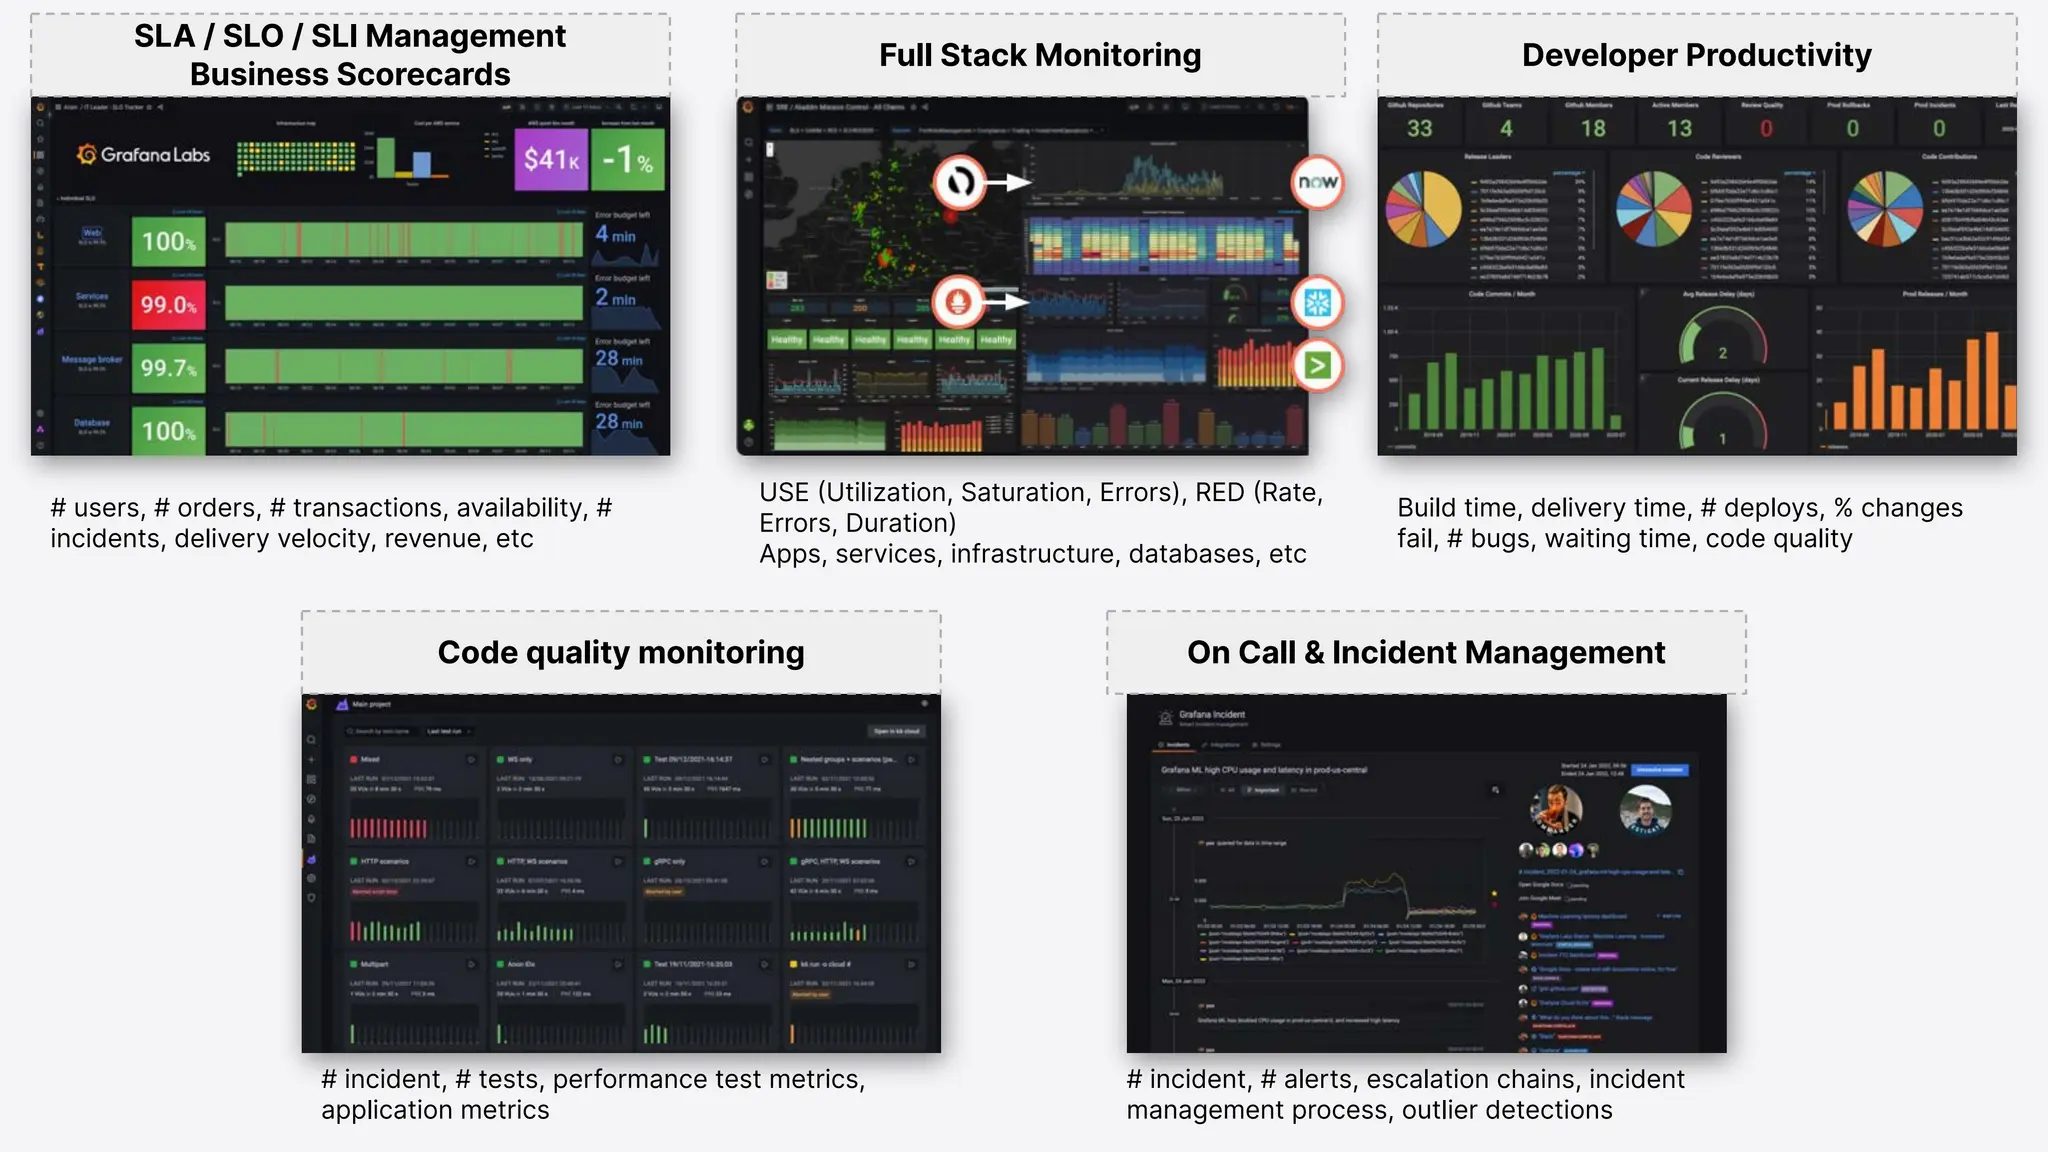
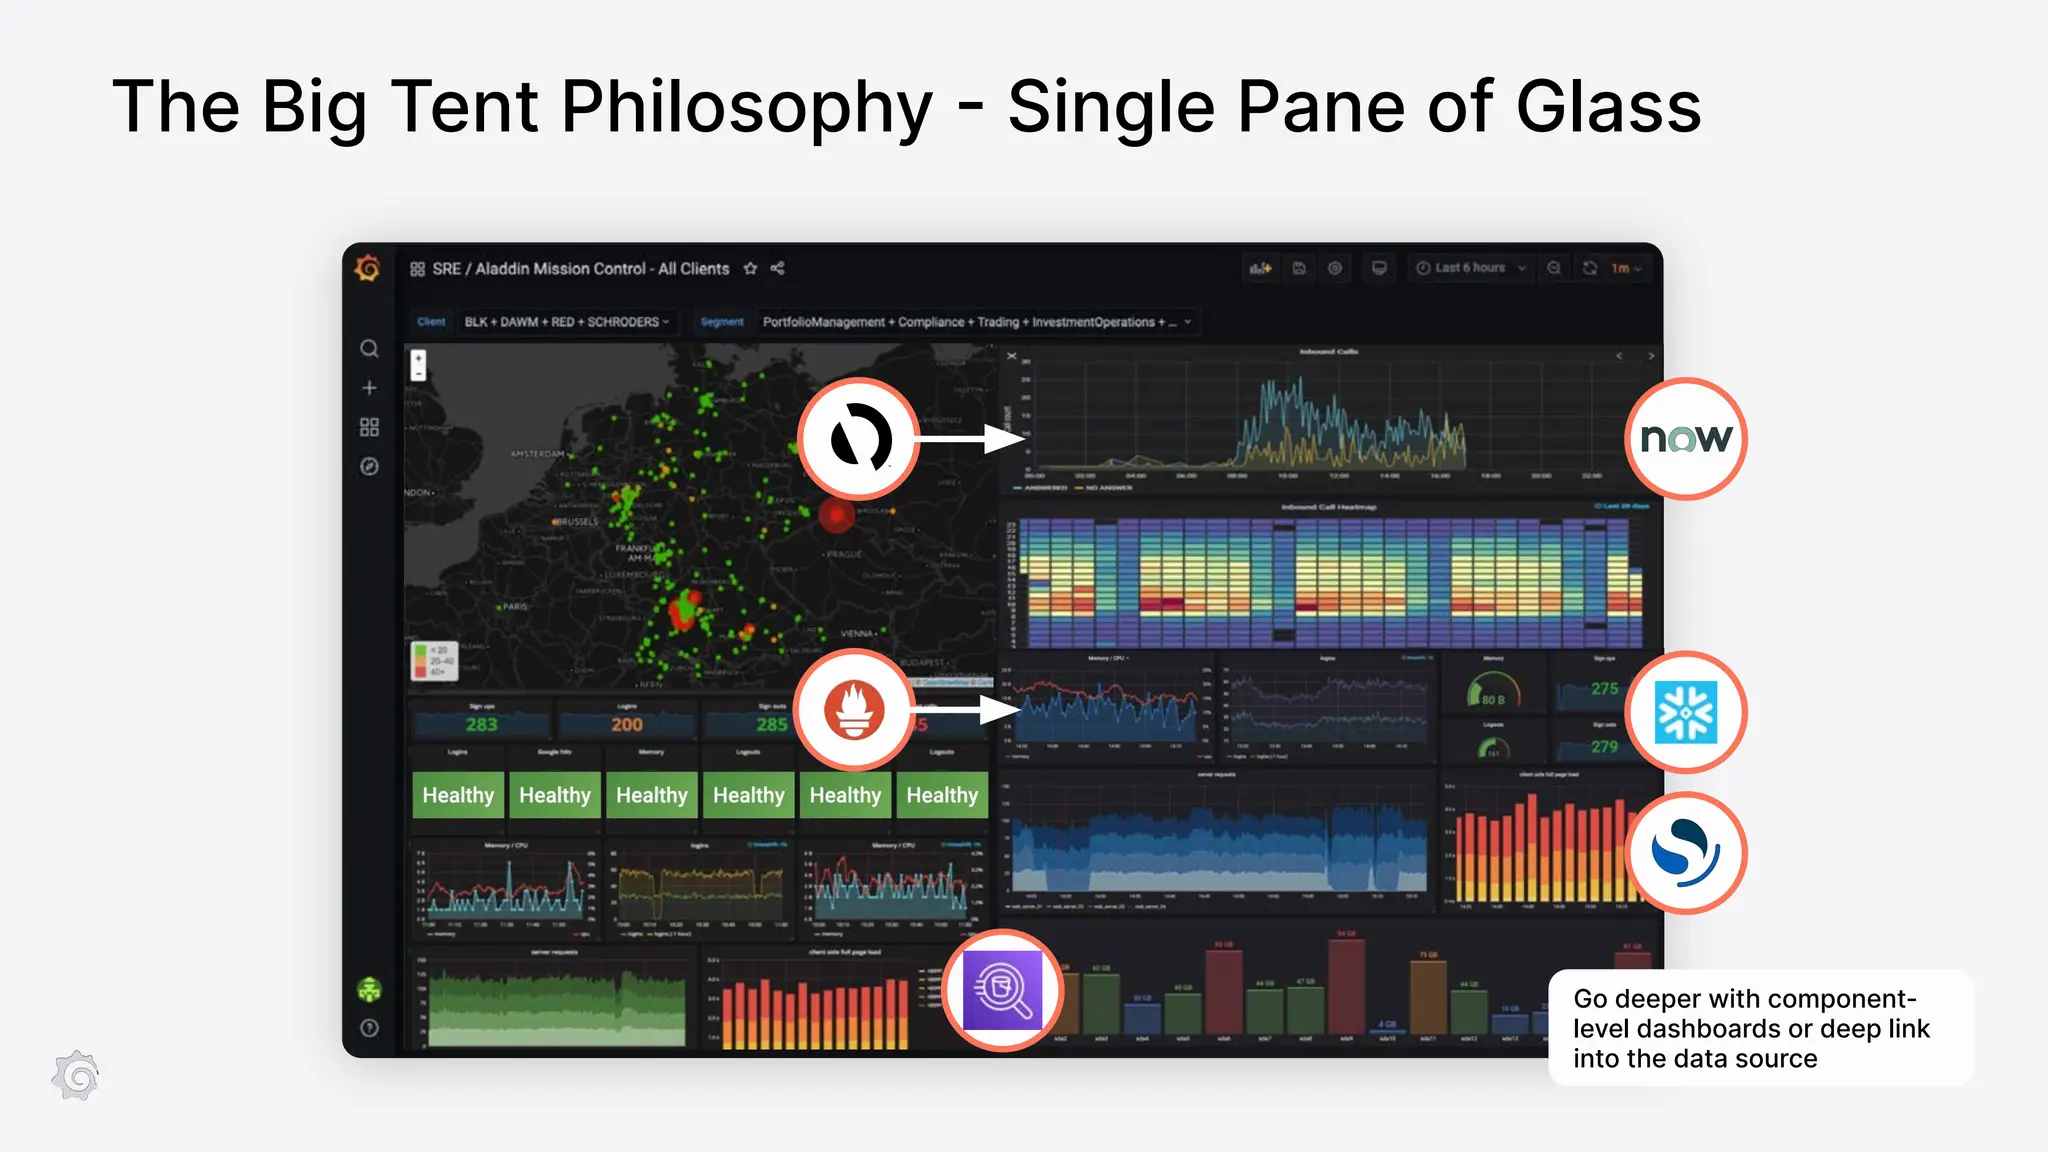
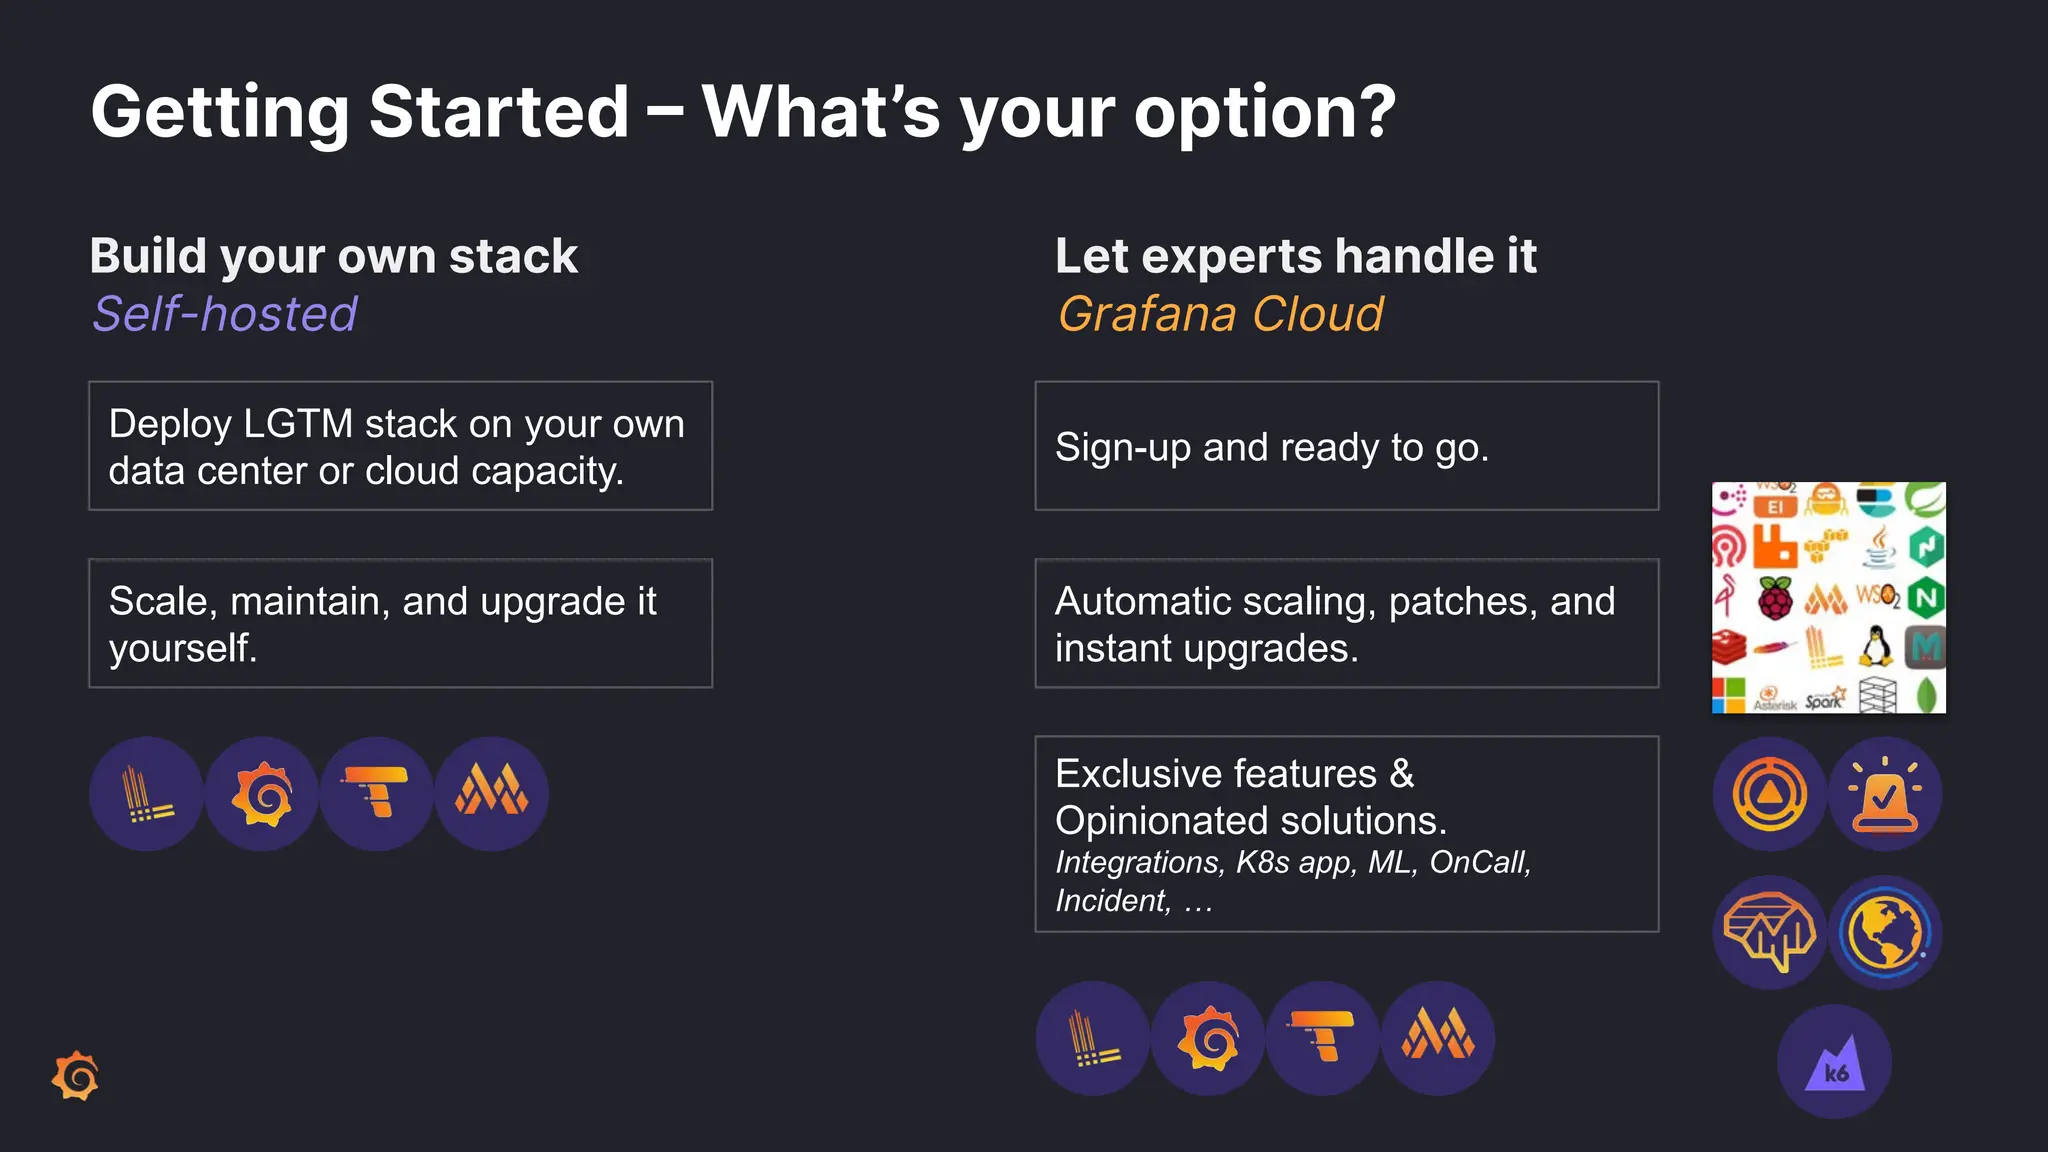
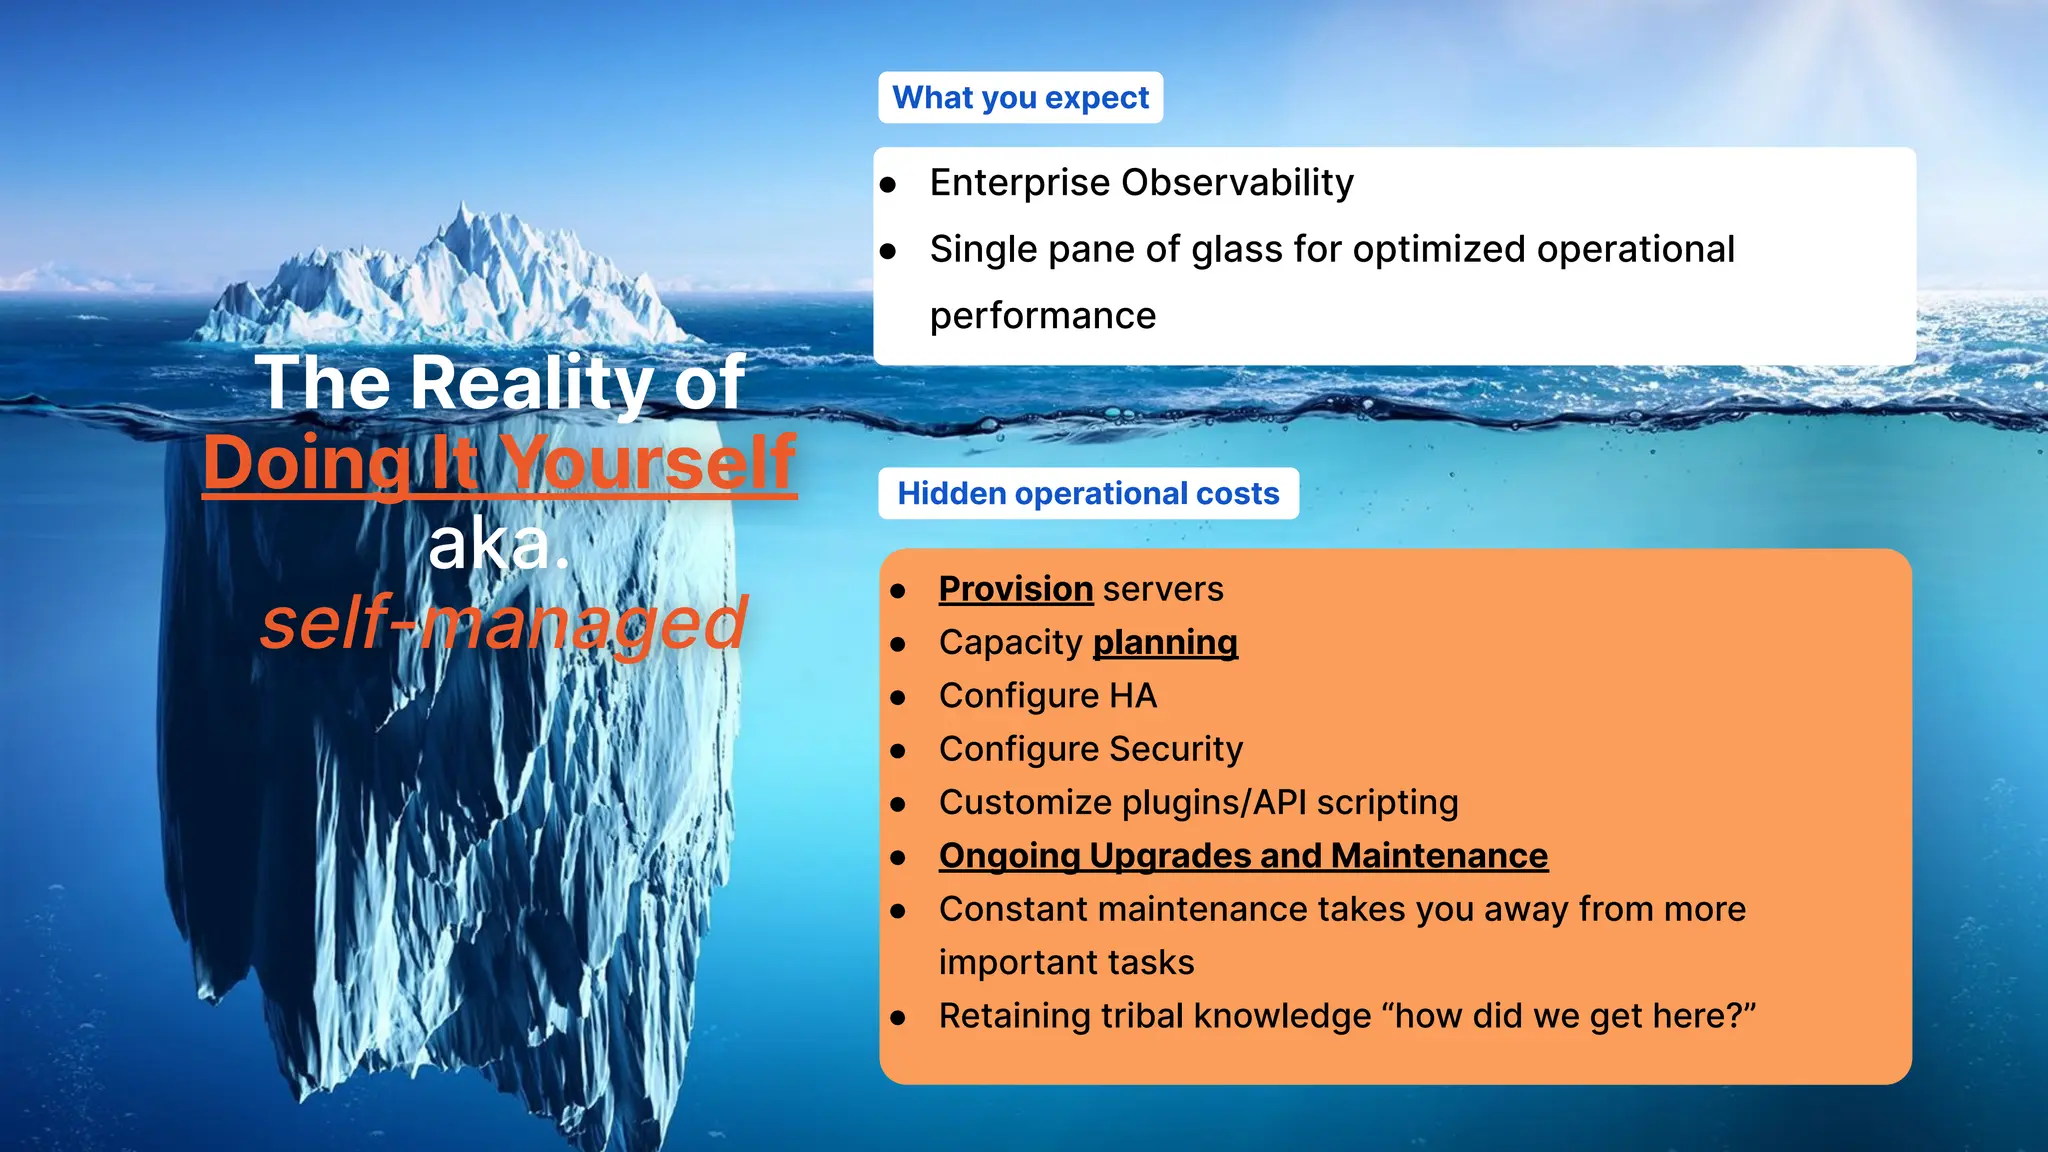
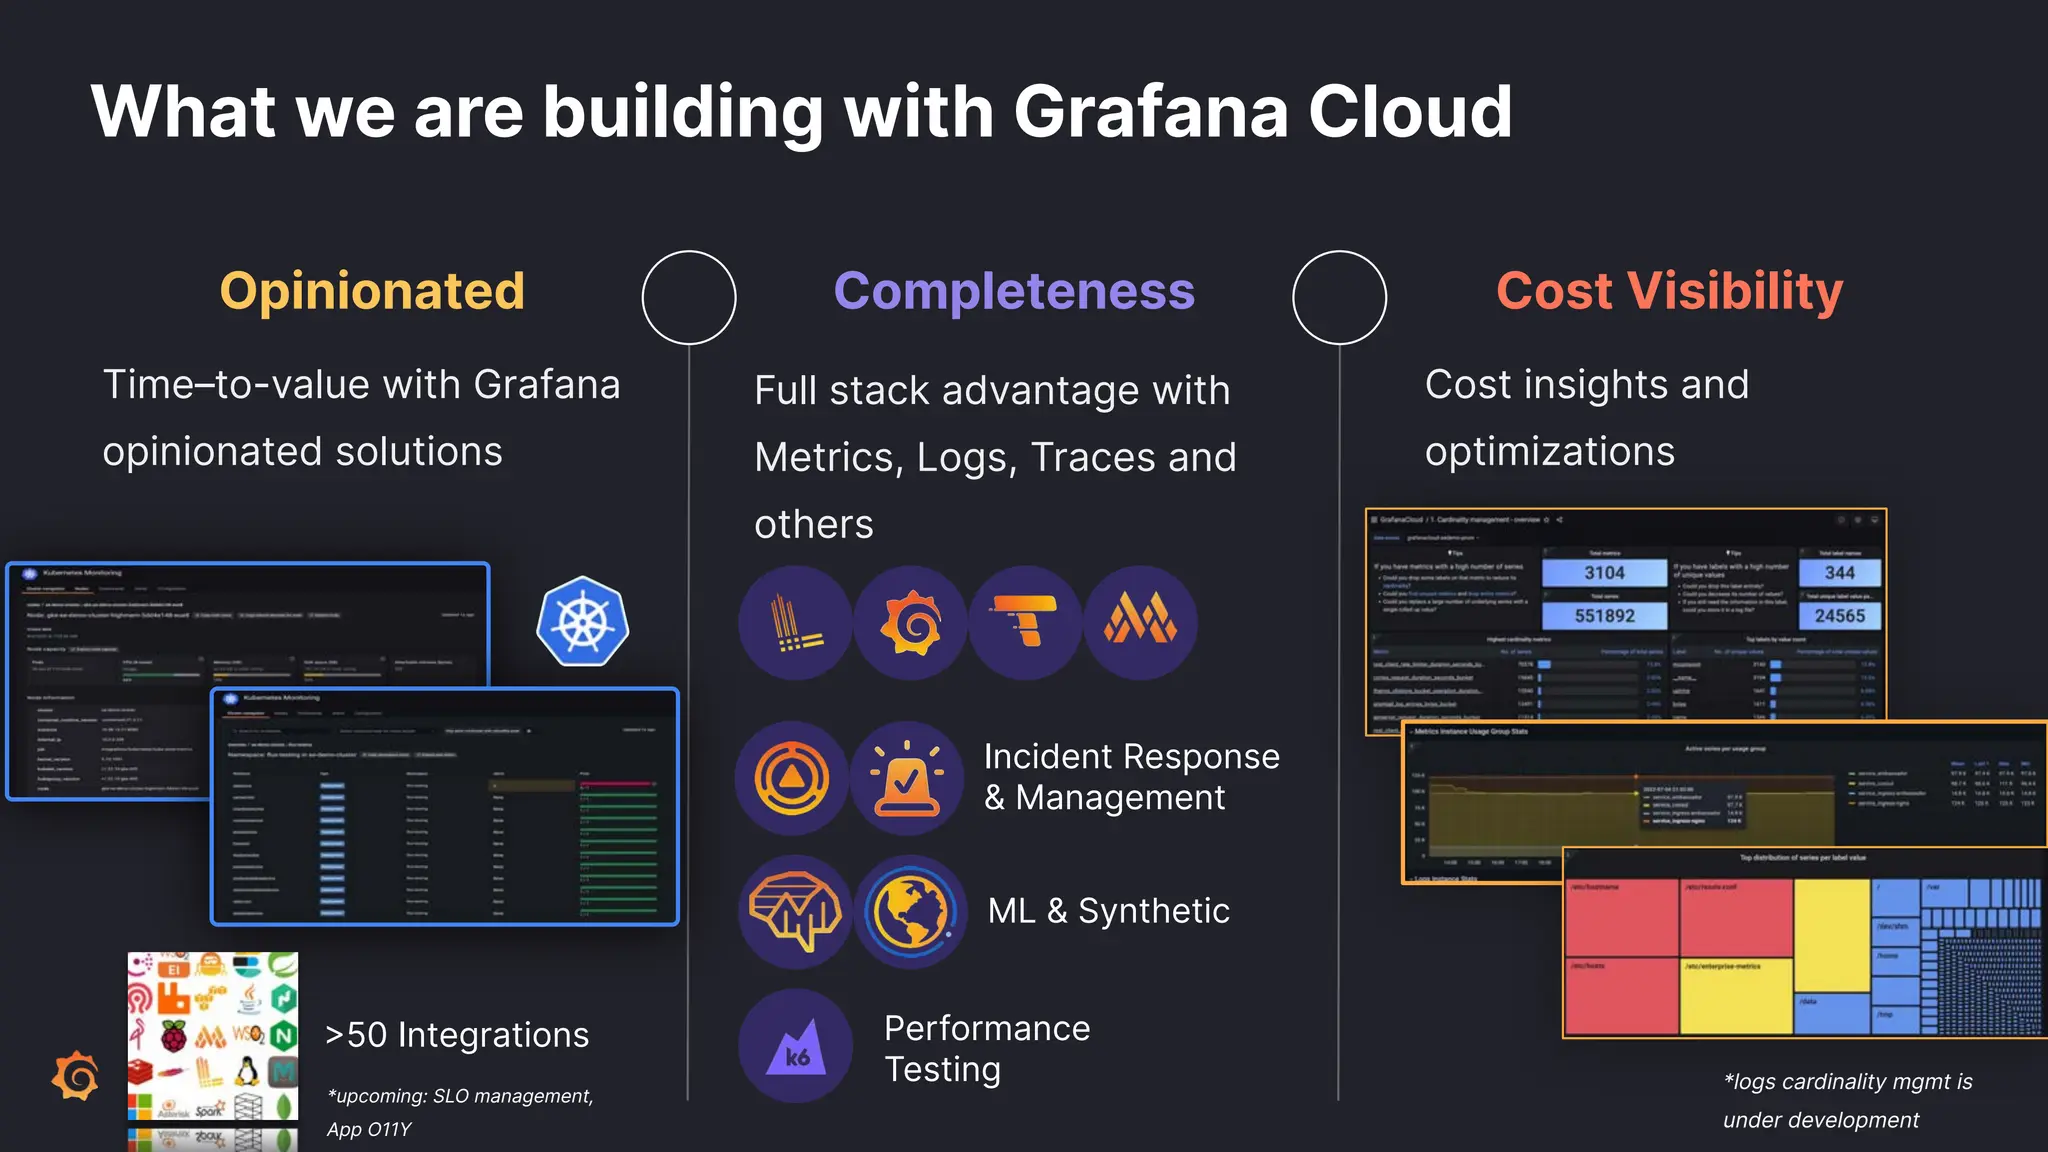
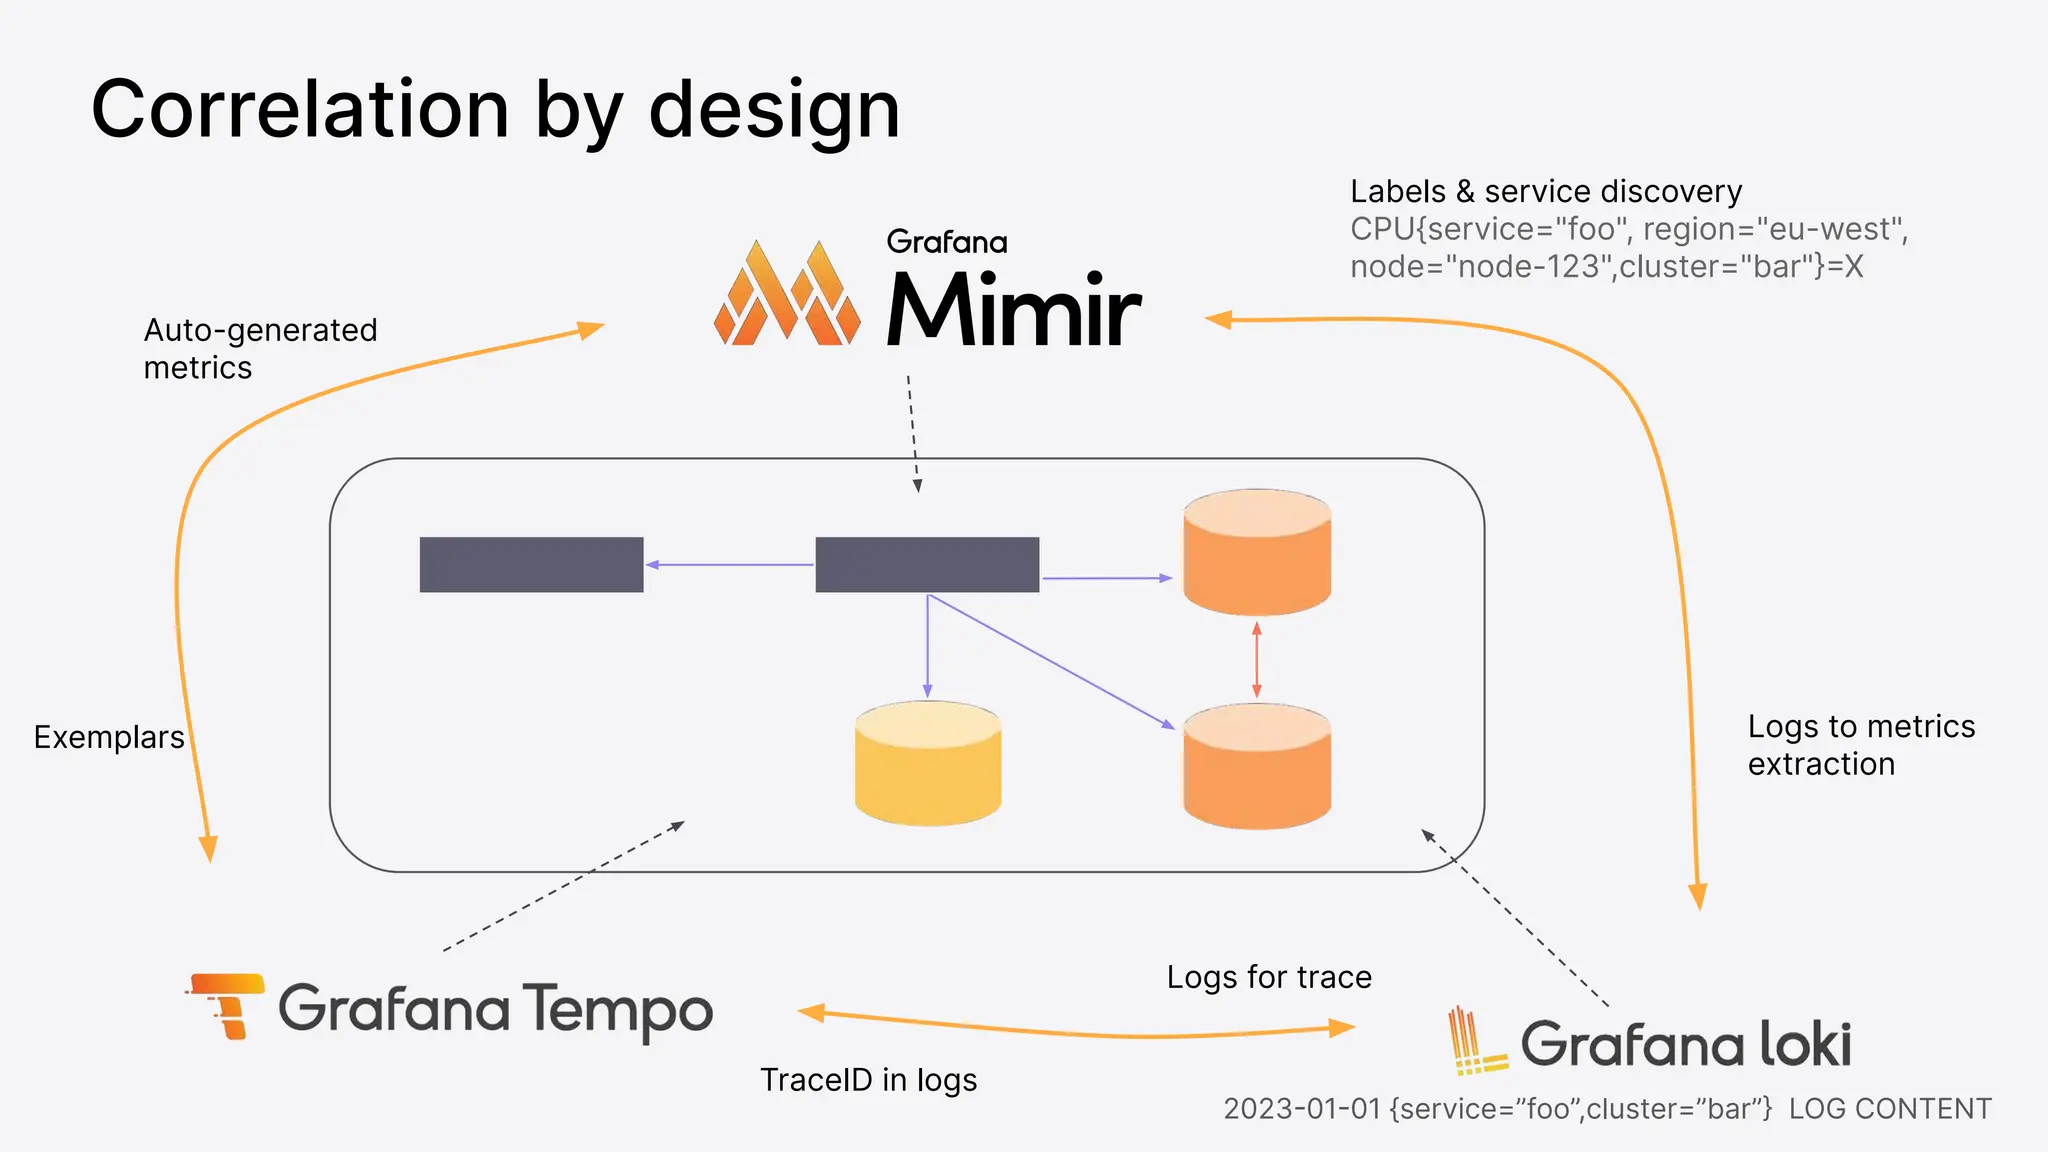
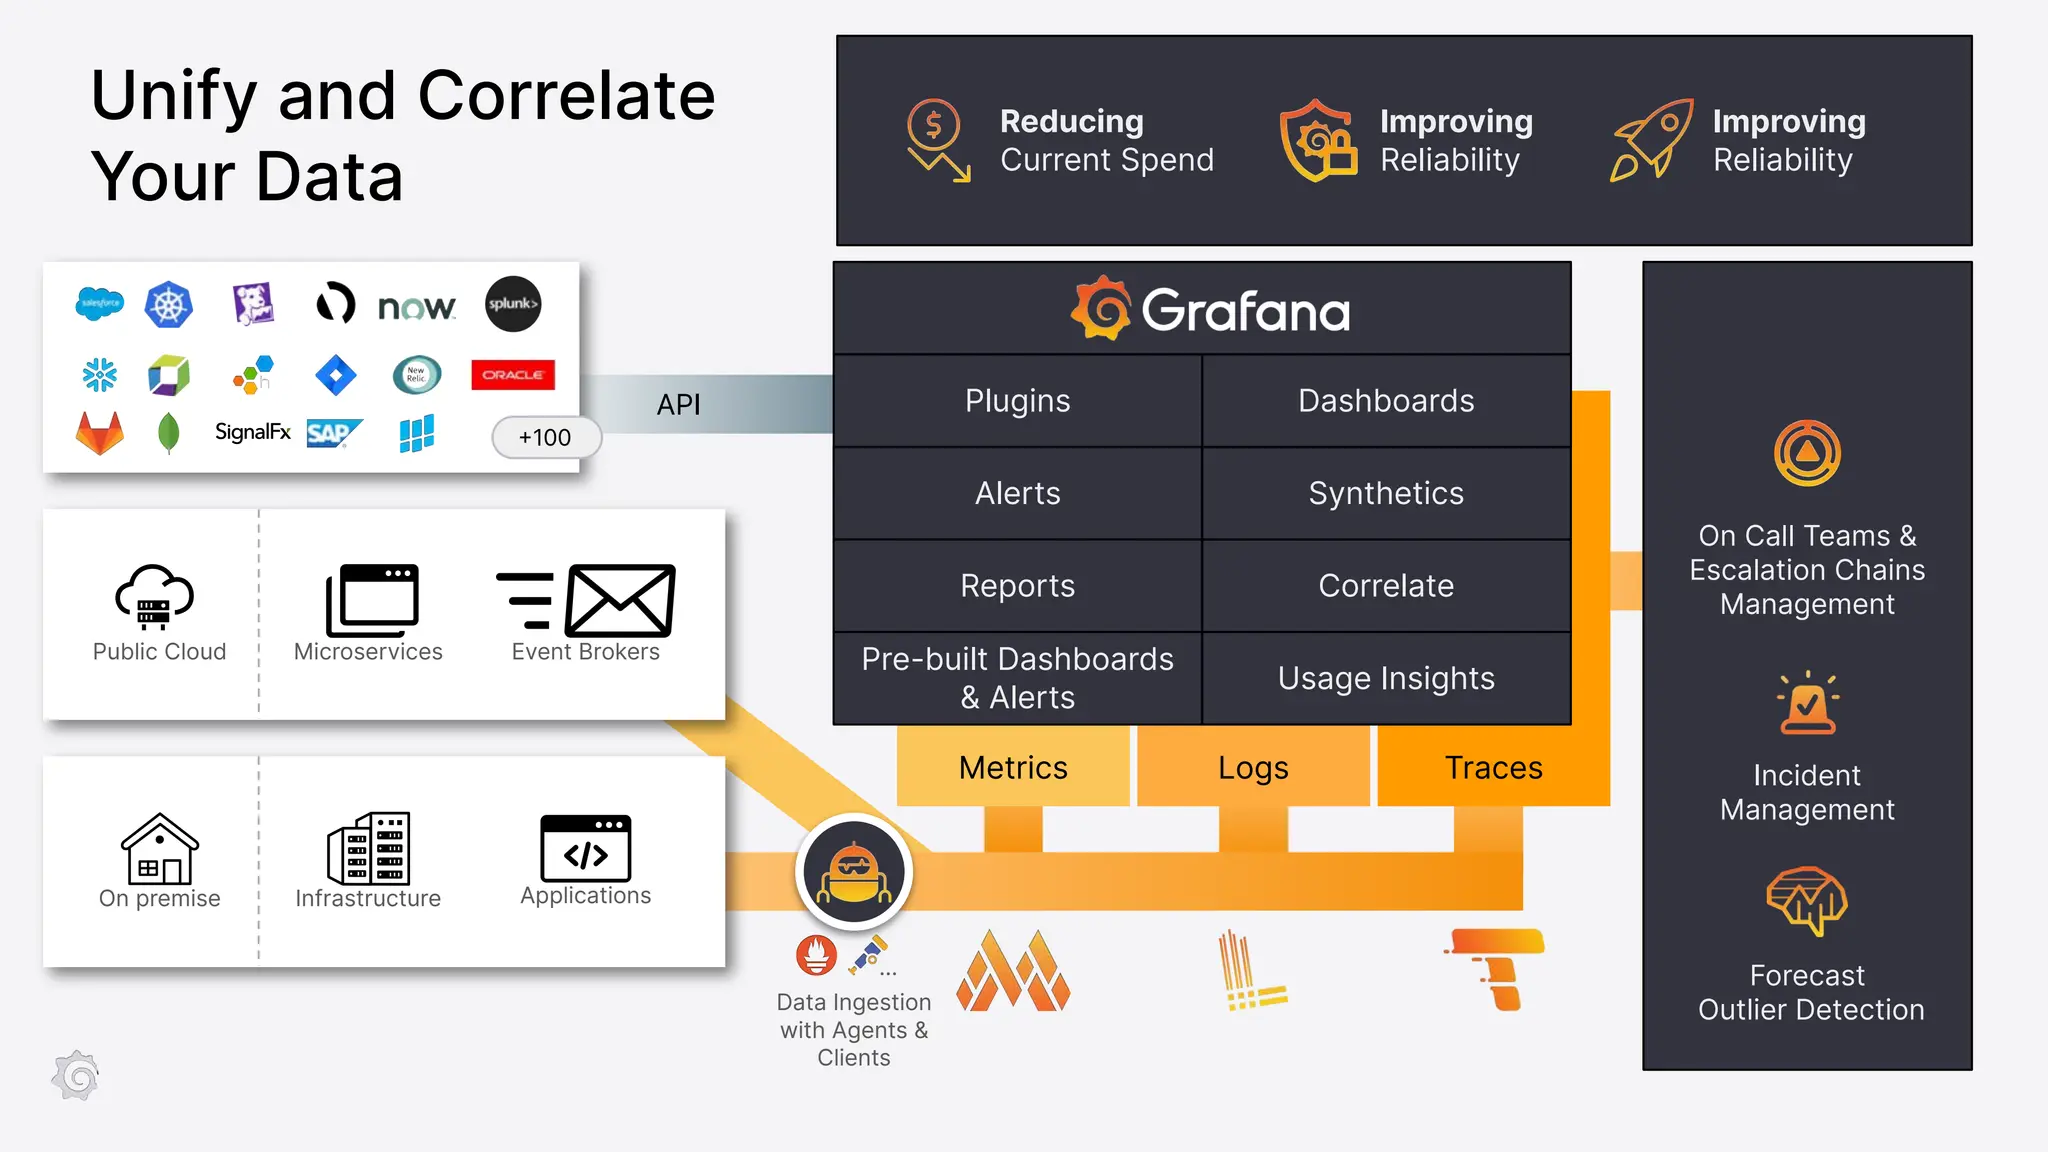
4. First Pane of Glass & Collaboration through “Big Tent”
The 10000-foot view
For who? C-level and executives
For what? Centralised view of your most critical KPIs (costs, incidents, etc) and global health of the
system
The Platform view
For who? Platform owners and Ops team
For what? Visualise individual SLOs/SLIs and detect which component of the platform
is impacting your SLA
The Service view
For who? SREs and DevOps
For what? Monitor key signals for a specific service, and start your
exploration/debugging/troubleshooting workflow.
5. Open source is at the heart of what we do
Employ 91% of the
Loki team
members, including
project founders
Employ 89% of
Grafana team
members, including
project founders
Employ 100% of
the Tempo team
members, including
project founders
Employ 100% of
the Mimir team
members, including
project founders
Employ 100% of k6
team members,
including the project
founders
Employ 44% of the
Prometheus team
members
The leading
contributors to the
Graphite project
Employ contributors,
including a
Governance
Committee member
Employ 100% of
OnCall team
members, including
the project
founders
1,000+ Employees across
40+ countries 10M+ Users across OSS
and Cloud Free tier
Employ 100% of
Phlare team
members, including
the project
founders
Employ 100% of
Faro team
members, including
the project
founders
1M+
Instances across
LGTM Cloud and
OSS
6. What We Built : A Composable Observability Stack
OSS / Cloud / Enterprise
Observability-as-code
Open APIs + Webhooks + Terraform, Ansible
Security + Scale + Support
OnCall Incident
SLO Alerting
Visualize
Business, Application, and Infrastructure
Prevent
Performance Testing
Load Testing Metrics Logs Traces
Enterprise Plugins
+100s more
Community Plugins
Find
Telemetry
Act
Incident Response & Management
Browser Testing Profiles
10. Grafana Agent – Make your pipeline easy
Metrics - Based on Prometheus Agent with
embedded exporters.
Logs - Embeds Promtail, the log forwarder
built by Grafana, for Loki.
Traces - Based on Open Telemetry
Collector.
Universal | Feature-rich | Open
16. Getting Started – What’s your option?
Build your own stack
Self-hosted
Let experts handle it
Grafana Cloud
Deploy LGTM stack on your own
data center or cloud capacity.
Scale, maintain, and upgrade it
yourself.
Automatic scaling, patches, and
instant upgrades.
Sign-up and ready to go.
Exclusive features &
Opinionated solutions.
Integrations, K8s app, ML, OnCall,
Incident, …
17. The Reality of
Doing It Yourself
aka.
self-managed
What you expect
Hidden operational costs
● Enterprise Observability
● Single pane of glass for optimized operational
performance
● Provision servers
● Capacity planning
● Configure HA
● Configure Security
● Customize plugins/API scripting
● Ongoing Upgrades and Maintenance
● Constant maintenance takes you away from more
important tasks
● Retaining tribal knowledge “how did we get here?”
18. What we are building with Grafana Cloud
Opinionated Completeness Cost Visibility
Time–to-value with Grafana
opinionated solutions
Cost insights and
optimizations
Full stack advantage with
Metrics, Logs, Traces and
others
*logs cardinality mgmt is
under development
Incident Response
& Management
ML & Synthetic
Performance
Testing
>50 Integrations
*upcoming: SLO management,
App O11Y
23. Grafana ML
Produce high-quality forecasts and adaptive
alerts
✓ Prediction results are built from standard queries and results are exposed
via PromQL.
✓ Users can be alerted when observed values differ from prediction. Dynamic
threshold can be set based on prediction confidence.
Detect anomalies in real-time
✓ Identify abnormal patterns using outliers detector.
✓ Alert your users instantaneously when outliers are detected.
Support various data sources
✓ Currently supported: Prometheus, Loki, Postgres, InfluxDB, BigQuery,
Snowflake and Datadog.
24. Correlation by design
Exemplars
Labels & service discovery
CPU{service="foo", region="eu-west",
node="node-123",cluster="bar"}=X
Auto-generated
metrics
Logs for trace
TraceID in logs
Logs to metrics
extraction
2023-01-01 {service=”foo”,cluster=”bar”} LOG CONTENT
25. API
Logs Traces
Metrics
Alerts Synthetics
Reports Correlate
Pre-built Dashboards
& Alerts
Usage Insights
+100
On Call Teams &
Escalation Chains
Management
Incident
Management
Forecast
Outlier Detection
On premise
Public Cloud Microservices
Infrastructure Applications
Event Brokers
Dashboards
Plugins
…
Data Ingestion
with Agents &
Clients
Reducing
Current Spend
Improving
Reliability
Improving
Reliability
Unify and Correlate
Your Data
28. Run at any scale
Grafana Mimir can virtually scale to infinity
We have scaled it to reach 1 billion active series with a 20 second scrape
Learn more: https://grafana.com/blog/2022/04/08/how-we-scaled-our-new-prometheus-tsdb-grafana-mimir-to-1-billion-active-series/
30. 10TB 200MB
Log Data Index
Think of it more like a table of contents than an index
Loki does not index the text of logs. Instead, entries are grouped into
streams and indexed with Prometheus-style labels.
Efficient logging
31. 1PB 80TB
Raw Logs Timeframe Brute force
search - heavily
parallelized
Label selector
1TB 120GB+/s
Fast queries
{ cluster=”us-central1”,
job=~”nginx*” }
|= “needle in
the haystack”
32. The better tradeoff
● Log any and all formats
● Smaller indexes
● Cost effective resource usage
● Fast enough queries for SRE
● Cut and slice your logs in dynamic ways - ask
new questions
Grafana Loki
Query time processing
VS
● Decide on log formats aka “common scheme”
● Large indexes
● More expensive to run
● Faster queries
● Restricted to format chosen at ingestion time
Content indexing
Upfront / ingest time processing
33. Incident response process
Grafana Alerting (WHAT)
- Configure alerts on
metrics
Grafana OnCall (WHO)
- Schedules
- Escalation policies
- Notifications to wake
you up
Grafana Incident (WHY)
- Declare incident
- Assign roles
- Manage tasks
- Put the fire out
34. Grafana Incident Response is unified and integrated
Grafana Alerting Grafana OnCall Grafana Incident
35. Grafana OnCall is a new on-call management tool that’s available in Grafana Cloud.
36. About Grafana k6
● k6 is a load and performance
testing tool including k6 OSS and
k6 Cloud
● Leader in modern load testing of
APIs, microservices, and websites
● Joined the Grafana Labs family in
June 2021
● Shift testing and observability left
Pre-production
(proactive)
Production
(reactive)
Virtual User
traffic
Real User
traffic
Prod
Pre-prod
Software Development Life Cycle
37. What use cases does k6 cover ?
Primary Use Cases Secondary Use Cases
Load Testing
k6 is optimized for minimal resource consumption and
designed for running high load tests (spike, stress, soak
tests).
K6 is used to test the performance and reliability of
APIs, microservices, and websites.
Specifically this means you can:
- Load test your backends - APIs and
microservices.
- Get a complete view of your website user
experience. With xk6-browser (beta), users can
mix backend load testing and frontend browser
testing in the same script for end-to-end website
testing.
Chaos Testing/Failure Injection Testing
k6 can be used as part of chaos experiments. Chaos
engineering is mostly done in a pre-production
environment or production during quiet traffic. It means
that you need a load testing tool to simulate real traffic
during chaos experiments.
Synthetic Monitoring
With k6, you could run tests with a small amount of load
to continuously validate the performance and availability
of your production environment.
38. Modern teams are shifting performance testing left
Testing frequency
Release frequency
What to test
How is performance testing
done
Who is responsible for
performance testing
OLD WAY
Quarterly or biannually
QA
User stories, high-risk components
Manually
Before releases
NEW WAY
Weekly
Developers, QA/SDET, SRE
Continuously: nightly, in feature branches,
when infra changes, before releases, in prod
User stories, high-risk components, services,
infrastructure, unexpected failures
Automatically as part of CI/CD