Download to read offline


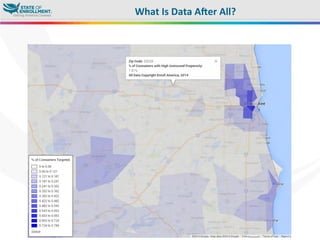
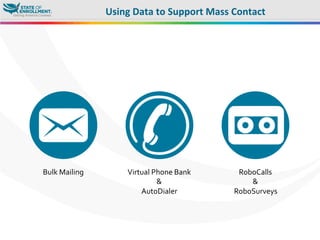
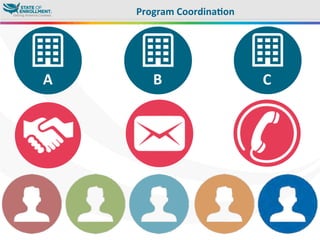
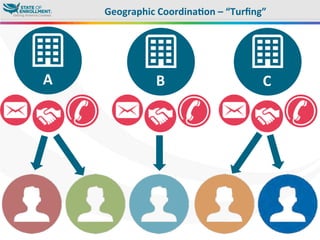
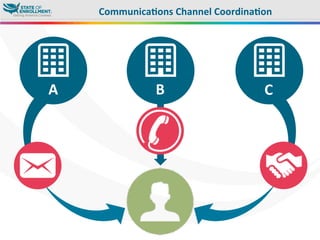

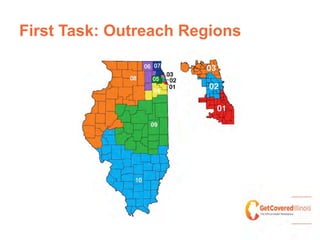

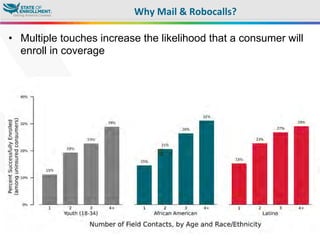
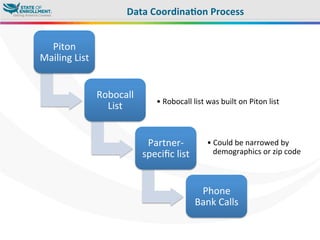

The document discusses how data was used to coordinate outreach efforts between partner organizations in Colorado during the Affordable Care Act enrollment period. Data sharing allowed partners to avoid duplicating outreach to the same consumers by assigning "turfs" or geographic areas to different organizations. A direct mail campaign and follow up robocalls were used to conduct outreach across multiple partner turfs, with the mailing list and robocall data shared between partners to facilitate referrals and follow up outreach. Tracking consumer interactions in a shared database allowed effective coordination and referral of consumers between outreach and enrollment assistance organizations.


