Downloaded 14 times
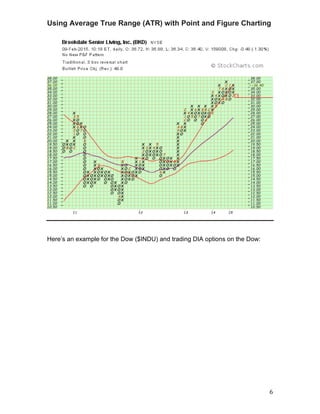
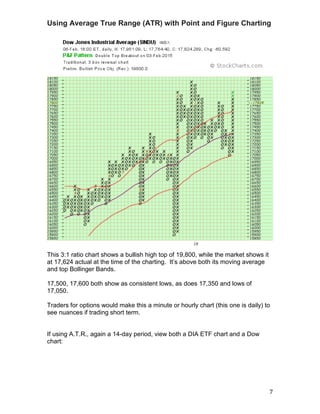
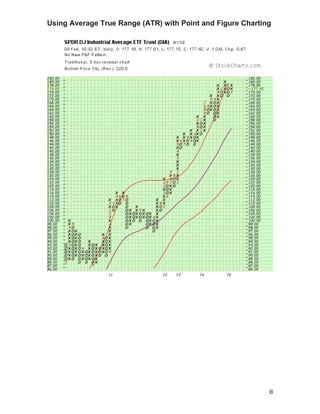
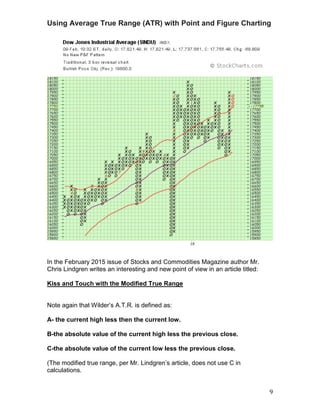

Using Average True Range (ATR) with Point and Figure Charting J. Welles Wilder developed the Average True Range (ATR) indicator to measure volatility over a specific period. The document discusses using ATR with Point and Figure charting to identify potential highs and lows, calculate stop losses, and project price targets. It provides examples analyzing stocks like BKD and BA using this method, noting support/resistance levels and calculating ATR values. The author advocates a 20-day ATR period and 5.53x multiplier for defining stops and projections.