This document is the thesis submitted by Trystan Upstill for the degree of Bachelor of Information Technology (Honours) at the Australian National University in November 2000. It discusses the development of a new approach to image retrieval on the World Wide Web that addresses consistency, clarity, and control. The thesis surveys existing image retrieval techniques, identifies problems in current WWW image search systems, and then presents a novel WWW image retrieval approach called VISR that incorporates client-side image analysis, visualization of results, and an interactive interface. Experiments show that VISR offers improvements over other systems by providing more consistent analysis and visualization, clearer explanations for returned image matches, and greater user control through more expressive queries and enhanced interaction capabilities.


![Chapter 1
Introduction
“What information consumes is rather obvious: it consumes the attention of its
recipients. Hence a wealth of information creates a poverty of attention, and a
need to allocate that attention efficiently among the overabundance of information
sources that might consume it.”
– H.A Simon
1.1 Motivation
Recently, there has been a huge increase in the number of images available on-line.
This can be attributed, in part, to the popularity of digital imaging technologies and
the growing importance of the World-Wide Web in today’s society. The WWW pro-
vides a platform for users to share millions of files with a global audience. Further-
more, digital imaging is becoming widespread through burgeoning consumer usage
of digital cameras, scanners and clip-art libraries [16]. As a consequence of these de-
velopments, there has been a surge of interest in new methods for the archiving and
retrieval of digital images.
While retrieving text documents presents its own problems, finding and retrieving
images adds a layer of complexity. The image retrieval process is hindered by dif-
ficulties involved with image description. When outlining image needs, users may
provide subjective, associative1 or incomplete descriptions. For example figure 1.1
may be described objectively as “a cat”, or “a cat with a bird on its head”. It could be
described bibliographically, as “Paul Klee”, the painter. Alternatively, it could be de-
scribed subjectively as “a happy colourful picture” or “a naughty cat”. It could also be
described associatively as “find the bird” or “the new cat-food commercial”. Each of
these queries arguably provide equally valid image descriptions. However, generally
Web page authors, when describing images, provide just a few of the permutations
describing image content.
1
describing an action portrayed by the image, rather than image content
1](https://image.slidesharecdn.com/721d17e9-3997-45df-83d5-6fd470fa9d7d-150913155104-lva1-app6891/85/Upstill_thesis_2000-13-320.jpg)
![2 Introduction
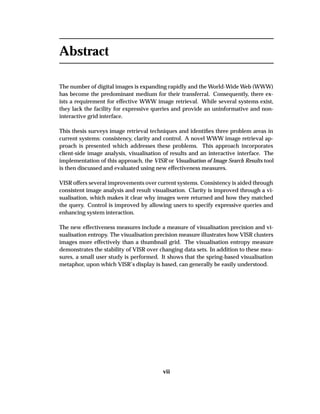
Figure 1.1: Example Image: “cat and bird” by Paul Klee.
Current commercial WWW image search engines provide a limited facility for image
retrieval. These engines are based on existing document retrieval infrastructure, with
minor modifications to the underlying architecture. An example of a current approach
to WWW image retrieval is the AltaVista [3] image search engine. AltaVista incorpo-
rates a text-based image search, allowing users to enter textual criteria for an image.
The retrieved results are then displayed in a thumbnail grid as shown in figure 1.2.
However, there is scope for improvement. Current WWW image retrieval systems
are limited to using textual descriptions of image content to retrieve images, with no
capabilities for retrieving images using visual features. Further, the image search re-
sults are presented in an uninformative and non-interactive thumbnail grid.
Figure 1.2: Altavista example grid. For the query “Trystan Upstill”.](https://image.slidesharecdn.com/721d17e9-3997-45df-83d5-6fd470fa9d7d-150913155104-lva1-app6891/85/Upstill_thesis_2000-14-320.jpg)
![Chapter 2
Domain
“To look backward for a while is to refresh the eye, to restore it, and to render it
more fit for its prime function of looking forward. ”
– Margaret Fairless Barber
2.1 Overview
This dissertation is based in the domain of information retrieval. The process of com-
puter based information retrieval is complex and has been the focus of much research
over the last 50 years. This chapter contains a summary of this research as it relates to
this thesis, and a conceptual framework for the analysis of the information retrieval
process.
2.2 Glossary of Terms
document: any form of stored encapsulated data.
user: a person wishing to retrieve documents.
expert user: a professional information retriever wishing to retrieve documents (e.g.
a librarian).
visualisation: is the process of representing data graphically.
Information Visualisation: is the visualisation of document information.
cognitive process: is thinking or conscious mental processing in a user. It relates
specifically to our ability to think, learn and comprehend.
information need: the requirement to find information in response to a current prob-
lem [35].
query: an articulation of an information need [35].
Information Retrieval: the process of finding and presenting documents deduced
from a query.
5](https://image.slidesharecdn.com/721d17e9-3997-45df-83d5-6fd470fa9d7d-150913155104-lva1-app6891/85/Upstill_thesis_2000-17-320.jpg)
![6 Domain
relevance: user’s judgement of satisfaction of an information need.
match: system concept of document-query similarity.
professional description: a well described document, with thorough, complete and
correct textual meta-data.
layperson description: a non-professionally described document, potentially sub-
jective, incomplete or incorrect, this can be attributed to a lack of knowledge of
the retrieval process.
Information Foraging: a theory developed to understand the usage of strategies
and technologies for information seeking, gathering, and consumption in a fluid
information environment [51]. See section 2.9.1 for a concrete description.
recall: is the proportion of all relevant documents that are retrieved.
precision: is the proportion of all documents retrieved that are relevant.
clustering: is partitioning data into a number of groups in which each group collects
together elements with similar properties [18].
image: a document containing visual information.
image data: is the actual image.
image meta-data: is text which is associated with an image.
2.3 Information Retrieval
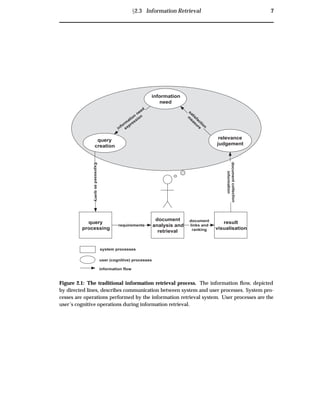
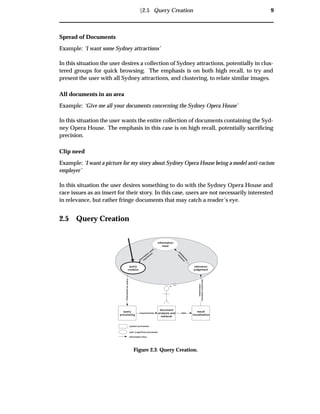
This thesis’ depiction of the traditional information retrieval model is given in figure 2.1.
In the initial stage of the retrieval process, the user has some information need. The user
then formalises this information need, through query creation. The query is submitted
to the system for query processing, where it is parsed by the system to deduce the doc-
ument requirements. Document index analysis and retrieval then begins, with the goal
of retrieving documents of relevance to the query. The documents are subsequently
presented to the user in a result visualisation, aiming to facilitate user identification of
relevant documents. The user then performs a relevance judgment as to whether the
retrieved document collection contains relevant documents. If the user’s information
need is satisfied, the retrieval process is finished. Conversely, if the user is not satis-
fied with the retrieved document collection, they may refine their original information
need, and the entire process is re-executed.](https://image.slidesharecdn.com/721d17e9-3997-45df-83d5-6fd470fa9d7d-150913155104-lva1-app6891/85/Upstill_thesis_2000-18-320.jpg)
![8 Domain
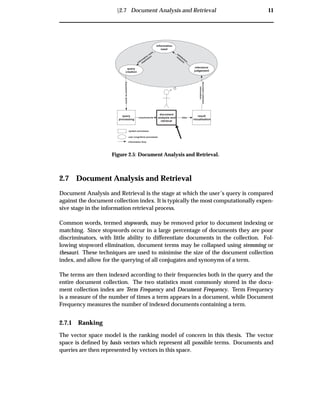
2.4 Information Need
query
processing
document
analysis and
retrieval
result
visualisation
information
need
Expressedasquery
relevance
judgement
documentcollection
information
datarequirements
system processes
user (cognitive) processes
information flow
query
creation
satisfaction
m
easureinform
ation
need
expression
Figure 2.2: Information Need Analysis.
An information need occurs when a user desires information. To characterise poten-
tial information needs, we must appreciate why users are searching for documents,
what use they are making of these documents and how they make decisions on which
documents are relevant [16].
This thesis identifies several example information needs:
Specific need (answer or document): where one result will do.
Spread of documents: a collection of documents related to a specific purpose.
All documents in an area: a collection of all documents that match the criteria.
Clip need: a less specific need, where users desire a document that somehow relates
to a passage of text.
Specific needs
Example: ‘I want a map of Sydney’
In this situation a single comprehensive map of Sydney will do. If the retrieval en-
gine is accurate, the first document will fulfill the information need. Therefore, the
emphasis is on having the correct answer as the first retrieved result — high precision
at position 1.](https://image.slidesharecdn.com/721d17e9-3997-45df-83d5-6fd470fa9d7d-150913155104-lva1-app6891/85/Upstill_thesis_2000-20-320.jpg)
![10 Domain
Following the formation of an information need, the user must express this need as a
query. A query may contain several query terms, where each term represents criteria
for the target documents. Web search engine users generally do not provide detailed
queries, with average queries containing 2.4 terms [30].
If a user is looking for documents regarding petroleum refining on the Falkland Is-
lands, they may express their information need as:
Falkland Islands petrol
While an expert user may have a better understanding of how the retrieval system
works and thus express their query as:
+“Falkland Islands” petroleum oil refining
The query processing must take these factors into account and cater to both groups of
users.
2.6 Query Processing
query
processing
document
analysis and
retrieval
result
visualisation
information
need
Expressedasquery
relevance
judgement
documentcollection
information
datarequirements
system processes
user (cognitive) processes
information flow
query
creation
satisfaction
m
easure
inform
ation
need
expression
Figure 2.4: Query Processing.
System query processing is the parsing and encoding of a user’s query into a system-
compatible form. At this stage, common words may be stripped out and the query
expanded, adding term synonyms.](https://image.slidesharecdn.com/721d17e9-3997-45df-83d5-6fd470fa9d7d-150913155104-lva1-app6891/85/Upstill_thesis_2000-22-320.jpg)
![12 Domain
For example, if we have three very short documents:
Document 1: ‘Robot dogs’
Document 2: ‘Robot dog ankle-biting’
Document 3: ‘Subdued robot dogs’
Using the basis vectors:
‘Robot dog’ [1, 0, 0]
‘ankle-biting’ [0, 1, 0]
‘Subdued’ [0, 0, 1]
We can create three document vectors weighted by term frequency:
Document 1 = [1, 0, 0]
Document 2 = [1, 1, 0]
Document 3 = [1, 0, 1]
The vector space for these documents is depicted in figure 2.6.
robot dog
ankle-biting
subdued
document 1
docum
ent 2
docum
ent 3
Figure 2.6: Unweighted Vector Space. Since document 1 only contains “robot dog”, its vector
lies on the “robot dog” axes. Document 2 contains both “robot dog” and “ankle-biting”, as
such its vector lies between those axes. Document 3 contains “subdued” and “robot dog”, its
vector lies between those axes.
The alternative TF/DF weighting of the vectors space is:
Document 1 = [1/3, 0 , 0]
Document 2 = [1/3, 1/1, 0]
Document 3 = [1/3, 0 , 1/1]](https://image.slidesharecdn.com/721d17e9-3997-45df-83d5-6fd470fa9d7d-150913155104-lva1-app6891/85/Upstill_thesis_2000-24-320.jpg)
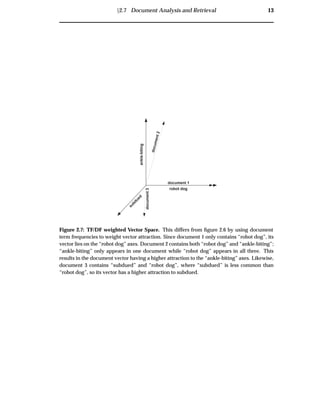
![14 Domain
The TF/DF weighted vector space for these documents is depicted in figure 2.7.
In the vector space model, document similarity is measured by calculating the degree
of separation between documents. The degree of separation is measured by calculat-
ing the angle difference, usually using the cosine rule. In these calculations a smaller
angle implies a higher degree of relevance. As such, similar documents are co-located
in the space, as shown in figure 2.8. Conceptually this leads to a clustering of inter-
related documents in the vector space [55].
document 3
sourcedocument
document1
document 2
basis vector 1
basisvector2
Figure 2.8: Vector Space Document Similarity Ranking. The vector space model implies that
document 1 is the most similar to the source document, while document 2 is the next most
similar, and document 3 the least. When querying a vector space model, the query becomes
the source document vector and documents with similar vectors are retrieved.
It is also possible not to generate basis vectors directly from all unique document
terms. Documents can be indexed according to a small number of basis vectors. This
is an application of synonym matching, but where partial synonyms are admitted. An
example of this is to index document 2 on the basis vectors ‘Irritating’ and ‘Friendly’,
as is depicted in figure 2.9.
One of the difficulties involved in vector space ranking is that it can be unclear which
terms matched the document and the extent of the matching. In image retrieval this
drawback, combined with the fact that images are associated with potentially arbi-
trary text, can lead to user confusion regarding why images were retrieved, see section 3.2.1.](https://image.slidesharecdn.com/721d17e9-3997-45df-83d5-6fd470fa9d7d-150913155104-lva1-app6891/85/Upstill_thesis_2000-26-320.jpg)
![Ü2.8 Result Visualisation 15
Friendly
Irritating
"robot dog"
ankle-biting
document2
Figure 2.9: Vector Space with basis vectors ‘Friendly’ and ‘Irritating’. In the example in
figure 2.9, prior to the ranking we know that “robot dog”s are moderately friendly and ankle-
biting is extremely irritating. Query terms are ranked in the vector space against partial syn-
onyms.
Other Models
Other models, which are not within the scope of this thesis are thoroughly described
in general information retrieval literature [55, 5, 20, 35]. These include Boolean, Ex-
tended Boolean and Probabilistic models.
2.8 Result Visualisation
Result visualisation in information retrieval is often overlooked in favour of improv-
ing document analysis and retrieval techniques. It is, however, an integral part of the
information retrieval process [7]. Information retrieval systems typically use linear list
result visualisations.
2.8.1 Linear Lists and Thumbnail Grids
Linear lists present a sorted list of retrieved documents ranked from most to least
matching. Thumbnail grids are often used for viewing retrieved image collections.
Thumbnail grids are linear lists split horizontally between rows, a process which is
analogous to words wrapping on a page of text . This representation is used to max-
imise screen real-estate. Images positioned horizontally next to each other are adjacent
in the ranking, while vertically adjacent images are separated by N ranks (where N
is the width of the grid). Thus, although the grid is a two dimensional construct,
thumbnail grids only represent a single dimension — the system’s ranking of images.](https://image.slidesharecdn.com/721d17e9-3997-45df-83d5-6fd470fa9d7d-150913155104-lva1-app6891/85/Upstill_thesis_2000-27-320.jpg)
![16 Domain
query
processing
document
analysis and
retrieval
result
visualisation
information
need
Expressedasquery
relevance
judgement
documentcollection
information
datarequirements
system processes
user (cognitive) processes
information flow
query
creation
satisfaction
m
easure
inform
ation
need
expression
Figure 2.10: Result Visualisation.
Later it is shown that having no relationship between sequential images, and no query
transparency causes problems in current image retrieval systems 3.2.1.
To further maximise screen real-estate, zooming image browsers can be used. Combs
and Bederson’s [12] zooming image browser incorporates a thumbnail grid with a
large number of images at a low resolution. Users select interesting areas of the grid
and zoom in to find relevant images. The zooming image browser did not outperform
other image browsers in evaluation. Frequently users selected incorrect images at the
highest level of zoom. Users were not prepared to zoom in to verify selections and
incur a zooming time penalty.
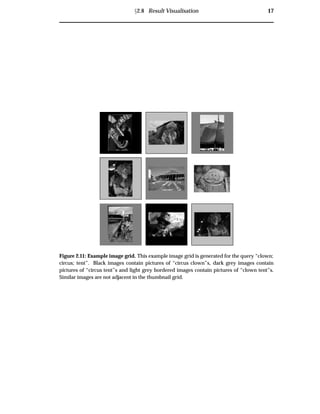
When using a vector space model with a thumbnail grid visualisation, vector evidence
is discarded. Figure 2.11 depicts a hypothetical thumbnail grid retrieved by an image
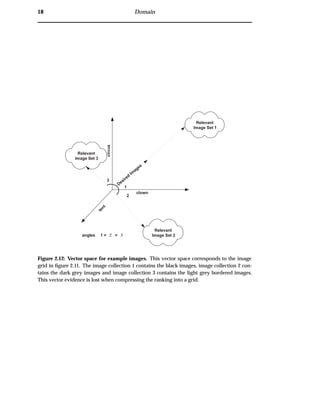
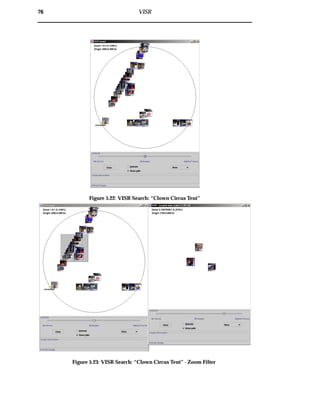
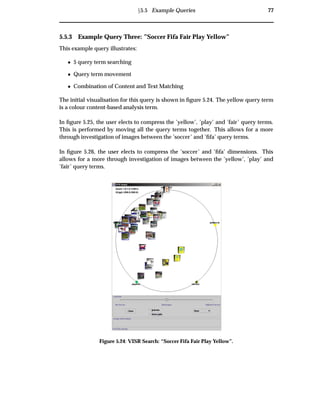
retrieval engine for the query “clown, circus, tent”. In this grid, black images are pic-
tures of “circus clown”s, dark grey images are pictures of “circus tent”s and light grey
images with borders are pictures of “clown tent”s. Figure 2.12 depicts the vector space
from which the images were taken. There are three clusters, each containing multiple
images, located at angles of equal distance from the query vector. When compressing
this evidence the ranking algorithm selects images in order of their proximity until
the linear list is full. This discards image vector details, and leads to a thumbnail grid
where similar images are not adjacent.](https://image.slidesharecdn.com/721d17e9-3997-45df-83d5-6fd470fa9d7d-150913155104-lva1-app6891/85/Upstill_thesis_2000-28-320.jpg)
![Ü2.8 Result Visualisation 19
2.8.1.1 Image Representation
Humans process objects and shapes at a much greater speed than text. Exploitation
of this capability can facilitate the identification of relevant images. Further, when
presenting images for inspection there is no substitute for the images themselves. As
such, it is important, when using an information visualisation for image search results,
to summarise images using their thumbnails.
2.8.2 Information Visualisations
Information visualisations are intended to strengthen the relationship between the
user and the system during the information retrieval process. They attempt to over-
come the limitations of linear rankings by providing further attributes to facilitate user
determination of relevant documents.
As cited by Stuart Card in 1996, ‘If Information access is a “killer app” for the 1990s [and
2000s] Information Visualisation will play an important role in its success”.
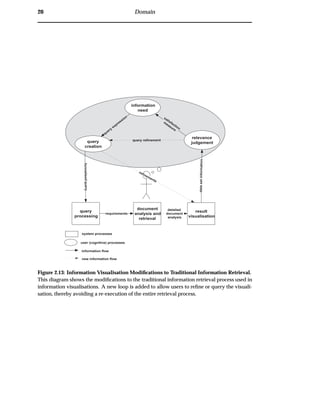
The traditional information retrieval process model, figure 2.1, is revised for informa-
tion visualisation. The model of information retrieval adapted for information visu-
alisation, is shown in figure 2.13. This model creates a new loop between the result
visualisation, relevance judgement and query creation. This enables users to swiftly
refine their query and receive immediate feedback from the result visualisation. This
new interaction loop can provide improved clarity and system-user interaction during
searching.
Displaying Multi-dimensional data
When representing multi-dimensional data, such as search results, it is desirable to
maximise the data dimensions displayed without confusing the user. Typically, vi-
sualisations are required to handle over three dimensions of data. This requires the
flattening of the data to a two or three dimensional graphical display.
The LyberWorld system [25] suggests that information visualisations created prior to
its inception, in 1994, were ‘limited’ to 2D graphics, as computer graphics systems
could not cope with 3D graphics. Hemmje argued that 3D graphics allow for “the
highest degree of freedom to visually communicate information” and that such vi-
sualisations are “highly demanded”. Indeed, recent research into visualisation has
adopted the development of 3D interfaces. However, problems have arisen from this
practice. This is due, in part, to the requirement that users have the spatial abilities
required to interpret a 3D system. Another drawback, is the user’s inability to view
the entire visualisation at once — the graphics at the front of the visualisation often
obscures the data at the back.
NIST [58] recently conducted a study into the time it takes users to retrieve documents](https://image.slidesharecdn.com/721d17e9-3997-45df-83d5-6fd470fa9d7d-150913155104-lva1-app6891/85/Upstill_thesis_2000-31-320.jpg)
![Ü2.8 Result Visualisation 21
from equivalent text, 2D and 3D systems. Results from this experiment illustrate that
there is a significant learning curve for users starting with a 3D interface. During the
experiment the 3D interface proved the slowest method for users accessing the data.
Swan et al. [63] also had problems with their 3D interface, citing that “[they] found
no evidence of usefulness for the[ir] 3-D visualisation”. The argument for and against
the use of 3 dimensions in information visualisations is not within the scope of this
thesis.
Interactive Interfaces
A dynamic visualisation interface can be used to aid in the comprehension of the in-
formation presented in a visualisation. Dynamic Queries and Filters are two ways of
achieving such an interface.
Dynamic Queries [1, 69] allow users to change parameters in a visualisation, with
immediate updates to reflect the changes. This direct-manipulation interface to queries
can be seen as an adoption of the WYSIWYG (What you see is what you get) model,
where a tight coupling between user action and displayed documents exist.
Filters are similar to Dynamic Queries; they allow users to provide extra document
criteria to the information visualisation. Documents that fulfill the criteria are then
highlighted.
2.8.2.1 Example Information Visualisation Systems
While there are many differing information visualisations for information retrieval
results, there are three prominent models: spring-based, Venn-based and terrain map
based. These models are described below.
Spring-based models separate documents using document discriminators [14]. Each
discriminator is attached to documents by springs which attract matching documents
— the degree of attraction is proportional to the degree of match. This clusters the
documents according to common discriminators. In this model the dimensions are
compressed using springs, with each spring representing a dimension. An in-depth
description of spring-based models is given is section 5.3.1. An example is shown
in figure 2.14. Systems that use this model include the VIBE system [49, 15, 36, 23],
WebVIBE [45, 43, 44], LyberWorld [25, 24], Bead [9] and Mitre [33]. A survey of these
visualisations is provided in appendix A.1.
Venn-based models are a class of information visualisations that allow users to in-
terpret or provide Boolean queries and results. In this model, the dimensions are
compressed using Venn diagram set relationships. Systems that use this model in-
clude InfoCrystal [61] and VQuery [31]. A survey of these visualisations is provided
in appendix A.2.](https://image.slidesharecdn.com/721d17e9-3997-45df-83d5-6fd470fa9d7d-150913155104-lva1-app6891/85/Upstill_thesis_2000-33-320.jpg)
![22 Domain
Terrain map models are information visualisations that illustrate the structure of the
document collection by showing different types of geography on a map. These visu-
alisations are based on Kohonen’s feature map algorithm [54]. Dimensions are com-
pressed into map features such as mountain ranges and valleys. An example visual-
isation is shown in figure 2.15. Two systems that use this model are: SOM [38] and
ThemeScapes [42]. A survey of these visualisations is provided in appendix A.3.
Other information visualisation models also exist:
¯ Clustering Models: depict relationships between clusters of documents [58, 13].
¯ Histographic Models: seek to visualise a large number of document attributes at
once [22, 68, 67].
¯ Graphical Plot Models: allow for a comparison of two document attributes [47,
62].
Systems that illustrate these visualisation properties can be found in the appendix A.4.
Figure 2.14: Spring-based Example: The VIBE System. In this example VIBE is being used
to visualise the “president; europe; student; children; economy” query. Documents are rep-
resented by different sized rectangles, with high concentration clusters in the visualisation
represented by large rectangles.
2.9 Relevance Judgements
Only a user can judge the relevance of images in the retrieved document collection.
Document Analysis and Retrieval systems do not understand relevance, only match-
ing documents to a request. Therefore, the final stage of information retrieval is the
cognitive user process of discovering relevant documents in the retrieved document
collection. The cognitive knowledge derived from searching through the retrieved
document collection for relevant documents can lead to a refinement of the visual-
isation, or to a refinement of the original information need. This demonstrates the](https://image.slidesharecdn.com/721d17e9-3997-45df-83d5-6fd470fa9d7d-150913155104-lva1-app6891/85/Upstill_thesis_2000-34-320.jpg)
![Ü2.9 Relevance Judgements 23
Figure 2.15: Terrain Map Example: The ThemeScapes system. In this example ThemeScapes
is being used to generate the geography of a document collection. The peaks represent topics
contained in many documents. Conversely, valleys represent topics contained in only a few
documents
iterative nature of information retrieval — the process is repeated until the user is sat-
isfied with the retrieved document collection.
Information foraging theory, developed by Pirolli et al. [50, 51], is a new approach
to examining the synergy between a user and a visualisation during relevance judge-
ment.
2.9.1 Information Foraging
Humans display foraging behaviour when looking for information. Information for-
aging behaviour is used to the study how users invest time to retrieve information.
Information foraging theory suggests that information foraging is analogous to food
foraging. The optimal information forager is the forager that achieves the best ratio of
benefits to cost [51]. Thus, it is important to allow the user to allocate their time to the
most relevant documents [50].
Foraging activity is broken up into two types of interaction: within-patch and between-
patch. Patches are sources of co-related information. Conceptually patches could be
piles of papers on a desk or clustered collections of documents. Between-patch anal-
ysis examines how users navigate from one source of information to another, while
within-patch analysis examines how users maximize the use of relevant information
within a pile.](https://image.slidesharecdn.com/721d17e9-3997-45df-83d5-6fd470fa9d7d-150913155104-lva1-app6891/85/Upstill_thesis_2000-35-320.jpg)

![Chapter 3
Survey of Image Retrieval
Techniques
“Those who do not remember the past are condemned to repeat it.”
– George Santayana
3.1 Overview
Image retrieval is a specialisation of the information retrieval process, outlined in
chapter 2. This chapter presents a survey of current approaches to image retrieval.
This analysis enables an identification of core problems in current WWW image re-
trieval systems.
3.2 WWW Image Retrieval
Three of the large commercial WWW search engines; AltaVista, Yahoo and Lycos,
have recently introduced text-based image search engines. The following observa-
tions are based on direct experience with these engines.
¯ AltaVista [3] has developed the AltaVista Photo and Media Finder. This image re-
trieval engine provides a simple text-based interface (section 3.3.1) to an image
collection indexed from the general WWW community and AltaVista’s image
database partners. Their retrieval engine is based on the technology incorpo-
rated into their text document search engine. Modifications to this architecture
have been made to associate sections of Web page text to images, in order to
obtain image descriptions.
¯ Yahoo! [70] has developed the Image Surfer. This image retrieval engine contains
images categorised into a topic hierarchy. To retrieve images, users can navigate
this topic hierarchy, or perform find similar content-based (section 3.3.2) searches.
As with Yahoo!’s text document topic hierarchy, all images in the system are cat-
egorised manually. This reliance on image classification makes extensive WWW
image indexing intractable.
25](https://image.slidesharecdn.com/721d17e9-3997-45df-83d5-6fd470fa9d7d-150913155104-lva1-app6891/85/Upstill_thesis_2000-37-320.jpg)
![26 Survey of Image Retrieval Techniques
¯ Lycos [40] has incorporated image retrieval through a simple extension to their
text document retrieval engine. Following a user query, Lycos checks to see
whether retrieved pages contain image references. If so, the images are retrieved
and displayed to the user.
3.2.1 WWW Image Retrieval Problems
The WWW image retrieval problems have been grouped into three key areas: consis-
tency, clarity and control.
The citations in this section are to papers in the fields of image retrieval, information
visualisation and information foraging. The problems this thesis identifies in WWW
image retrieval are similar to problems in these fields.
¯ Consistency:
– System Heterogeneity
When executing a query over multiple search engines, or repeatedly over
the same search engine, users typically retrieve differing search results.
This is due to continual changes in the image collections and ranking al-
gorithms used. All WWW search engines use differing, confidential algo-
rithms to rank images. Further, these algorithms sometimes vary according
to image collection properties or system load. These continual changes can
lead to confusing inconsistencies in image search results.
– Unstructured and Uncoordinated Data
The image meta-data used by WWW image retrieval engines to perform
text-based image retrieval is unreliable. Most WWW meta-data is not pro-
fessionally described, and as such, may be incomplete, subjective or incor-
rect.
¯ Clarity:
– No Transparency
The linear result visualisations used by WWW image retrieval engines do
not transparently reveal why images are being retrieved [34, 28]. This limits
the user’s ability to refine their query expression. This situation is amplified
if the meta-data upon which the ranking takes place is misleading.
– No Relationships](https://image.slidesharecdn.com/721d17e9-3997-45df-83d5-6fd470fa9d7d-150913155104-lva1-app6891/85/Upstill_thesis_2000-38-320.jpg)
![Ü3.2 WWW Image Retrieval 27
– Reliance on Ranking Algorithms
WWW image retrieval systems incorporate confidential algorithms to com-
press multi-dimensional query-document relationship information (section
2.8.1) into a linear list. These algorithms are not well understood by users,
particularly algorithms that incorporate different types of evidence, e.g. a
combination of text and content analysis [2, 34, 28].
¯ Control:
– Inexpressive Query Language
£ Lack of Data Scalability
The large number of images indexed by WWW image retrieval engines
makes content-based image analysis techniques (section 3.3.2) difficult
to apply. Advanced image analysis techniques are computationally ex-
pensive to run. Further, the effectiveness of these algorithms declines
when used over a collection with a large breadth of content [56].
£ Lack of Expression
Existing infrastructure used by WWW search engines to perform im-
age retrieval provides a limited capacity for users to specify their pre-
cise image needs. Current systems allow only for text-based image
queries [2, 28].
– Coarse Grained Interaction:
£ Coarse Grained Interaction
In providing a search service over a high latency network, current
WWW image retrieval systems are limited to providing coarse grained
interaction. In current systems, users must submit a query, retrieve
results and then choose either to restate the query or perform a find
similar search. Searching is an iterative process, requiring continual re-
finement and feedback [28, 16]. These interfaces do not facilitate the
high degrees of user interaction required during the image retrieval
process.
£ Lack of Foraging Interaction
To enable effective information foraging, a result visualisation must al-
low users to locate patches of relevant information and then perform
detailed analysis of the information contained within a patch [51]. In
current WWW image retrieval engines, there is no grouping of like im-
ages, this prohibits any between patch foraging. Further there is no
way for users to view a subset of the retrieved information. Thus in-
formation foraging (see section 2.9.1) is not encouraged through the
visualisation.](https://image.slidesharecdn.com/721d17e9-3997-45df-83d5-6fd470fa9d7d-150913155104-lva1-app6891/85/Upstill_thesis_2000-39-320.jpg)
![28 Survey of Image Retrieval Techniques
3.2.2 Differences between WWW Image Retrieval and Traditional Image
Retrieval
There are several differences between image retrieval on the WWW and traditional
image retrieval systems. As opposed to WWW systems, in traditional systems:
¯ Consistency is a lesser concern
All systems incorporate an internally consistent matching algorithm, and re-
trieve images from a controlled image collection. Since a user interacting with
the system is always dealing with the same image matching tools, consistency
is a lesser concern.
¯ Quality descriptions are assured
As the retrieval system retrieves images from a controlled database, meta-data
quality is assured.
¯ No Communication Latencies
As the retrieval systems are generally co-located with the images and the user,
there is no penalty associated with search iterations.
3.3 Lessons to Learn: Previous Approaches to Image Retrieval
It is convenient for the analysis to group the progress of image retrieval into logical
phases. The phases of image retrieval development are shown in figure 3.1. Although
the progression is not entirely linear, the phases do represent distinct stages in the
evolution of image retrieval.
3.3.1 Phase 1: Early Image Retrieval
The earliest form of image retrieval is Text-Based Image Retrieval. These engines rely
solely on image meta-data to retrieve images, e.g. current WWW image search en-
gines [3, 40]. Traditional document retrieval techniques, such as vector space ranking,
are used to determine matching meta-data, and hence find images. For more informa-
tion on database text-based image retrieval systems refer to [10].
Examples of text-based queries are:
‘Sydney Olympic Games’
‘Sir William Deane opening the Sydney Olympic Games’
‘Torch relay running in front of the ANU’
‘Happy Olympic Punters’
‘Pictures of Trystan Upstill, by the Honours Gang, taken during the Olympic Games’](https://image.slidesharecdn.com/721d17e9-3997-45df-83d5-6fd470fa9d7d-150913155104-lva1-app6891/85/Upstill_thesis_2000-40-320.jpg)
![Ü3.3 Lessons to Learn: Previous Approaches to Image Retrieval 29
Phase 1:
Early Image
Retrieval
Phase 2:
Expressive Query
Languages
Phase 3:
Scalabilitythrough
the Combination of
Techniques
Phase 4:
Clarity through
User Understanding
and Interaction
Image Retrieval
Research
Phase 1: Can we
perform Image
Retrieval on the
World-Wide Web?
World-Wide Web
Image Retrieval
Phase 2: ?
Figure 3.1: The development of image retrieval This diagram shows the logical phases in
the information retrieval process. The section is structured according to these phases.
Although text-based image retrieval is the most primitive of all retrieval techniques,
it does posses useful traits. If professionally described image meta-data is available
during retrieval and analysis it can provide a comprehensive abstraction of a scene.
Additionally, since text-based image retrieval uses existing document retrieval tech-
niques, many different ranking and indexing models are already available. Further,
existing infrastructure can be used to perform image indexing and retrieval — an at-
tractive proposition for current WWW search engines.
Improvements
¯ Ability to Retrieve Images: provides a simple mechanism for image access and
retrieval.
Further Problems
¯ Consistency:
– Unstructured and Uncoordinated data: image retrieval effectiveness relies
on the quality of image descriptions [48]. Further, as it can be unclear which
sections of a WWW page are related to an image’s contents, problems arise
when trying to associate meta-data to images on WWW pages.
¯ Control:](https://image.slidesharecdn.com/721d17e9-3997-45df-83d5-6fd470fa9d7d-150913155104-lva1-app6891/85/Upstill_thesis_2000-41-320.jpg)
![30 Survey of Image Retrieval Techniques
– Inexpressive Query Language:
£ Lack of Expression: text-based querying may not allow the user to
specify a precise image need. There is no way to convey visual image
features to the image search engine.
3.3.2 Phase 2: Expressive Query Languages
Content-Based Image Retrieval enables users to specify graphical queries. The theory
behind its inception is that users have a precise mental picture of a desired image,
and as such, they should be able to accurately express this need [52]. Further, it is hy-
pothesised that this removed reliance on image meta-data minimises retrieval using
potentially incorrect, incomplete or subjective data.
Examples of content-based queries are:
Image properties: ‘Red Pictures’, ‘Pictures with this texture’
Image shapes: ‘Arched doorway’, ‘Shaped like an elephant’
Objects in image: ‘Pictures of elephants’, ‘Generic elephants’
Image sections: ‘Red section in top corner’, ‘Elephant shape in centre’
The six most frequently used query types in content-based image retrieval are:
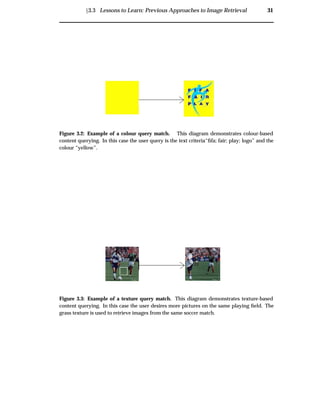
Colour allows users to query an image’s global colour features. An example of
colour-based content querying is shown in figure 3.2. According to Rui et al.
[28], colour histograms are the most commonly used feature representation.
Other methods include Colour Sets which facilitate fast searching with an ap-
proximation to Histograms, and Colour Moments, to overcome the quantization
effects in Colour Histograms. To improve Colour Histograms, Ioka and Niblack
et al. provide methods for evaluating similar but not exact colours and Stricker
and Orengo propose cumulative colour histograms to reduce noise [28].
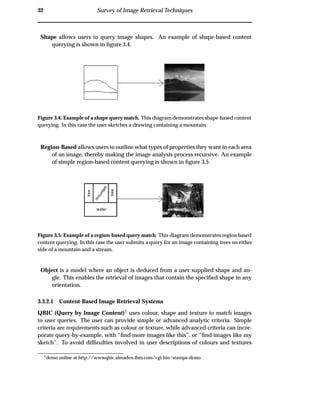
Texture is a visual pattern that approximates the appearance of a tactile surface. This
allows the user to specify whether an image appears rough and how much seg-
mentation there an image exhibits. An example of texture-based content query-
ing is shown in figure 3.3. According to Rui et al. [28], texture recognition can be
achieved using Haralick et al.’s co-occurrence matrix representations, Tamura et
al.’s computational approximations to visual texture properties or Simon and
Chang’s Wavelet transforms.
Colour Layout is advanced colour measurement, whereby users are given the ability
to show how colours are related to each other in a scene [48]. For example, a
query containing a gradient from orange to yellow could be used to retrieve a
sunset.](https://image.slidesharecdn.com/721d17e9-3997-45df-83d5-6fd470fa9d7d-150913155104-lva1-app6891/85/Upstill_thesis_2000-42-320.jpg)
![Ü3.3 Lessons to Learn: Previous Approaches to Image Retrieval 33
QBIC contains a texture and colour library. This enables users to select colours, colour
distributions or choose desired textures as queries [19, 29].
NETRA allows users to navigate through categories of images. The query is refined
through a user selection of relevant image content properties. [16, 28, 41].
Excalibur is a query-by-example system. Users provide candidate images which are
matched using pattern recognition technology. Excalibur is a commercial application
development tool rather than a complete retrieval application. The Yahoo! web search
engine uses this technology to find similar images (section 3.2) [16, 28, 17].
Blobworld breaks images into blobs (see figure 3.6). By browsing a thumbnail grid
and specifying which blobs of images to keep, the user identifies blobs of interest and
areas of disinterest. This is used to refine the query [8, 66].
Figure 3.6: The Blobworld System. This screenshot from the Blobworld system illustrates the
process of picking relevant image blobs.
EPIC allows users to draw rectangles and label what they would like in each section
of the image, as shown in figure 3.7 [32].](https://image.slidesharecdn.com/721d17e9-3997-45df-83d5-6fd470fa9d7d-150913155104-lva1-app6891/85/Upstill_thesis_2000-45-320.jpg)
![34 Survey of Image Retrieval Techniques
Figure 3.7: The EPIC System. This screenshot illustrates the EPIC system’s query process.
Users describe their image need through labelled rectangles in the query window on the left.
ImageSearch allows users to place icons representing objects in regions of an im-
age. Users can also sketch pictures if they want a higher degree of control [37]. See
figure 3.8.
3.3.2.2 Phase 2 Summary
Improvements
¯ Consistency:
– Discard unstructured and uncoordinated data: since image meta-data
is never used to index or retrieve the images, problems relating to incom-
plete, incorrect or subjective descriptions are avoided. Further enrichment
is obtained through the ability to use content-based image analysis to query
many differing artifacts in an image.
¯ Control:
– Inexpressive Query Language:
£ New Expression through Content-based Image Retrieval: through
the expressive nature of content-based image retrieval, more thorough
image criteria can be gained from the user. This provides the system
with more information with which to judge image relevance.
Further Problems
¯ Clarity:](https://image.slidesharecdn.com/721d17e9-3997-45df-83d5-6fd470fa9d7d-150913155104-lva1-app6891/85/Upstill_thesis_2000-46-320.jpg)
![Ü3.3 Lessons to Learn: Previous Approaches to Image Retrieval 35
Figure 3.8: The ImageSearch system. This screenshot illustrates the ImageSearch system’s
query process. The user positions icons symbolising what they would like in that region of an
image.
– Complex Interfaces: there is a comparatively large user cost incurred with
the creation of content-based queries. If users are required to produce a
sketch or an outline of the desired images, the time or skill required can
prove prohibitive.
¯ Control:
– Inexpressive Query Language:
£ Content-based Image Retrieval algorithms do not scale well: content-
based image retrieval is less effective on large-breadth collections. Since
there are many definitions of similarity and discrimination, their power
degrades when using large breadth image collections as shown in fig-
ure 3.9 [2, 28, 16]
3.3.3 Phase 3: Scalability through the Combination of Techniques
Bearing in mind the limitations of content-based image retrieval on large breadth im-
age collections, several systems have combined both text and content-based image
retrieval. It is hypothesized that content-based analysis can be used on larger image
collections when combined with text-based analysis. The rationale for this is that text-
based techniques can be used to specify a general abstraction of image contents, while
content-based criteria can be used to identify relevant images in the domain.](https://image.slidesharecdn.com/721d17e9-3997-45df-83d5-6fd470fa9d7d-150913155104-lva1-app6891/85/Upstill_thesis_2000-47-320.jpg)
![36 Survey of Image Retrieval Techniques
Figure 3.9: Misleading shape and texture . The first image in this example is the query-by-
example image used as a content-based query. The other images in the grid were retrieved
through matching of shape, texture and colour (image from [56]).](https://image.slidesharecdn.com/721d17e9-3997-45df-83d5-6fd470fa9d7d-150913155104-lva1-app6891/85/Upstill_thesis_2000-48-320.jpg)
![Ü3.3 Lessons to Learn: Previous Approaches to Image Retrieval 37
3.3.3.1 Text and Content-Based Image Retrieval Systems
The combination of analysis techniques can either occur during initial query creation,
allowing users to initially specify both text and content-based image criteria, or after
retrieving a collection of images, allowing users to refine the image collection.
Text with Content Relevance Feedback: in these systems, the user initially provides
a text query. Using content-based image retrieval, they then tag relevant images
to retrieve more images like them.
Text and Content Searching: in these systems, both text and content retrieval occurs
at the same time. The user may express both text and content criteria in their
initial query.
Text with Content Relevance Feedback
Chabot, 2 developed by Ogle and Stonebraker, uses simplistic content and text anal-
ysis to retrieve images. Text criteria is used to retrieve an initial collection of images,
followed by content criteria to refine the image collection [48].
MARS is a system that learns from user interactions. The user begins by issuing a
text-based query, and then marks images in the retrieved thumbnail grid as either
relevant or irrelevant. The system uses these image judgements to find more relevant
images. The benefit of this approach is that it relieves the user from having to describe
desirable image features. Users only have to pick interesting image features [27].
Text and Content Searching
Virage incorporates plugin primitives that allow the system to be adapted to specific
image searching requirements. The Virage plugin creation engine is open-source,
therefore plugins can be created by end-users to suit their domain. The Virage en-
gine includes several “universal primitives” that perform colour, texture and shape
matching [16, 28].
Lu and Williams have incorporated both basic colour and text analysis into their im-
age retrieval system with encouraging results using a small database. One of their
major problems was in finding methods to combine evidence from colour and text
matching [39].
3.3.3.2 Phase 3 Summary
Improvements
2
This system has recently been renamed Cypress](https://image.slidesharecdn.com/721d17e9-3997-45df-83d5-6fd470fa9d7d-150913155104-lva1-app6891/85/Upstill_thesis_2000-49-320.jpg)
![38 Survey of Image Retrieval Techniques
¯ Consistency:
– Reduce effects of Unstructured and Uncoordinated data: the image meta-
data is only partially used to retrieve the images, with content-based image
retrieval used as a second criteria for the image analysis.
¯ Control:
– Inexpressive Query Language:
£ Improved Expression: users can enter criteria for images through tex-
tual descriptions and visual appearance. Incorporating both text and
content-based image analysis allows for the consideration of all image
data during retrieval.
£ Improving the scalability of Content-based Image Retrieval: when
combining text-based analysis with content-based analysis, difficulties
involved in performing content-based image retrieval on large breadth
image collections are partially alleviated.
Further Problems
¯ Clarity:
– Reliance on Ranking Algorithms: combining rankings from several dif-
ferent types of analysis engines into a thumbnail grid can be difficult [2, 16,
4, 27].
– No Transparency: when using several analysis techniques it can be hard
for users to understand why images were matched. Without this evidence,
it may be difficult for users to ascertain faults in their query.
3.3.4 Phase 4: Clarity through User Understanding and Interaction
In response to the problems associated with the user understanding of retrieved im-
age collections, several systems have attempted to improve the clarity of the image re-
trieval process. These systems have incorporated information visualisations, outlined
in section 2.8.2, to convey image matching. It is in this light that phase 4 attempts to
improve system transparency, relationship maintenance and to reduce the reliance on
ranking algorithms.
3.3.4.1 Image Retrieval Information Visualisation Systems
The two projects examined in this section provide spring-based visualisations, similar
to the VIBE system in section A.1.
MageVIBE: uses a simplistic approach to image retrieval, implementing text-based
only querying of a medical database. Images in this visualisation are represented by
dots. The full image can be displayed by selecting a dot [36].](https://image.slidesharecdn.com/721d17e9-3997-45df-83d5-6fd470fa9d7d-150913155104-lva1-app6891/85/Upstill_thesis_2000-50-320.jpg)
![Ü3.3 Lessons to Learn: Previous Approaches to Image Retrieval 39
Figure 3.10: The ImageVIBE system. This screenshot illustrates the ImageVIBE visualisation
for a user query for an aeroplane in flight. Several modification query terms, such as vertical
and horizontal, are used to describe the orientation of the plane.
ImageVIBE: uses text-based and shape-based querying, but otherwise does not differ
from the original VIBE. ImageVIBE allows users to refine their text queries using con-
tent criteria, such as shapes, orientation and colour [11]. An ImageVIBE screenshot
depicting a search for an aircraft image is shown in figure 3.10.
There is yet to be any evaluation of the effectiveness of these systems.
3.3.4.2 Phase 4 Summary
Improvements
¯ Improved Transparency: providing a dimension for each aspect of the ranking,
enables users to deduce how the image matching occurred.
¯ Relationship Maintenance: the query term relationships between images are
maintained — images that are related to the same query terms, by the same
magnitude, are co-located.
¯ User Relevance Judgements: users select relevant images from the retrieved
image collection, rather than relying on a combination of evidence algorithm to
determine the best match.
Further Problems
¯ Complex Interfaces: systems must be simple. It has been shown that the tradi-
tional VIBE interface is too complex for general users [45, 43, 44].](https://image.slidesharecdn.com/721d17e9-3997-45df-83d5-6fd470fa9d7d-150913155104-lva1-app6891/85/Upstill_thesis_2000-51-320.jpg)
![40 Survey of Image Retrieval Techniques
3.3.5 Other Approaches to WWW Image Retrieval
The WWW has recently become the focus of phase 2 research in image retrieval. Two
such research systems are ImageRover and WebSEEK.
ImageRover is a system that spiders and indexes WWW images. A vector space
model of image features is created from the retrieved images [64, 57]. In this system
users browse topic hierarchies and can perform content-based find similar searches.
The system has encountered index size and retrieval speed difficulties.
WebSEEK searches the Web for images and videos by extracting keywords from the
URL and associated image text, and generating a colour histogram. Category trees
are created using all rare keywords indexed in the system. Users can query the sys-
tem using colour requirements, providing keywords or by navigating a category tree
[59, 60].
3.4 Summary
Phase 1: Early Image
Retrieval
goal
search for images
problems
Unstructured +
Uncoordinated data
Lack of Expression
Phase 2: Expressive
Query Languages
problems
CBIR unscalable
Complex interfaces
Phase 1
Problems
Phase 3:Scalability
through technique
combination
Phase 2
Problems
goals
Phase 4: Clarity
through user
understanding
Phase 3
Problems
problems
problems
problems
goals
goals
transparency
combination of
evidence
Current WWW
Image Search Engines
goal
problems
search for images
WWW Retrieval
Issues
Chapter 4: Improving WWW
Image Retrieval
goals
complex
interfaces
(found in section 3.4.1)
Figure 3.11: Development of WWW Image Retrieval Problems. This diagram illustrates the
development of the WWW Image Retrieval problems as covered in this chapter. The problems
from each phase, and extra WWW retrieval issues must be addressed to create an effective
WWW image retrieval system.](https://image.slidesharecdn.com/721d17e9-3997-45df-83d5-6fd470fa9d7d-150913155104-lva1-app6891/85/Upstill_thesis_2000-52-320.jpg)

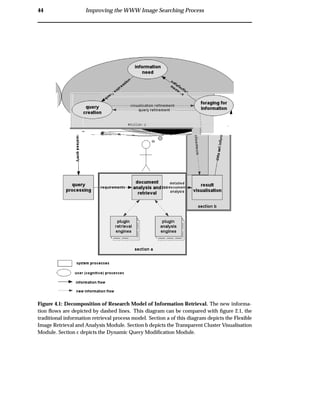
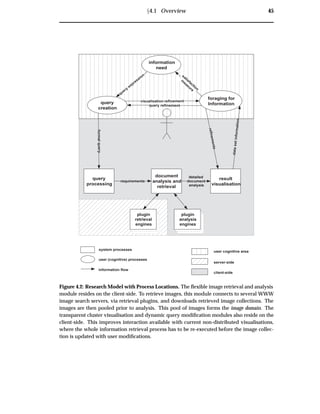
![46 Improving the WWW Image Searching Process
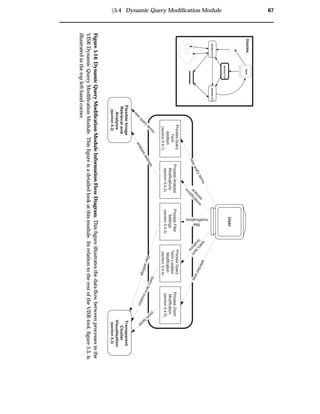
4.2 Flexible Image Retrieval and Analysis Module
This module separates the retrieval and analysis responsibilities, thereby allowing for
more flexible and consistent image analysis.
This module resides on the client-side (see figure 4.2). A retrieval plugin is used to
retrieve an initial collection of images from a WWW image search engine. These im-
age are downloaded to the client machine and form the image domain. The image
domain is then analysed by user specified analysis plugins. This pluggable interface
allows for any number of specified retrieval or analysis engines to be used during the
image retrieval and analysis phase. For example, a collection of image meta-data and
image content analysis techniques may be provided.
The design of this module in the VISR tool implementation is provided in section 5.2.
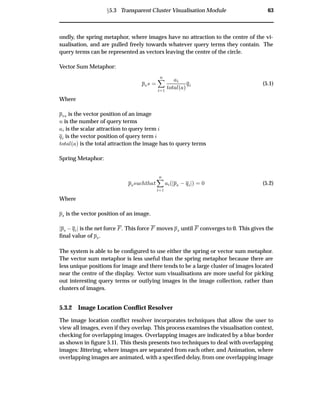
4.3 Transparent Cluster Visualisation Module
This module visualises the relationships between retrieved images and their corre-
sponding search terms. This removes the requirement for the combination of evidence
by providing a transparent visualisation. Furthermore, to allow for easy identification
of images, thumbnails are used to provide image overviews. Users click on the thumb-
nails to view the full image. To alleviate visualisation latencies, this module resides
on the client-side (see figure 4.2).
The design of this module in the VISR tool implementation is provided in section 5.3.
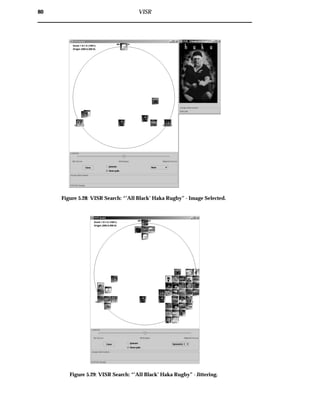
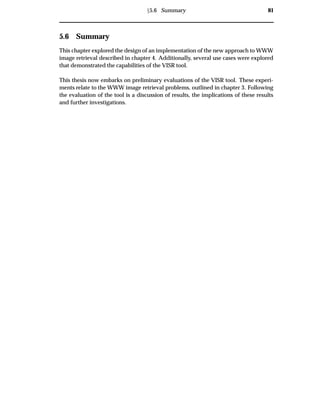
Screenshots of the VISR transparent cluster visualisation are provided in section 5.5.
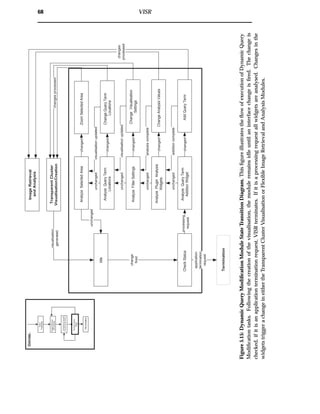
4.4 Dynamic Query Modification Module
The dynamic query module allows users to modify queries and immediately view the
resulting changes in the visualisation. This provides a facility for the re-weighting of
query terms, the tweaking of analysis parameters, the zooming of the visualisation
and the application of filters to the image collection.
Experiments have shown that users will only continue to forage for data if the search
continues to be profitable [51]. Thus it is important to have low latencies for query
modifications and system interaction. WWW image retrieval system interaction suf-
fers from high latencies. Distributing the system as shown in figure 4.2 provides lower
interaction latencies.
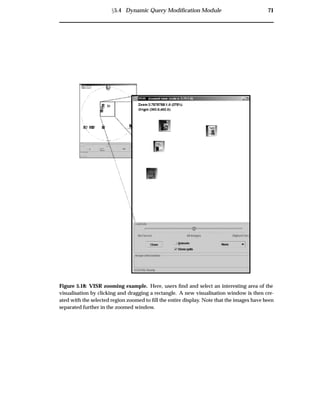
The design of this module in the VISR tool implementation is provided in section 5.4.](https://image.slidesharecdn.com/721d17e9-3997-45df-83d5-6fd470fa9d7d-150913155104-lva1-app6891/85/Upstill_thesis_2000-58-320.jpg)
![Ü4.5 Proposed Solutions to Consistency, Clarity and Control 47
4.5 Proposed Solutions to Consistency, Clarity and Control
4.5.1 Consistency
Current WWW search engines use varied ranking techniques on meta-data which is
often incomplete or incorrect. This can confuse users.
System Heterogeneity
The flexible image retrieval and analysis module provides a consistent well-understood
set of tools for image analysis. When results from these tools are incorporated into the
transparent cluster visualisation, images are always displayed in the same manner.
This implies that if two search engines returned the same image, the images would be
co-located in the display.
Unstructured and Uncoordinated data
The flexible image retrieval and analysis module does not accommodate noisy meta-
data. It does, however, deal with it in a consistent fashion. The use of consistent
plugins and the transparent cluster visualisation may allow for swift identification of
noise in the image collection.
4.5.2 Clarity
Current WWW search engines provide thumbnail grid result visualisations. Thumb-
nail grids do not express why images were retrieved or how retrieved images are
related and thereby make it harder to find relevant images [34, 15].
No Transparency
The transparent cluster visualisation facilitates user understanding of why images are
retrieved and which query terms matched which documents. This assists the user in
deciphering the rationale for the retrieved image collection and avoids user frustra-
tion by facilitating the “what to do next” decision. A key issue in image retrieval is how
images are perceived by users [28]. Educating users about the retrieval process assists
them to understand how the system is matching their queries, and thereby how they
should form and refine their queries.
No Relationships
The maintenance of image relationships enables the clustering of related images. This
allows users to find similar images quickly.
Reliance on Ranking Algorithms
The maintenance of per-term ranking information, reduces the reliance on ranking
algorithms. When using the transparent cluster visualisation there is no combination
of evidence except in the search engine, which is only required to derive an initial
quality rating, either matching or not so.](https://image.slidesharecdn.com/721d17e9-3997-45df-83d5-6fd470fa9d7d-150913155104-lva1-app6891/85/Upstill_thesis_2000-59-320.jpg)
![48 Improving the WWW Image Searching Process
4.5.3 Control: Inexpressive Query Language
Current WWW search engines limit the user’s ability to specify their exact image need.
For example, because image analysis is costly, most systems do not allow users to
specify image content criteria. Further, a reduction of effectiveness is observed during
the scaling of these techniques across large breadth collections [56].
Lack of Expression
The client-side distribution of the analysis task in the flexible retrieval and analysis
module reduces WWW search engine analysis costs. Through the use of the image
domain, expensive content-based image retrieval techniques and other analysis is per-
formed over a smaller image collection. Further, the use of these techniques does not
require modifications to the underlying WWW search engine infrastructure.
Lack of Data Scalability
In the proposed flexible analysis module, the user is able to nominate several analysis
techniques that operate concurrently during image matching. Through third-party
analysis plugins, users can perform any type of analysis.
4.5.4 Control: Coarse Grained Interaction
Current WWW search engines provide non-interactive interfaces to the retrieval pro-
cess. This provides users with minimal insight into how the retrieval process occurs
and renders them unable to focus a search on an interesting area of the result visuali-
sation.
Coarse Grained Interaction
New modes of interaction and lower latencies are achieved through the use of client-
side analysis, visualisation and interface. When interacting with the dynamic query
modification module the user’s changes are reflected immediately in the visualisation.
All tasks that do not require new documents to be retrieved are completed with low
latencies. Thus, features such as dynamic filters, query re-weighting and zooming can
be implemented effectively.
Lack of Foraging Interaction
Foraging interaction is encouraged though the transparent cluster visualisation’s abil-
ity to cluster and zoom. Between-patch foraging is aided through the grouping of
similar images. Within-patch foraging is facilitated through the ability to examine a
single cluster in greater detail. Through zooming, users are able to perform a more
thorough investigation of the images contained within a cluster. An example of this
practice is shown in figure 4.3.](https://image.slidesharecdn.com/721d17e9-3997-45df-83d5-6fd470fa9d7d-150913155104-lva1-app6891/85/Upstill_thesis_2000-60-320.jpg)
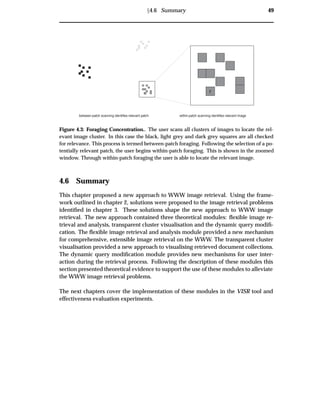


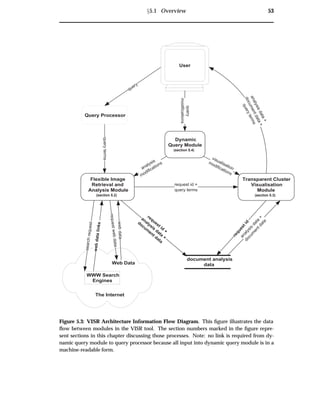
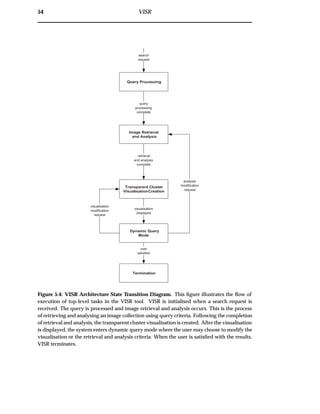
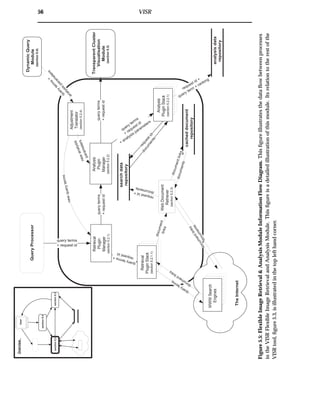
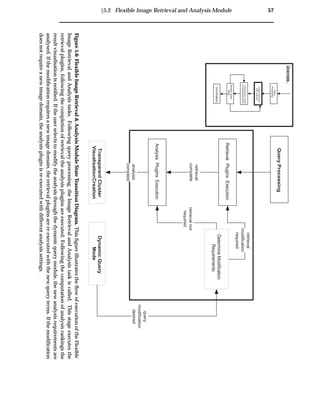
![Ü5.2 Flexible Image Retrieval and Analysis Module 55
5.2 Flexible Image Retrieval and Analysis Module
The information flow diagram for the Flexible Image Retrieval and Analysis Module
is shown in figure 5.5, while the state transition diagram is shown in figure 5.6. The
structure of this section is illustrated by the information flow diagram, while the state
transition diagram illustrates the flow of execution.
5.2.1 Retrieval Plugin Manager
The Retrieval Plugin Manager manages all system retrieval plugins. Upon a search
request, the plugin manager determines which retrieval plugins are able to fulfill the
request, either in whole or in part, and sends the appropriate query terms to the re-
trieval engines. Following the completion of retrieval, the retrieved image collection
is pooled. This pool of images forms the image domain.
5.2.1.1 Retrieval Plugin Stack
The plugins connect to their corresponding retrieval engine, translate queries into a
format acceptable to the engine and submit the query. The links retrieved from the
engines are pooled by the plugin, and sent to the Web document retriever for retrieval.
This uses existing Web search infrastructure to retrieve from a large collection of im-
ages.
Implemented Retrieval Plugins
VISR contains a WWW retrieval plugin for the AltaVista image search engine [3]. Al-
taVista only supports text-based image retrieval, as such, queries must contain at least
one text analysis criteria, this may however, be accompanied by multiple content cri-
teria.
5.2.2 Analysis Plugin Manager
The Analysis Plugin Manager manages all the analysis plugins in the system. The
query terms are analysed by their corresponding analysis plugins.
If there is no plugin for a given query type, the system can be set to default to text, or
to ignore the query term. If one plugin services multiple query terms, they are queued
at the desired analysis plugin.
5.2.2.1 Analysis Plugin Stack
The plugins access the search document repository and retrieve the document collec-
tion stored by Web document retriever. The documents are analysed on a per query-](https://image.slidesharecdn.com/721d17e9-3997-45df-83d5-6fd470fa9d7d-150913155104-lva1-app6891/85/Upstill_thesis_2000-67-320.jpg)
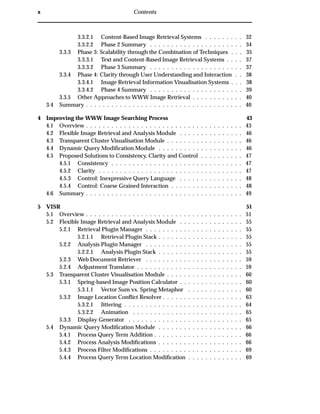
![58 VISR
Source Quality
Image URL 34%
Image Name 50%
Title 62%
Alt text 86%
Anchor text 87%
Heading 54%
Surrounding text 34%
Entire text 33%
Table 5.1: Keyword source qualities from [46]
term basis; with each query term ranked individually and stored in the analysis data
repository.
One of the key problems in performing text-based image analysis on the WWW is
how to associate Web page text to images. The association of HTML meta-data to im-
ages retrieved from Web pages is a complex problem. This task becomes even more
arduous because HTML meta-data can be incomplete or incorrect. When using multi-
ple tags in HTML documents to rank images it is important to take the quality of each
source into account when indexing an image.
Lu and Williams [39] use bibliographic data from HTML documents to derive im-
age text relevance. They use a simple product based on unfounded quality measures
to calculate the relevance of document sections to an image. They provide no experi-
mental evidence to support their rankings.
Mukherjea and Cho [46] use a combination of bibliographic and structural informa-
tion embedded in the HTML document to find image relevant text. They then ex-
perimentally determine the quality of each image source. The ratings they found are
presented in table 5.1.
The text-based analysis plugin in the VISR tool uses all sections of the HTML docu-
ment to associate meta-data. Mukherjea and Cho’s text quality measures are used to
scale document section meta-data relevance.
Content-based Analysis Plugin
VISR contains a colour content-based image analysis plugin. This plugin performs a
simple colour analysis of images, given a user specified colour. This plugin provides
proof-of-concept content-based analysis. Other content-based analysis plugins to per-
form more advanced analysis can be incorporated into the system.
Colour analysis is performed using basic histographic analysis, where image colour](https://image.slidesharecdn.com/721d17e9-3997-45df-83d5-6fd470fa9d7d-150913155104-lva1-app6891/85/Upstill_thesis_2000-70-320.jpg)
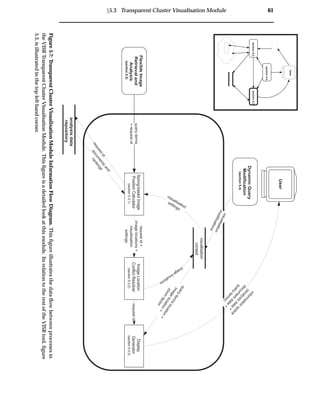
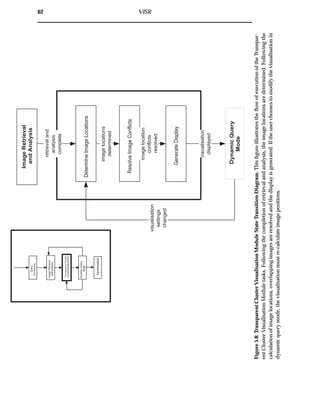
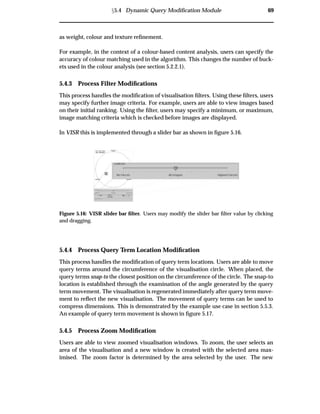
![60 VISR
5.3 Transparent Cluster Visualisation Module
The information flow diagram for the Transparent Cluster Visualisation module is
shown in figure 5.7, while the state transition diagram is shown in figure 5.8. The
structure of this section is illustrated by the information flow diagram, while the state
transition diagram illustrates the flow of execution.
5.3.1 Spring-based Image Position Calculator
Given query term matching analysis data, the spring-based image position calculator
positions images in the visualisation. The visualisation is based on a spring model
developed by Olsen and Korfhage [49] for the original VIBE. This was formalised by
Hoffman to produce the Radial Visualization (RadViz) [26]. In RadViz, reference
points are equally spaced around the perimeter of a circle. The data set is then dis-
tributed in the circle according to its attraction to the reference points.
In VISR, the distribution occurs thorough query terms applying forces to the images in
the collection. Springs are attached such that each image is connected to every query
term, and images are independent of each other. The query terms remain static while
the images are pulled towards the query terms according to how relevant the query
terms are to the image. When these forces reach an equilibrium, the images are in their
final positions. The conceptual model of this visualisation can be seen in figure 5.9.
Image Space](https://image.slidesharecdn.com/721d17e9-3997-45df-83d5-6fd470fa9d7d-150913155104-lva1-app6891/85/Upstill_thesis_2000-72-320.jpg)


![84 Experiments & Results
6.2.2 Visualisation Precision
Visualisation Precision is an extension of the precision ranking measure in document
retrieval, as used in TREC evaluations [65], to that of clustered information visualisa-
tion. Rather than measuring precision of relevant retrieved documents, this measure
aims to gauge the precision of the clustering algorithm.
Definitions:
Ö
is the number of images relevant to a user in a cluster space
is the number of images irrelevant to a user in a cluster space
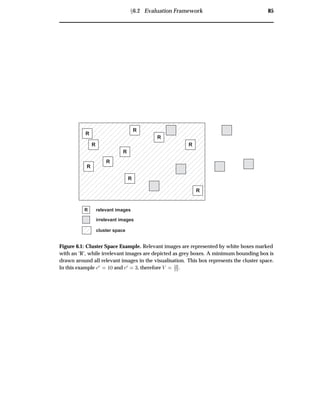
The cluster space is evaluated by performing a minimum bounding of all images in a
visualisation that are relevant to the user. The cluster space is then all images within
this minimum bounding, both relevant and irrelevant.
Thus, the Visualisation Precision is: the number of relevant images in a cluster, Ö
di-
vided by the total number of images in the cluster Ö
· . This is similar to the measure
of document cluster precision by Pirolli and Card [50]. An example calculation of Vi-
sualisation Precision is shown in figure 6.1.
Î
Ö
Ö
· (6.2)
This measure is now extended to include partial clusters. Given Ö
as the total num-
ber of relevant images in the cluster space, Ö
Ô is now introduced as number of relevant
images at a percentage Ô of the cluster space. An example of the calculation of visual-
isation precision for Ô ½¼¼±, Ô ¼± and Ô ¼± is illustrated in figure 6.2.
The revised formula for visualisation precision is then:
ÎÔ
Ö
Ô
Ö
Ô · Ô
(6.3)
Where
Ô percentage of relevant images
ÎÔ is the visualisation precision at percentage Ô
Ö
Ô number of relevant images at percentage Ô
Ô is the number of irrelevant images in the cluster at percentage Ô
This measure is useful for determining the effectiveness of clustering on noisy data.
The best profitability can be found by shrinking the bounding box and discarding
outlying images.](https://image.slidesharecdn.com/721d17e9-3997-45df-83d5-6fd470fa9d7d-150913155104-lva1-app6891/85/Upstill_thesis_2000-96-320.jpg)

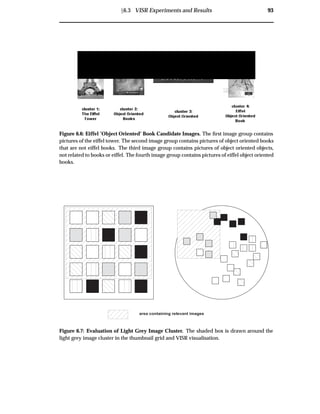
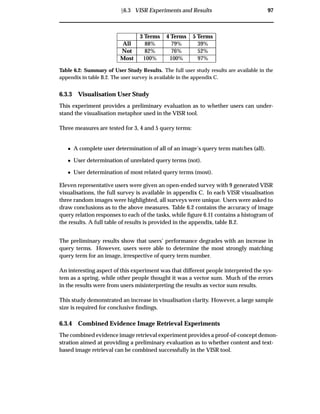
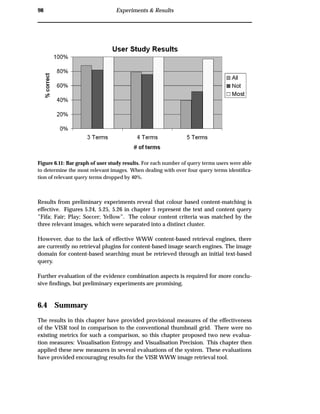
![Ü6.3 VISR Experiments and Results 87
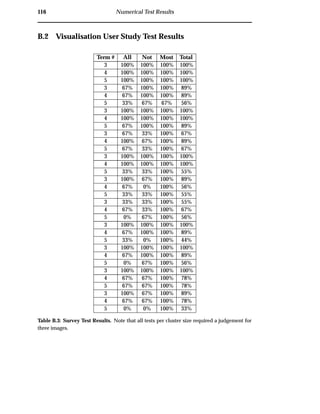
6.2.3 User Study Framework
It is difficult to objectively compare visualisation techniques using user studies [21].
Aesthetic visualisation properties make it hard to separate user subjective evaluations
from objective analysis. As a result, much information visualisation research neglects
comprehensive user evaluation. Previous work has shown that testing user interac-
tion with an interface is not a coherent measure of visualisation clarity, but rather,
interface usability [44]. Morse and Lewis evaluated the performance of core visual-
isation features through the use of de-featured interfaces and had positive results [45].
These de-featured interfaces tested the underlying visualisation metaphors through a
paper-based user study. Users were not required to interact with the system.
The user studies pertaining to the VISR tool are paper-based. This is used to decouple
the examination of the visualisation clarity and the interaction effectiveness.
6.3 VISR Experiments and Results
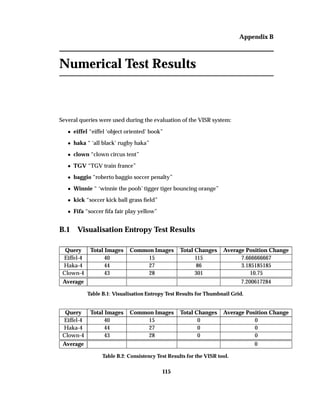
6.3.1 Visualisation Entropy Experiment
This visualisation entropy experiment is used to compare the consistency of the VISR
and thumbnail grid visualisations. A thumbnail grid and VISR visualisation were
generated for two document collections retrieved using the same query at different
times. The image collection indexed by the WWW image retrieval engine is contin-
ually changing, as such, the two retrieved document collections contained differing
documents.
Method:
1. Document collection retrieved on Thursday the 31st of August 2000 at 6:27:07
PM.
2. Document collection retrieved using the same query on Saturday the 4th of
November 2000 at 8:04:23 PM.
3. Visualisation Entropy formula used to determine visualisation consistency.
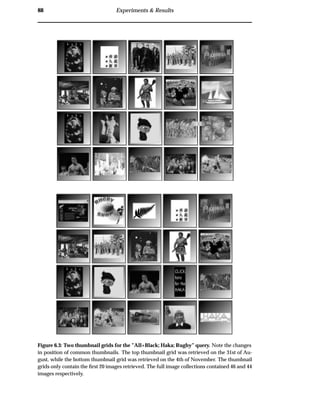
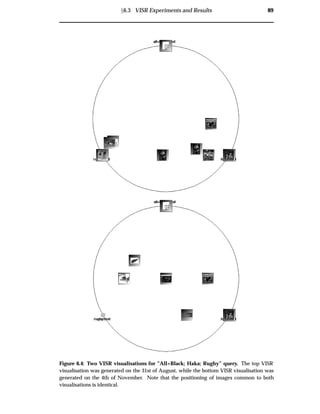
The thumbnail grids and VISR visualisations are illustrated in figures 6.3 and 6.4 re-
spectively.
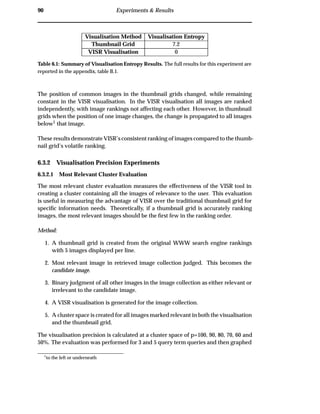
The summarised results for this experiment are shown in table 6.1. Full results are
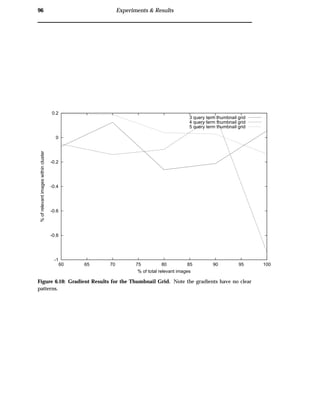
reported in the appendix B.1.](https://image.slidesharecdn.com/721d17e9-3997-45df-83d5-6fd470fa9d7d-150913155104-lva1-app6891/85/Upstill_thesis_2000-99-320.jpg)


![102 Discussion
cluster visualisation, the VISR tool reduces the effects of system heterogeneity. The vi-
sualisation entropy experiment showed how common images were displayed in the
same location after changes to the underlying image collection. In the VISR tool, doc-
uments are always ranked in the same manner and placed at the same position in the
visualisation.
Unstructured and Uncoordinated Data
The effects of unstructured and uncoordinated data are minimised through a main-
tenance of transparency during retrieval. The visualisation user study showed that
users were able to determine query term associations for retrieved images. This poten-
tially allows users to refine their query to remove unwanted images by understanding
why they were retrieved.
7.2 Clarity
Current WWW search engines provide thumbnail grid result visualisations. Thumbnail grids
do not express why images were retrieved or how retrieved images are related and thereby make
it harder to find relevant images [34, 15]. (from section 4.5.2)
No Transparency
Through the pooling of documents prior to analysis and the transparency cluster vi-
sualisation, system transparency has been improved. The visualisation user study
showed that users are able to interpret image collections using the VISR tool. A large
percentage of users were successful in determining complete image associations for
3 and 4 query terms. Queries that contain more than 4 query terms can be viewed
transparently through the movement of query terms, dynamically compressing di-
mensions.
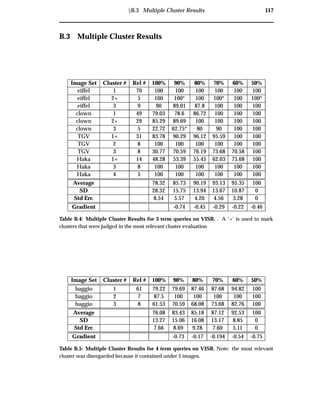
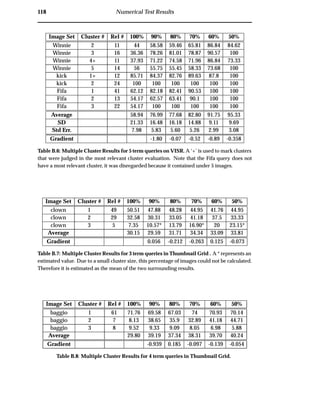
No Relationships
Through the pooling of documents prior to analysis and the use of a transparent clus-
ter visualisation, the maintenance of document relationships has been improved. The
effectiveness of clustering is shown through the most relevant cluster and multiple
cluster evaluations. In these evaluations the VISR tool outperformed the traditional
approach. In both cases VISR clustered images with a visualisation precision of over
100% more than the thumbnail grid.
Reliance on Ranking Algorithms
Ranking all evidence individually serves to remove reliance on complex WWW image
retrieval ranking algorithms. This has shown to allow for different types of evidence
to be combined without complex algorithms. A proof-of-concept evidence combina-
tion experiment using text and colour content matching demonstrated the combina-
tion of the content and text-based techniques into the single visualisation. The sample
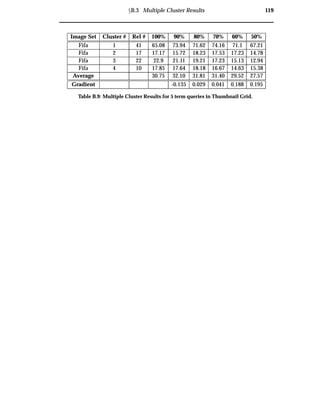
query separated and clustered the desired images using both content and text-based](https://image.slidesharecdn.com/721d17e9-3997-45df-83d5-6fd470fa9d7d-150913155104-lva1-app6891/85/Upstill_thesis_2000-114-320.jpg)
![Ü7.3 Control 103
matching.
7.3 Control
7.3.1 Inexpressive Query Language
Current WWW search engines limit the user’s ability to specify their exact image need. For
example, because image analysis is costly, most systems do not allow users to specify image
content criteria. Further, a reduction of effectiveness is observed during the scaling of these
techniques across large breadth collections [56]. (from section 4.5.3)
Lack of Expression
The issue of data scalability is diminished by retrieving image domains for analysis.
The proof-of-concept evidence combination experiment demonstrated data scalability
using image domains.
Lack of Data Scalability
Through the flexible image retrieval and analysis module users are able to provide
analysis plugins. These plugins allow for the expression of any type of information.
The proof-of-concept evidence combination experiment demonstrates the use of mul-
tiple types of query criteria.
7.3.2 Coarse Grained Interaction
Current WWW search engines provide non-interactive interfaces to the retrieval process. This
provides users with minimal insight into how the retrieval process occurs and renders them
unable to focus a search on an interesting area of the result visualisation. (from section 4.5.4)
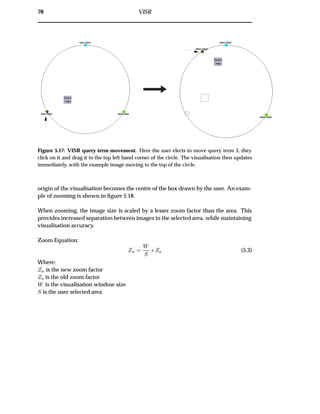
Coarse Grained Interaction
Finer grained interaction is facilitated through client-side analysis, visualisation and
interface. By locating the visualisation on the client-side, and using image domains,
the user’s changes are immediately reflected in the visualisation. Further evaluations
are required to evaluate the effectiveness of the dynamic query modification module.
Lack of Foraging Interaction
The transparent cluster visualisation and dynamic query interface enables users to
forage through the data set. Clustering has been shown to be more effective in VISR
than in tradition thumbnail grid implementations. This creates a number of groups of
images in the visualisation. When combined with the visualisation zooming capabili-
ties, these properties enable between and within patch foraging through the images.](https://image.slidesharecdn.com/721d17e9-3997-45df-83d5-6fd470fa9d7d-150913155104-lva1-app6891/85/Upstill_thesis_2000-115-320.jpg)

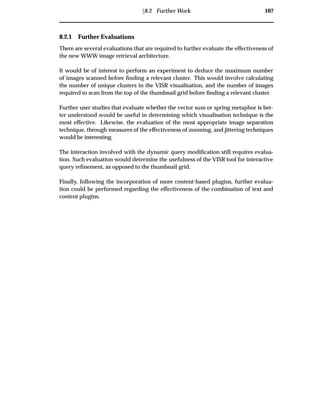

![Appendix A
Example Information Visualisation
Systems
A.1 Spring-based Information Visualisations
¯ VIBE: is a 2d spring-based cluster system that has been used for everything from
text-document viewing to plant-species clustering [49, 15, 36, 23]. VIBE allows
users to place keywords, documents or queries as vertices, or springs, in the vi-
sualisation, producing a query-to-document space. Problems arise with the po-
sition of a document in the space with over 3 vertices. Positions of documents in
the space are not unique, in that different combinations of forces could result in
them being at the same place in the system. To resolve these problems a dynamic
interface was created. However, this can cause user confusion. Korfhage [34] of-
fers criticism on his model and admits that it results in a loss of information in
return for greater control. Evaluations have shown that users have problems
interacting with the system and understanding its behaviour [45, 43, 44]. VIBE
was extended to 3d in the VR-VIBE project [6].
– WebVIBE is a cut-down version of VIBE, shown to be more effective un-
der user evaluation than previous VIBE models [45, 43, 44]. It supports
several WWW retrieval engines and runs as a client. The system uses vi-
sual metaphors, such as magnetism and animation, to aid user compre-
hension. WebVIBE is currently one of the only visualisations that runs in
a distributed client-server environment. A client-side java applet interacts
with current World-Wide Web search engines. Figure A.1 contains a screen-
shot from the WebVIBE system.
¯ LyberWorld is a 3d visualisation that was created in an attempt to rectify some of
the problems of the VIBE model [25, 24]. This visualisation combines cone-trees,
to view the conceptual query-to-query space [53], and a spring-based visuali-
sation, to view the query-to-document space. To extend the model offered by
VIBE, LyberWorld created a sphere upon which terms are placed. They argue
109](https://image.slidesharecdn.com/721d17e9-3997-45df-83d5-6fd470fa9d7d-150913155104-lva1-app6891/85/Upstill_thesis_2000-121-320.jpg)
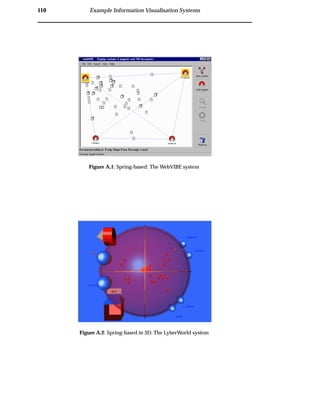
![ÜA.2 Venn-diagram based Information Visualisations 111
that this is an easier model for a user to understand, which allows for a higher
degree of freedom when moving around terms, and lessens the likelihood of
documents being misrepresented by adding an extra graphical dimension. Ly-
berWorld incorporates a dynamic query filter, based on the Bead relevance sphere
[9], that greys out less relevant documents. Figure A.2 contains a screenshot
from the LyberWorld system.
¯ Mitre [33] propose a 3d system that is similar to VIBE and LyberWorld. Their
system is based on a cube. Where the user adds keywords or document to its
sides. The documents are then plotted within the cube. There has been no eval-
uation of this system.
¯ Bead [9] represents documents as particles in 3d-space. Query terms defined
on Axes are used to differentiate documents. Interdocument similarity is calcu-
lated, with documents being repelled from each other unless they are related.
An interesting addition to the system is the sphere of interest dynamic query
interface. This enables users to decide which section of the system contains rel-
evant documents. Documents (particles) located outside the sphere are reduced
in intensity, so they are “noticeable but not imposing”.
A.2 Venn-diagram based Information Visualisations
Figure A.3: Venn Diagram Based Example: The InfoCrystal system. In this example In-
foCrystal is being used to visualise the “A; B; C; D” query. Documents represented by a square
are related to all four query terms, while documents represented by triangles are related to
three query terms, rectangles two, and circles one.
¯ InfoCrystal [61] is the most popular Venn Diagram cluster model. InfoCrystal is
a 2D model that maintains the basic paradigm of vertexes having gravitational](https://image.slidesharecdn.com/721d17e9-3997-45df-83d5-6fd470fa9d7d-150913155104-lva1-app6891/85/Upstill_thesis_2000-123-320.jpg)
![112 Example Information Visualisation Systems
forces attached to them, presenting a query-to-document space. InfoCrystal ex-
tends this gravity model by showing how the relative forces from each node af-
fect the objects in the space. The InfoCrystal system extends the basic dynamic
query metaphor by allowing users to create and modify queries dynamically.
¯ VQuery [31] attempts to build on the InfoCrystal query generation system by
making the structure less complicated. VQuery implements a “Bookmarking”
like system, allowing the user to retrieve previously created query-sets.
A.3 Terrain-based Information Visualisations
¯ SOM is the acronym for a self-organizing semantic map. This visualisation uses
artificial neural networks to generate a map that shows the contents and struc-
ture of the document collection. This is similar to other cluster visualisations,
with a different dimension compression technique.
¯ ThemeScapes represents the clusters of documents as peaks in a terrain map.
Mountains represent dominant themes while valleys represent weak themes
[42]. Once again, this is similar to other cluster visualisations, with a different
dimension compression technique.
A.4 Other Information Visualisations
Figure A.4: The 3D version of the NIRVE system](https://image.slidesharecdn.com/721d17e9-3997-45df-83d5-6fd470fa9d7d-150913155104-lva1-app6891/85/Upstill_thesis_2000-124-320.jpg)
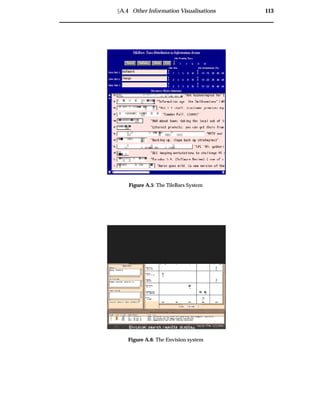
![114 Example Information Visualisation Systems
¯ Clustering Models:
NIRVE maps clusters of concepts onto a globe. The user maps related query
keywords into a concept (i.e ship, boat, freighter). Clusters are then created from
the document collection where documents that contain the same patterns of con-
cepts (depicted by a bar graph) are placed in the cluster. These cluster icons are
then represented on a globe where their latitude is determined by the number
of concepts contained in cluster (cluster containing most concepts placed at the
north pole). The cluster icons are then connected by an arc the colour of which is
determined by the term which makes them different. This visualisation shows
the query-to-document and conceptual document-to-document space. This sys-
tem does not allow for any dynamic queries.
¯ Histographic Models:
TileBars[22] is a histogram based visualisation, with each bar in the graph rep-
resenting the size of a document, and consisting of squares signifying the docu-
ment subsections. The frequency of terms appearing in each section is indicated
by the intensity of each tile. Hearst claims that by reducing the document into
its subsections the user can find, not only the related documents, but the re-
lated sections of the documents quickly. Veerasamy and Heikes [68, 67] present
a similar system to Hearst’s TileBars. Like TileBars, their Information Visual-
isation provides visual feedback from query results using a collection of bars.
However, unlike in TileBars, where bars are divided into document sections,
these bars signify the frequency of a query term in the entire document. The
bars are lined up against the query terms, to maximise screen usage.
¯ Graphical Plotting Models:
Envision[47, 62] is an interface that plots an x-y plane with evaluation criteria
placed on each axis. The shapes, sizes and colour of icons all represent quanti-
tative properties about the documents.](https://image.slidesharecdn.com/721d17e9-3997-45df-83d5-6fd470fa9d7d-150913155104-lva1-app6891/85/Upstill_thesis_2000-126-320.jpg)