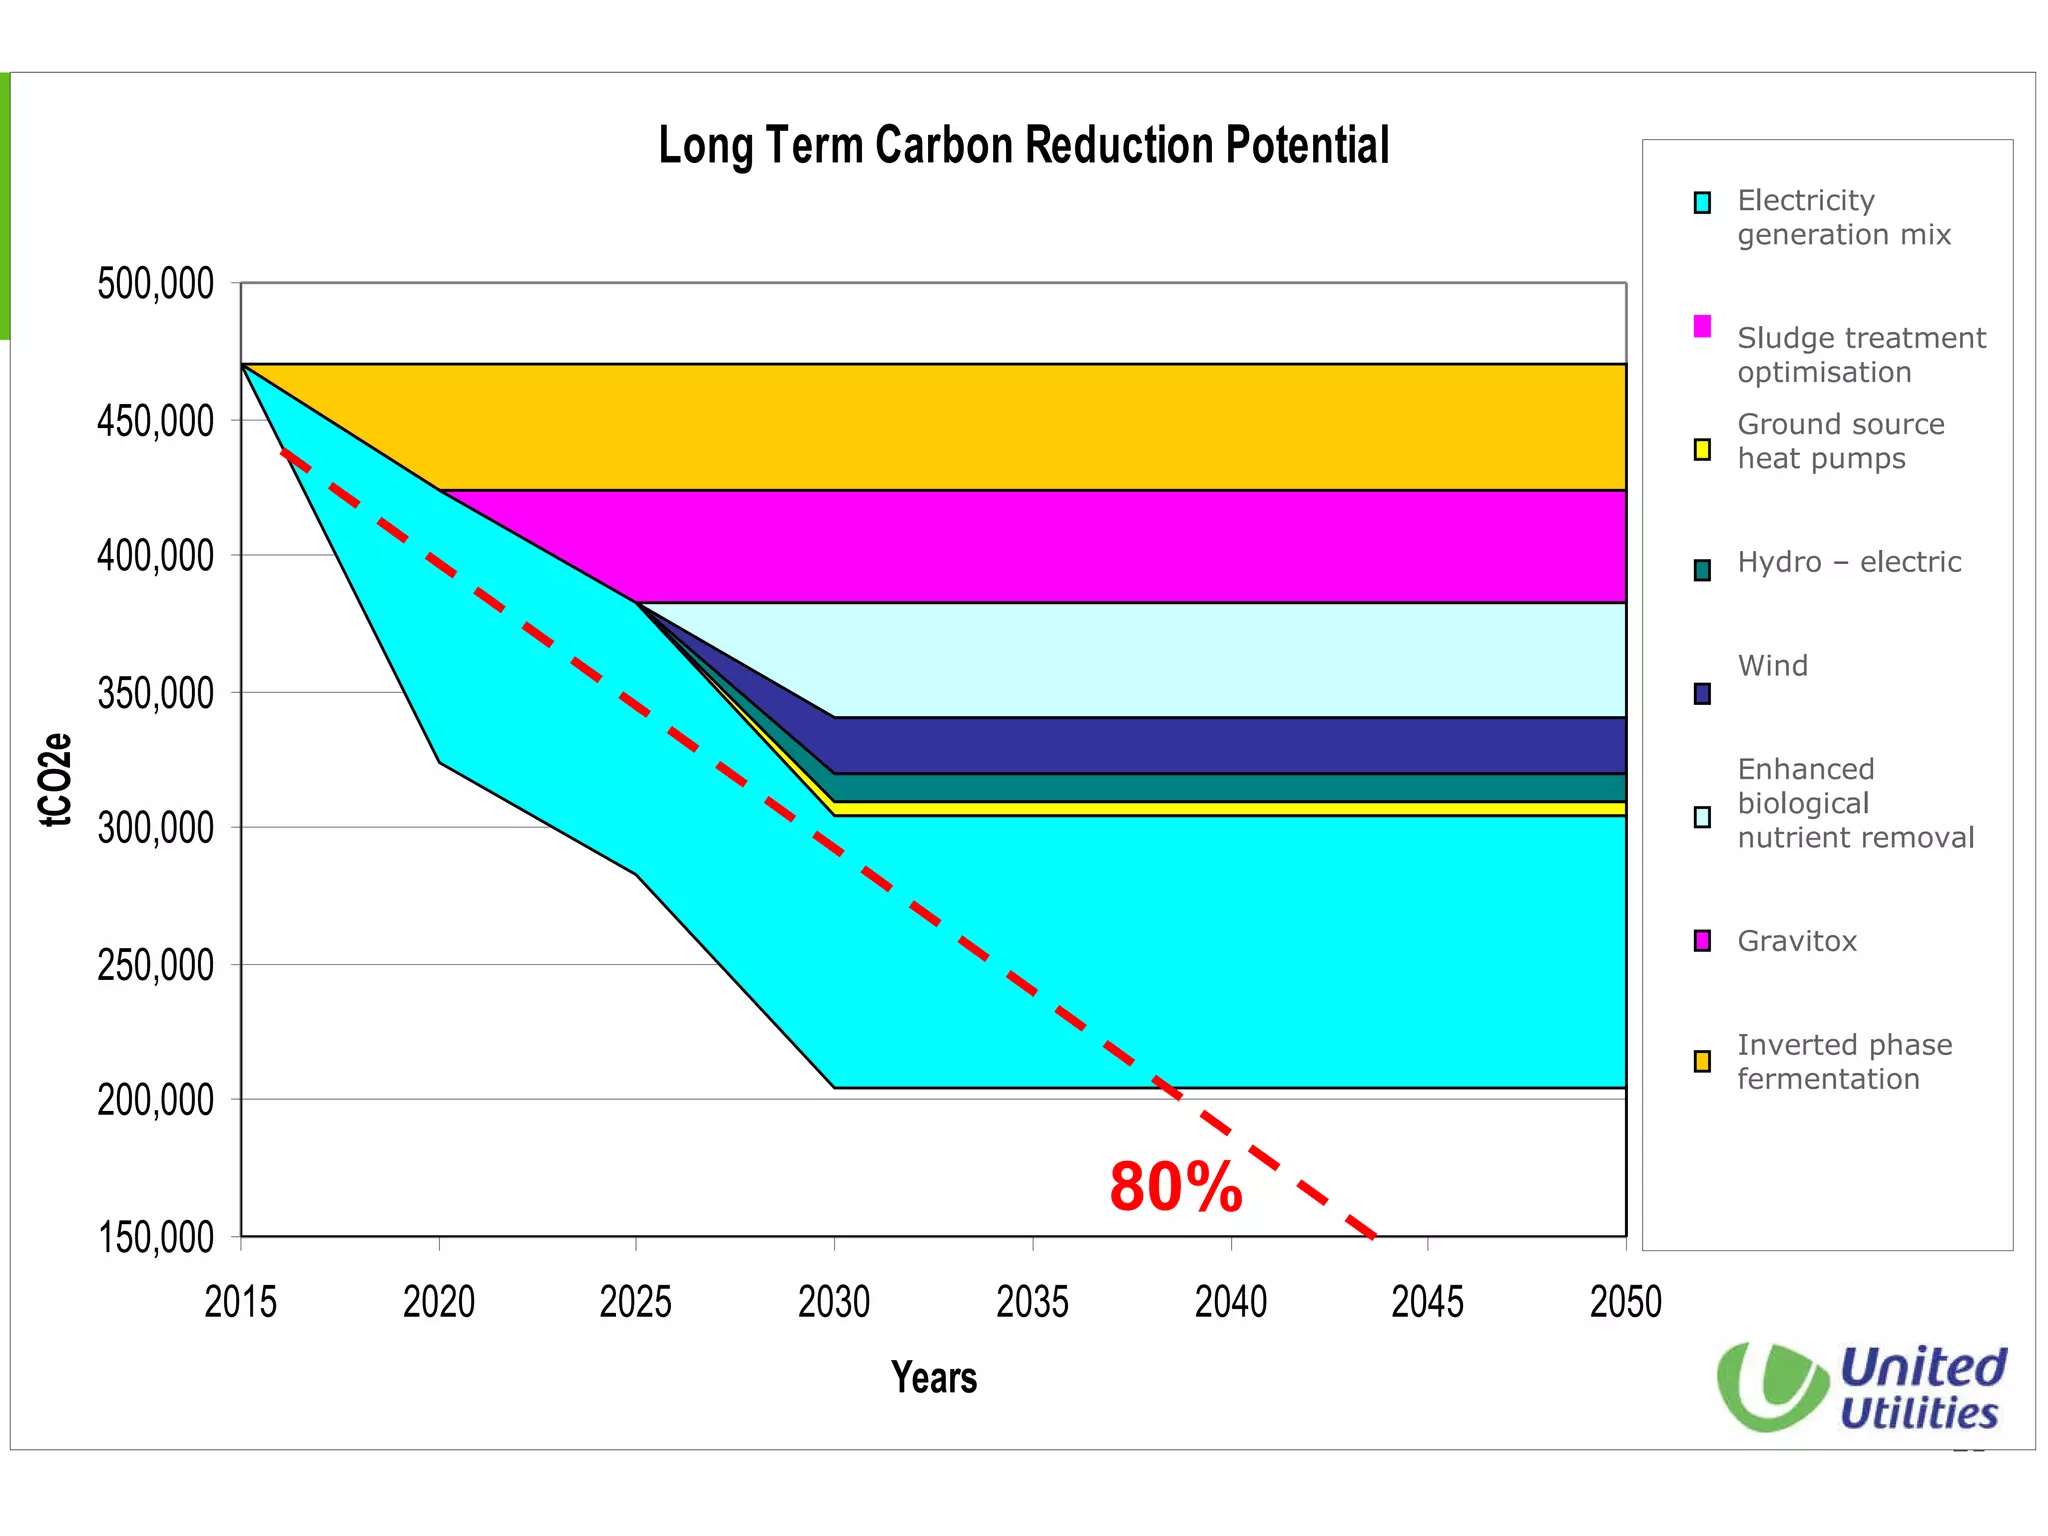
The document outlines United Utilities' sustainable development strategy focusing on carbon management and energy efficiency within the utility sector. It highlights current energy usage, carbon emissions, strategic goals for reducing carbon output, and the significant investments planned through AMP5 to meet long-term carbon reduction targets. The presentation emphasizes the importance of innovative technologies and operational efficiencies to achieve a more sustainable and environmentally responsible utility service.

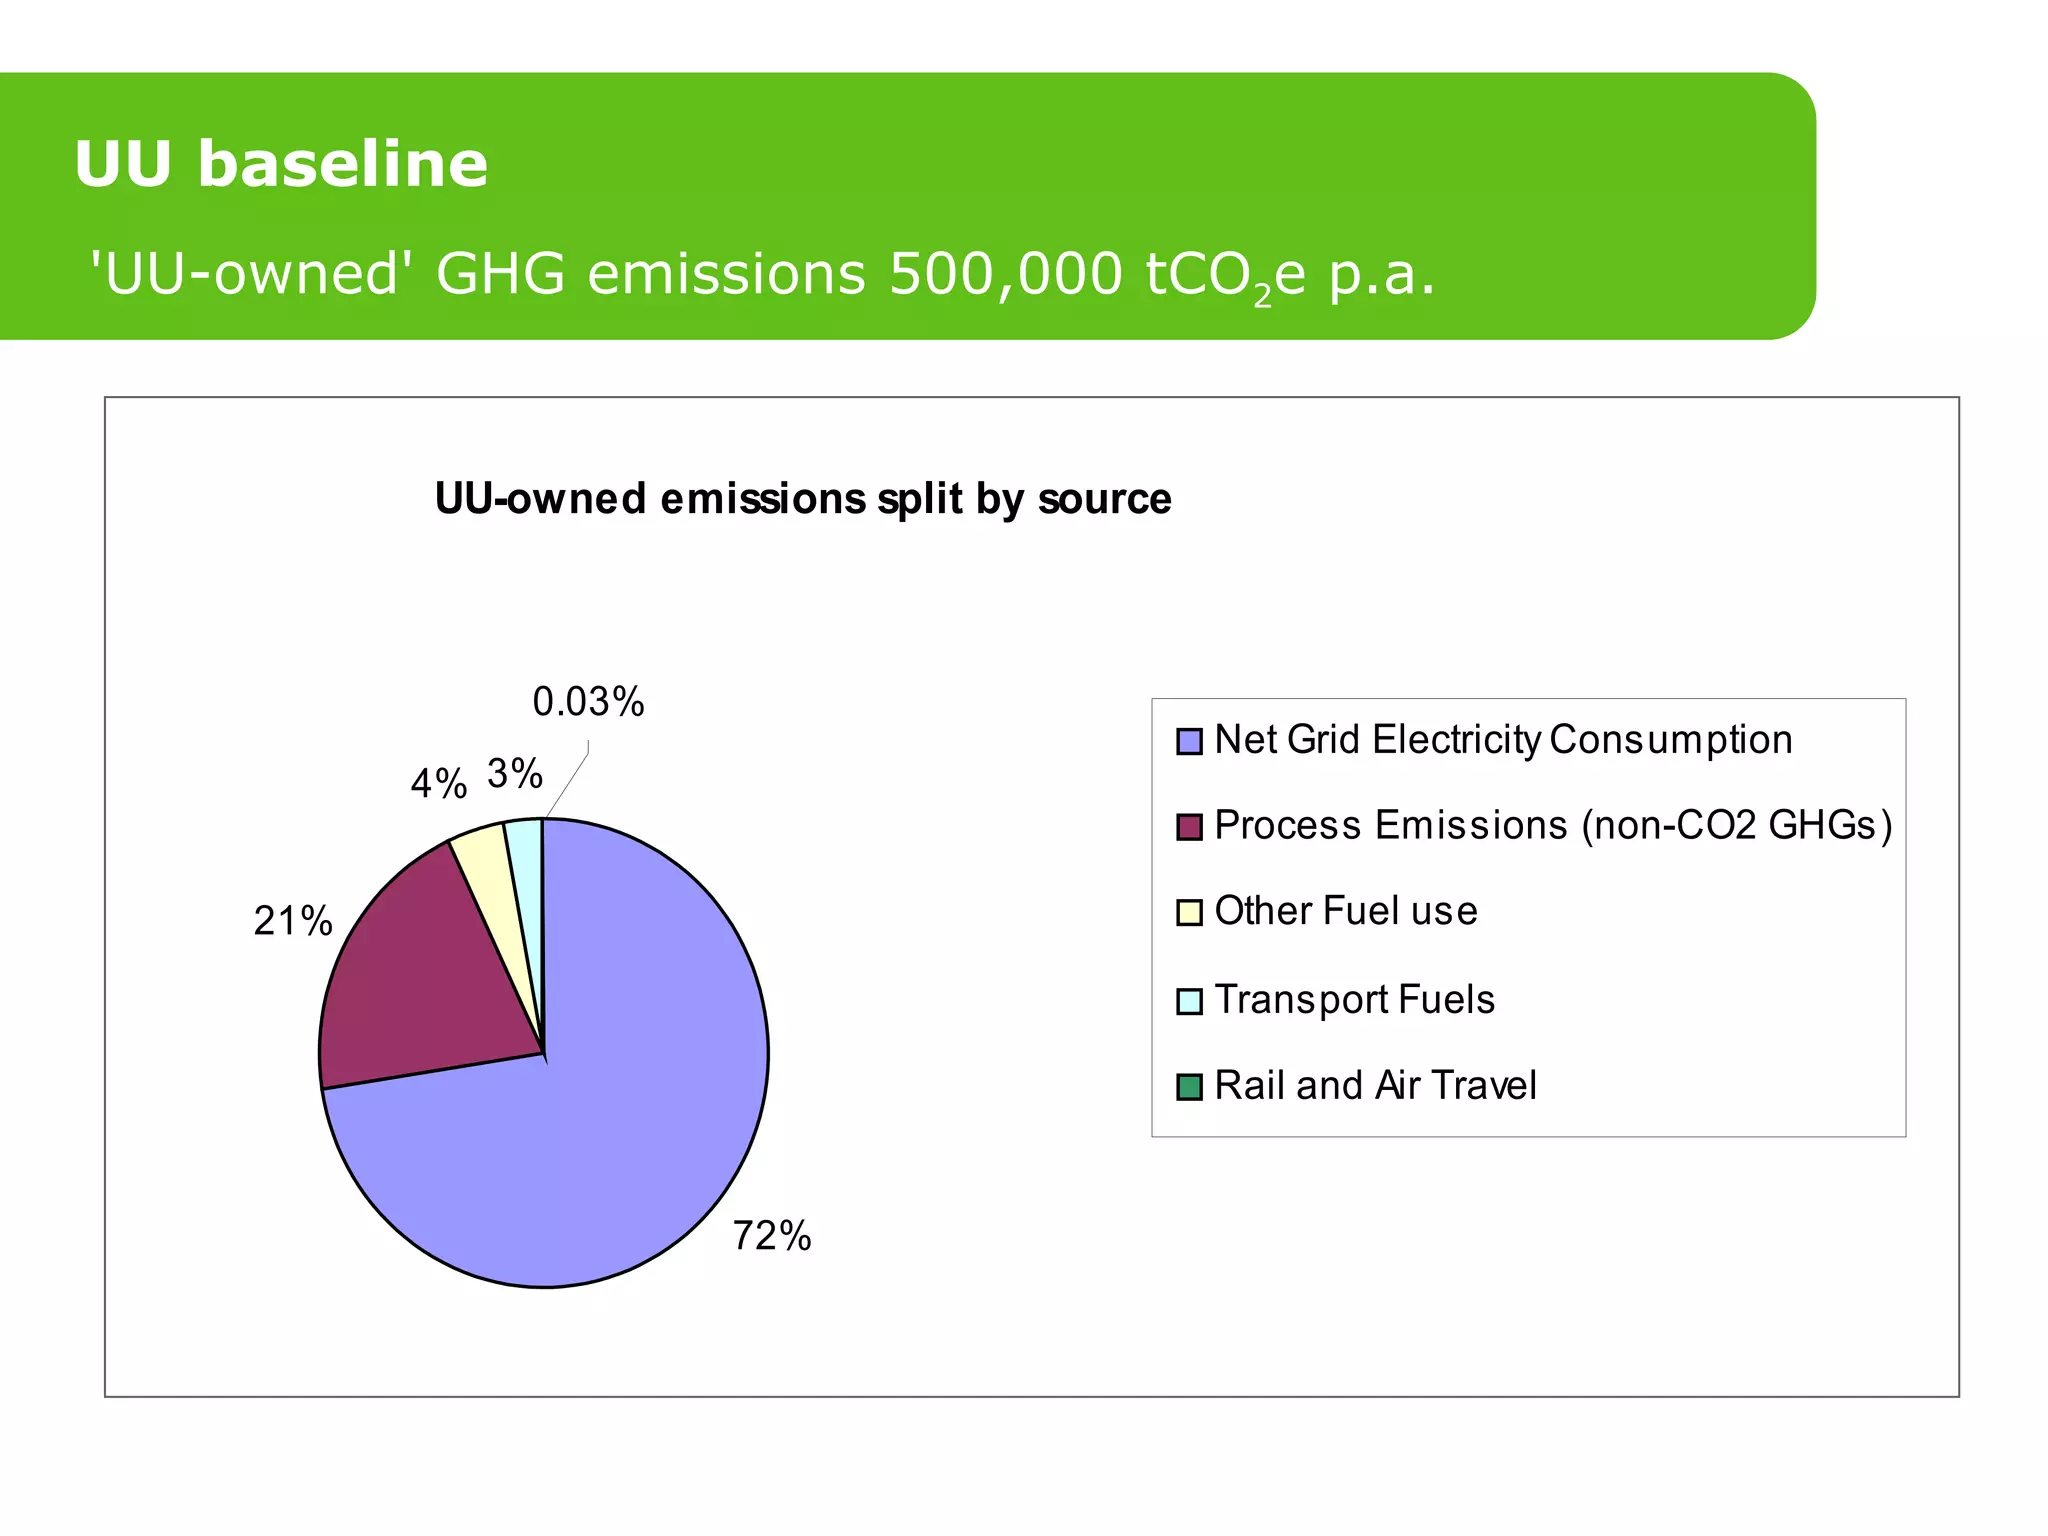
![Thank you [email_address]](https://image.slidesharecdn.com/unitiedutilitiesstevewhipp-100923044420-phpapp02/75/Sustainable-development-in-the-Utility-Sector-22-2048.jpg)


