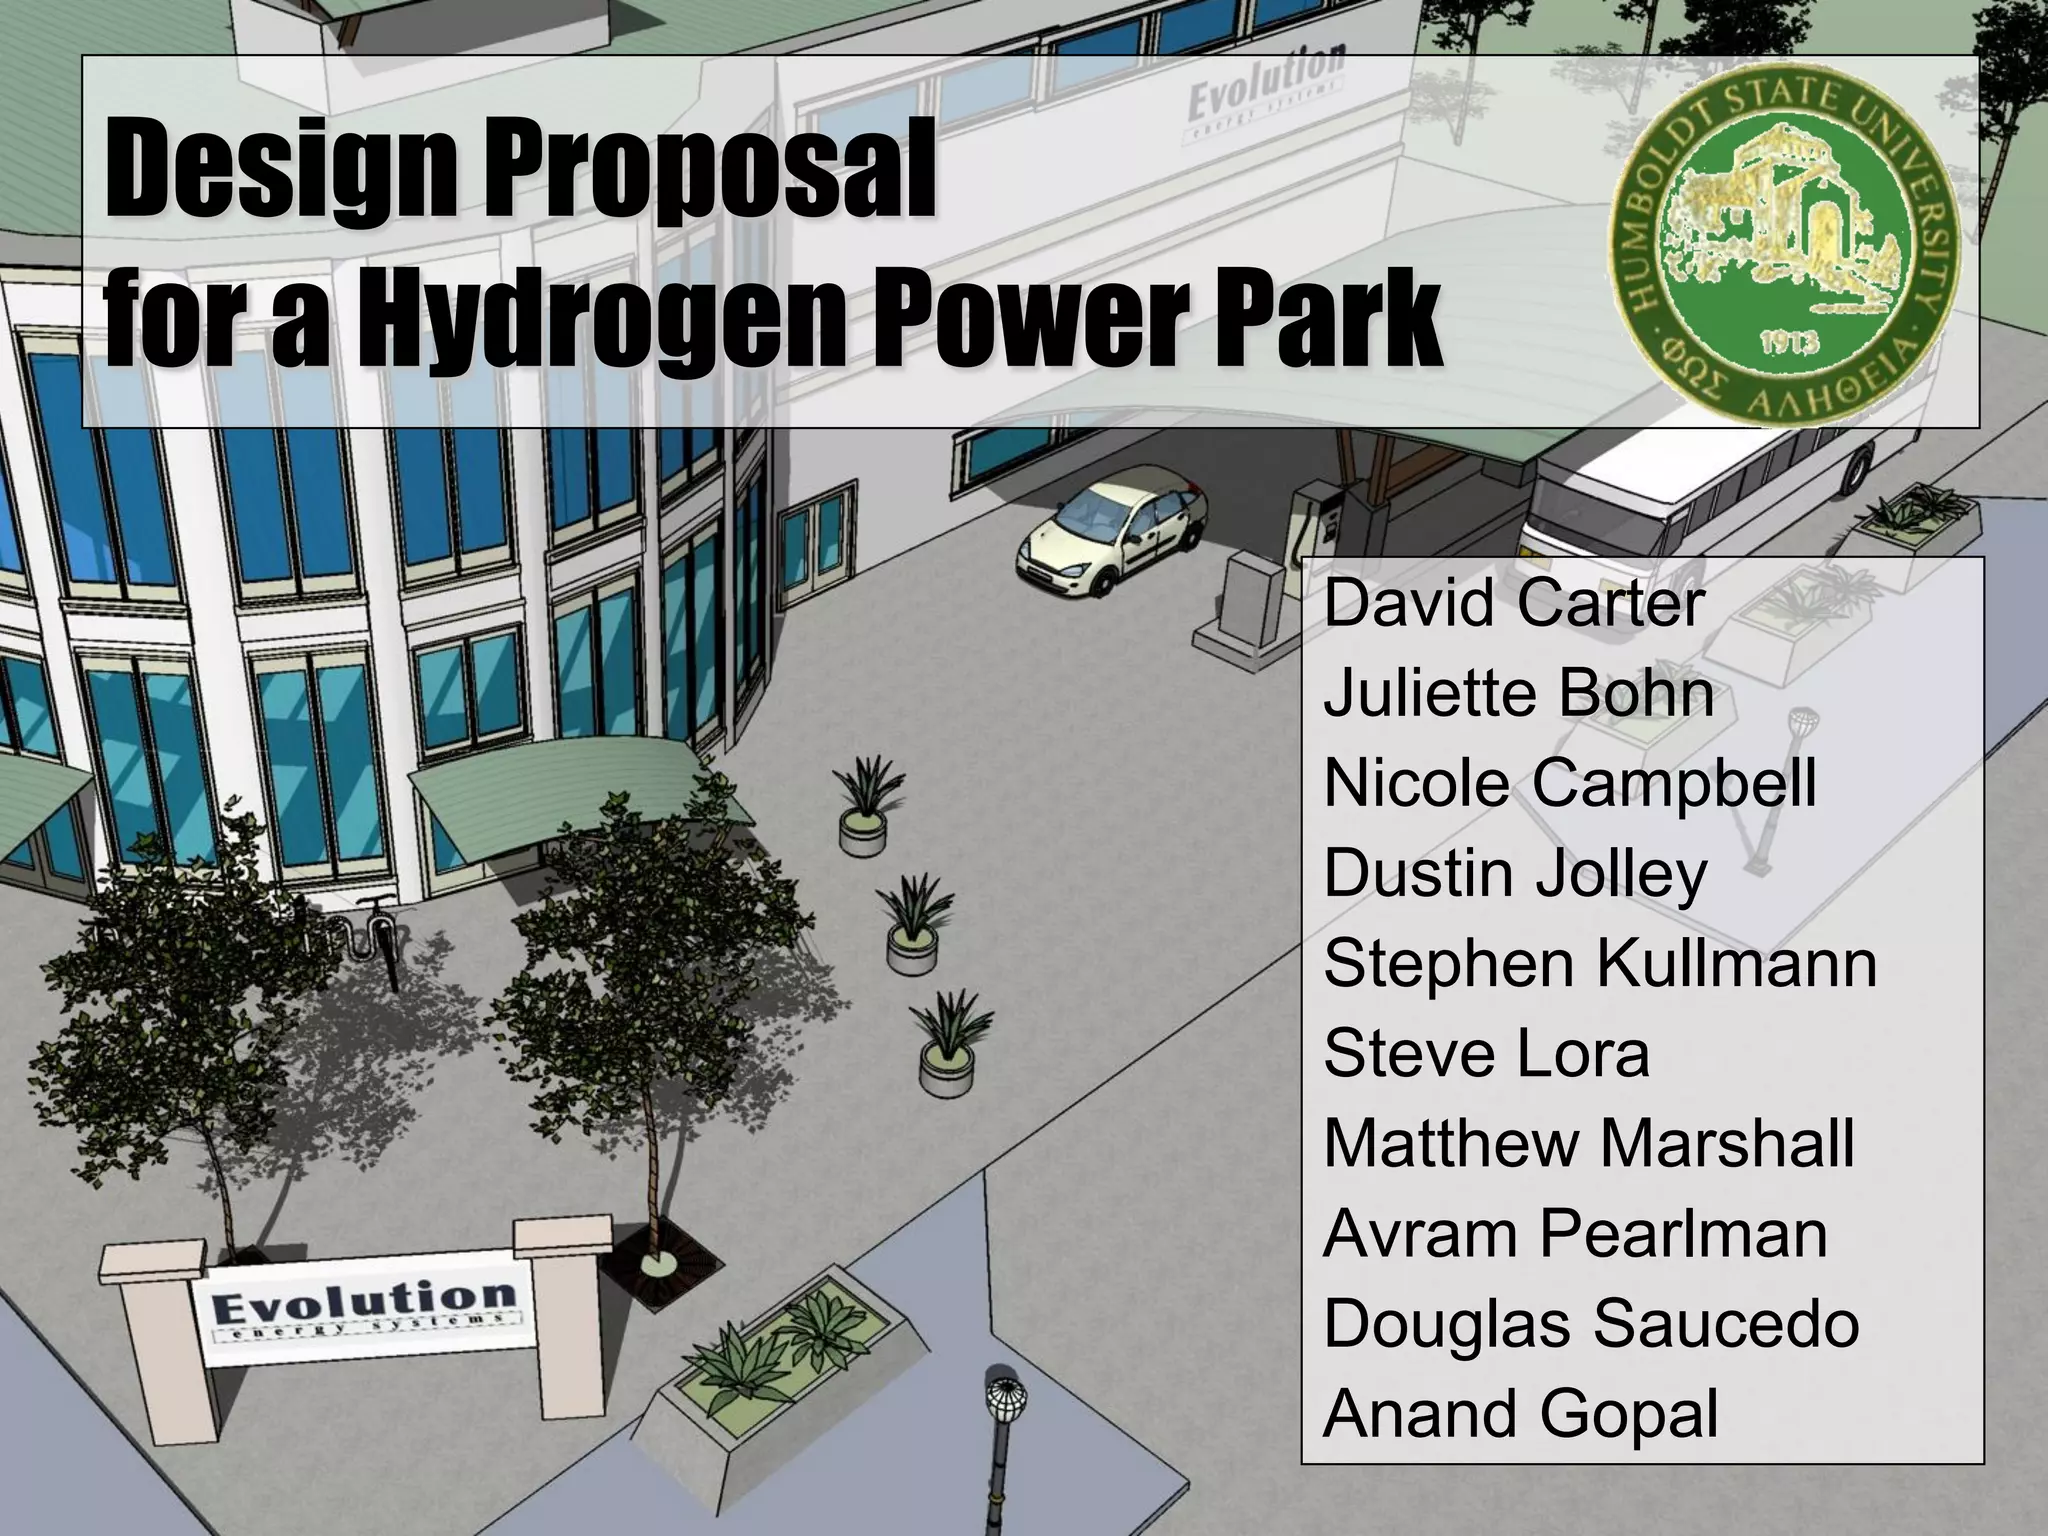
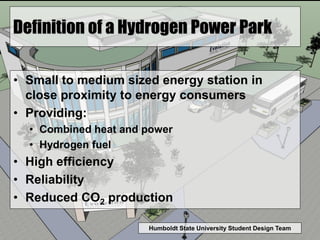
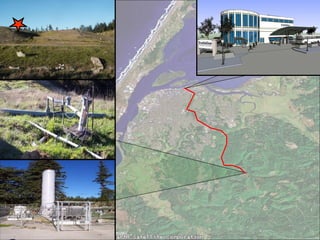
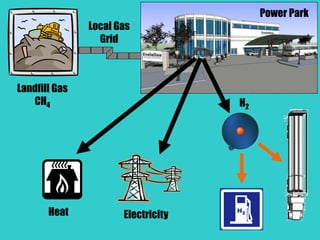
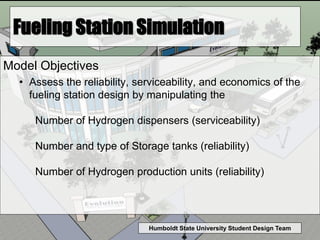
Humboldt State University Student Design Team
David Carter
Juliette Bohn
Nicole Campbell
Dustin Jolley
Stephen Kullmann
Steve Lora
Matthew Marshall
Avram Pearlman
Douglas Saucedo
Anand Gopal
Design Proposal
for a Hydrogen Power Park
Humboldt State University Student Design Team
Definition of a Hydrogen Power Park
• Small to medium sized energy station in
close proximity to energy consumers
• Providing:
• Combined heat and power
• Hydrogen fuel
• High efficiency
• Reliability
• Reduced CO2 production
Humboldt State University Student Design Team
Design Criteria
H2U Guidelines
•Minimum of 100 kW
Electrical Output
•Fueling
• 2010: 50 kg per day
• 2019: 250 kg per day
•21,000 ft2 footprint
•Onsite hydrogen
production
•Safety is paramount
Evolution Energy
Systems Criteria
•Renewable fuel source
•High efficiency
•Integrated into our local
community
•99.999% Fueling Reliability
Cummings Road
Landfill
Landfill Gas
CH4
Local Gas
Grid
Power Park
ElectricityHeat
H2
Humboldt State University Student Design TeamPlan view (Year 2019)
Humboldt State University Student Design Team
Fueling Station Simulation
Model Objectives
• Assess the reliability, serviceability, and economics of the
fueling station design by manipulating the
Number of Hydrogen dispensers (serviceability)
Number and type of Storage tanks (reliability)
Number of Hydrogen production units (reliability)
Humboldt State University Student Design Team
Fueling Station Simulation
Model Objectives
• Minimize System Lifecycle Costs (C)
subject to
• Fueling Reliability (R):
%999.99%100
arrived)vehicles(#
filled)vehicles(#
R
 

2019
2010YR
2019
2010YR
Costs)OperationlSPPW(AnnuaCosts)areSPPW(HardwminC
Humboldt State University Student Design Team
Fueling Station Simulation
Model Objectives
• Model Fueling Station Operations
• Vehicle arrival intensities
• Vehicle queuing characteristics
• Excess hydrogen production
Humboldt State University Student Design Team
Fueling Station Simulation
Simulation Methodology
• More details available through poster presentation
• Stochastic Queuing Theory Model
• Fueling Station – Vehicle Interactions
• Cascading Storage Algorithm
• Fueling Station – Hydrogen Storage Interactions
• Daily vehicle intensities increased annually
• 10 vehicles per day (2010)
• 46 vehicles per day (2019)
• One hydrogen bus (2010 – 2019)
• System evaluated every second over design horizon
Humboldt State University Student Design Team
Fueling Station Simulation
Simulation Results
• Equipment installation schedule over design horizon
• Station Serviceability (Design Year 2019)
• Approximately 17,000 vehicles serviced
• 28 vehicles waited with an average wait time of 2 minutes
• Daily Average: 45 vehicles and 1 Bus
• Maximum Observed Intensity: 11 vehicles in an hour
• Excess Hydrogen production (Design Year 2019)
• Daily Average: 38.8 kg-H2
0
10
20
30
40
50
60
0
4
8
12
16
20
24
28
32
36
40
44
48
52
56
60
64
68
72
vehicles/day
Frequency
0%
20%
40%
60%
80%
100%
CumulativeProbability
Frequency Cumulative %
0
1
2
3
4
5
6
7
8
0 30 60 90 120 150 180 210 240 270 300 More
sec/queue
Frequency
0%
10%
20%
30%
40%
50%
60%
70%
80%
90%
100%
CumulativeProbability
Frequency Cumulative %
Humboldt State University Student Design Team
Fueling Station Animation
Humboldt State University Student Design Team
Safety Analysis
Building Codes
FMEA
Humboldt State University Student Design Team
Safety Analysis
tural Disasters
Local Fire Dept. Approval
Humboldt State University Student Design Team
Environmental Analysis
CEQA Compliance
• Draft Environmental Impact Report
Electricity produced with 40% less CO2
emissions when compared to
conventional electricity generation
technology
Marketing and Education
Adaptive Management Plan
• Implement education/awareness programs
• Address outcomes
• Adapt programs
Marketing Campaign
• Industrial Revolution – Industrial Evolution
“There is no Revolution - Only Evolution”
Other, $308
Fuel Cells
$750 K
FC Core
Replacement
$500 K
PSAs $240 K
Compressors
$170 K
Plumbing
$118 K
Dispensers
$97 K
City lot
$84 K
Building
costs
$1,456 K
Total Discounted Capital Investment: $3.2 million
1511 kW CH4
84 kW In-house loads
415 kW H2 Fuel
442 kW electricity:
$0.09 / kWh
133 kW heat:
$0.60 / therm
Power Park Energy Balance (Year 2019)
Net system efficiency:
%66
1511
415442133



kW
kWkWkW

Research grade
H2 Sales $604 K
H2 Vehicle
Fuel $193 K
Process Heat
Revenues $24 K
Electricity
$297 K
Fuel $195 K
Continual
Costs
$177 K
O&M
$36 K
Operating Costs and Revenues (Year 2019)
Expenses
Revenues
Results Of Economic Analysis
• “Six nines” H2: $39 - $47 per kg delivered
• By selling excess H2 for $47/kg in Silicon
Valley, we can sell H2 for $2.50/kg at the
pump.
Humboldt State University Student Design Team
Questions ?

Humboldt State University Presentation (2005)

  • 1.
    Humboldt State UniversityStudent Design Team David Carter Juliette Bohn Nicole Campbell Dustin Jolley Stephen Kullmann Steve Lora Matthew Marshall Avram Pearlman Douglas Saucedo Anand Gopal Design Proposal for a Hydrogen Power Park
  • 2.
    Humboldt State UniversityStudent Design Team Definition of a Hydrogen Power Park • Small to medium sized energy station in close proximity to energy consumers • Providing: • Combined heat and power • Hydrogen fuel • High efficiency • Reliability • Reduced CO2 production
  • 3.
    Humboldt State UniversityStudent Design Team Design Criteria H2U Guidelines •Minimum of 100 kW Electrical Output •Fueling • 2010: 50 kg per day • 2019: 250 kg per day •21,000 ft2 footprint •Onsite hydrogen production •Safety is paramount Evolution Energy Systems Criteria •Renewable fuel source •High efficiency •Integrated into our local community •99.999% Fueling Reliability
  • 4.
  • 5.
  • 6.
    Humboldt State UniversityStudent Design TeamPlan view (Year 2019)
  • 7.
    Humboldt State UniversityStudent Design Team Fueling Station Simulation Model Objectives • Assess the reliability, serviceability, and economics of the fueling station design by manipulating the Number of Hydrogen dispensers (serviceability) Number and type of Storage tanks (reliability) Number of Hydrogen production units (reliability)
  • 8.
    Humboldt State UniversityStudent Design Team Fueling Station Simulation Model Objectives • Minimize System Lifecycle Costs (C) subject to • Fueling Reliability (R): %999.99%100 arrived)vehicles(# filled)vehicles(# R    2019 2010YR 2019 2010YR Costs)OperationlSPPW(AnnuaCosts)areSPPW(HardwminC
  • 9.
    Humboldt State UniversityStudent Design Team Fueling Station Simulation Model Objectives • Model Fueling Station Operations • Vehicle arrival intensities • Vehicle queuing characteristics • Excess hydrogen production
  • 10.
    Humboldt State UniversityStudent Design Team Fueling Station Simulation Simulation Methodology • More details available through poster presentation • Stochastic Queuing Theory Model • Fueling Station – Vehicle Interactions • Cascading Storage Algorithm • Fueling Station – Hydrogen Storage Interactions • Daily vehicle intensities increased annually • 10 vehicles per day (2010) • 46 vehicles per day (2019) • One hydrogen bus (2010 – 2019) • System evaluated every second over design horizon
  • 11.
    Humboldt State UniversityStudent Design Team Fueling Station Simulation Simulation Results • Equipment installation schedule over design horizon • Station Serviceability (Design Year 2019) • Approximately 17,000 vehicles serviced • 28 vehicles waited with an average wait time of 2 minutes • Daily Average: 45 vehicles and 1 Bus • Maximum Observed Intensity: 11 vehicles in an hour • Excess Hydrogen production (Design Year 2019) • Daily Average: 38.8 kg-H2 0 10 20 30 40 50 60 0 4 8 12 16 20 24 28 32 36 40 44 48 52 56 60 64 68 72 vehicles/day Frequency 0% 20% 40% 60% 80% 100% CumulativeProbability Frequency Cumulative % 0 1 2 3 4 5 6 7 8 0 30 60 90 120 150 180 210 240 270 300 More sec/queue Frequency 0% 10% 20% 30% 40% 50% 60% 70% 80% 90% 100% CumulativeProbability Frequency Cumulative %
  • 12.
    Humboldt State UniversityStudent Design Team Fueling Station Animation
  • 13.
    Humboldt State UniversityStudent Design Team Safety Analysis Building Codes FMEA
  • 14.
    Humboldt State UniversityStudent Design Team Safety Analysis tural Disasters Local Fire Dept. Approval
  • 15.
    Humboldt State UniversityStudent Design Team Environmental Analysis CEQA Compliance • Draft Environmental Impact Report Electricity produced with 40% less CO2 emissions when compared to conventional electricity generation technology
  • 16.
    Marketing and Education AdaptiveManagement Plan • Implement education/awareness programs • Address outcomes • Adapt programs Marketing Campaign • Industrial Revolution – Industrial Evolution “There is no Revolution - Only Evolution”
  • 17.
    Other, $308 Fuel Cells $750K FC Core Replacement $500 K PSAs $240 K Compressors $170 K Plumbing $118 K Dispensers $97 K City lot $84 K Building costs $1,456 K Total Discounted Capital Investment: $3.2 million
  • 18.
    1511 kW CH4 84kW In-house loads 415 kW H2 Fuel 442 kW electricity: $0.09 / kWh 133 kW heat: $0.60 / therm Power Park Energy Balance (Year 2019) Net system efficiency: %66 1511 415442133    kW kWkWkW 
  • 19.
    Research grade H2 Sales$604 K H2 Vehicle Fuel $193 K Process Heat Revenues $24 K Electricity $297 K Fuel $195 K Continual Costs $177 K O&M $36 K Operating Costs and Revenues (Year 2019) Expenses Revenues
  • 20.
    Results Of EconomicAnalysis • “Six nines” H2: $39 - $47 per kg delivered • By selling excess H2 for $47/kg in Silicon Valley, we can sell H2 for $2.50/kg at the pump.
  • 21.
    Humboldt State UniversityStudent Design Team Questions ?