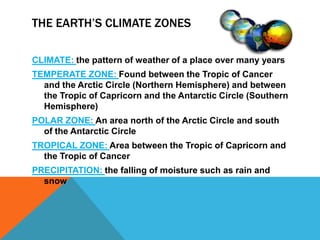
The document discusses the three main climate zones: temperate, polar, and tropical. It defines climate as the pattern of weather over many years for a particular place. The temperate zone exists between the Tropic of Cancer and Arctic Circle in the Northern Hemisphere and between the Tropic of Capricorn and Antarctic Circle in the Southern Hemisphere. The polar zone is the area north of the Arctic Circle and south of the Antarctic Circle. The tropical zone exists between the Tropic of Capricorn and Tropic of Cancer.
Ruth Hall is a professor at the Institute for Poverty, Land and Agrarian Studies (PLAAS) at the University of the Western Cape, South Africa, and has worked on land reform, land rights and land governance in South Africa and beyond. She is a regional coordinator of the Future Agricultures Consortium, in partnership with IDS and others.
A talk based on a short book written with Carl Lee
Maps by Benjamin Hennig
Danny Dorling
University of Oxford, School of Geography & Environment
November 8th, 2017
Population Geography. Second Year of Secondary School. This unit was created in the School Year 2020-2021. It was designed in Valencia, for the IES Juan de Garay's students. Teacher: Pau Tobar.
Policy Seminar “Boserup and Beyond Mounting Land Pressures & Development Strategies in Africa” at IFPRI on 4 September 2014. Presentation by Derek Headey, Senior Research Fellow in the Poverty, Health and Nutrition Division, IFPRI.
Problems 451in the box Determinants of Cooperation.” T.docxaryan532920
Problems 451
in the box “Determinants of Cooperation.”
Then tell them to imagine they are the proposer,
that the responder is someone from their own
economic and social group, and that the sum of
money to be divided is $1,000. Ask them what
division they would propose and why. Report
the results of your survey, and then draw con-
clusions about what explains differences among
your respondents regarding their proposed
divisions.
For additional exploration and practice using the Online Data Plotter and data sets, please visit
www.pearsoninternationaleditions.com/weil.
452
In examining the fundamental determinants of income differences among countries, we have repeatedly grappled with the issue of whether the vari-
ables we were measuring were really so fundamental. How can we be sure
that the nature of a country’s government determines its level of income,
for example, when there is also a compelling case that income affects gov-
ernment? The same holds true for income inequality and for culture.
In this chapter we look at a set of potential determinants of income—
geography, climate, and natural resources—that are clearly immune to this
problem. As we shall see, however, our difficulties are not completely behind us.
To give a preview, Figure 15.1 shows a scatter plot comparing income per capita
and a nation’s latitude—that is, its distance from the equator. There is clearly a
strong relationship in the data: The farther a country is from the equator, the
richer it is, on average. Further, there is certainly no danger of “reverse causa-
tion,” that is, no risk that the relationship in the data occurs because becom-
ing rich causes a country to move farther from the equator. But what does the
relationship between income and latitude tell us? What economic machinery
underlies this relationship?
In this chapter we examine data on how geography, climate, and natural re-
sources differ among countries. We will see that there are good theoretical reasons
why each of these characteristics should affect income. In the case of two of these
characteristics—geography and climate—we will also find good empirical evi-
dence that the effect is significant. We will also see how these characteristics have
been incorporated into theories of why the Eurasian landmass developed before
the rest of the world and into two different explanations for why Europe developed
before China.
One conclusion from this chapter is that the natural resources available in
a given country today are not a great constraint on growth because countries
can import resources from abroad. But this finding leaves open the question of
whether the availability of resources at the world level may not constrain world-
wide growth. We return to this topic in Chapter 16.
GEOGRAPHY, CLIMATE,
AND NATURAL RESOURCES
15C H A P T E R
Geography is destiny.
—Napoleon Bonaparte
15.1 Geography 453
15.1 GEOGRAPHY
The population of the world passed the 7 bi ...
Modelling urban dynamics - moving cities
Erasmus Intensive Programme (IP)
Agents-based modeling for processes and dynamics in landscape geography
17 February until 2 March 2013
At AGROCAMPUS OUEST ANGERS - France
Desertification - The Horn Of Africa Experiencing Serious DroughtChristina Parmionova
Desertification is the degradation of land in arid and dry sub-humid areas, resulting primarily from man-made activities and influenced by climatic variations. It is principally caused by overgrazing, overdrafting of groundwater and diversion of water from rivers for human consumption and industrial use, all of these processes fundamentally driven by overpopulation.
A major impact of desertification is biodiversity loss and loss of productive capacity, for example, by transition from land dominated by shrublands to non-native grasslands. In the semi-arid regions of southern California, many coastal sage scrub and chaparral ecosystems have been replaced by non-native, invasive grasses due to the shortening of fire return intervals. This can create a monoculture of annual grass that cannot support the wide range of animals once found in the original ecosystem. In Madagascar's central highland plateau, 10% of the entire country has been lost to desertification due to slash and burn agriculture by indigenous peoples. In Africa, if current trends of soil degradation continue, the continent will be able to feed only 25% of its population by 2025, according to UNU's Ghana-based Institute for Natural Resources in Africa. Globally, desertification claims a Nebraska-sized area of productive capacity each year.
Sugar as Citizen Relationship Management | SugarCon 2011SugarCRM
By extending CRM to mean Citizen Relationship Manangement it is possible to systematically improve the flows of information between governments and their citizens. This extension can include employment, medical infrastructure (especially during epidemics), disaster recovery, education and voting. Examples are drawn from current situations in Sudan, Tunisia, Haiti, Ireland and the Ivory Coast.
Presented by Peter Zoll, CIO, I-MAG STS Corp., at SugarCon 2011.
"Impact of front-end architecture on development cost", Viktor TurskyiFwdays
I have heard many times that architecture is not important for the front-end. Also, many times I have seen how developers implement features on the front-end just following the standard rules for a framework and think that this is enough to successfully launch the project, and then the project fails. How to prevent this and what approach to choose? I have launched dozens of complex projects and during the talk we will analyze which approaches have worked for me and which have not.
State of ICS and IoT Cyber Threat Landscape Report 2024 previewPrayukth K V
The IoT and OT threat landscape report has been prepared by the Threat Research Team at Sectrio using data from Sectrio, cyber threat intelligence farming facilities spread across over 85 cities around the world. In addition, Sectrio also runs AI-based advanced threat and payload engagement facilities that serve as sinks to attract and engage sophisticated threat actors, and newer malware including new variants and latent threats that are at an earlier stage of development.
The latest edition of the OT/ICS and IoT security Threat Landscape Report 2024 also covers:
State of global ICS asset and network exposure
Sectoral targets and attacks as well as the cost of ransom
Global APT activity, AI usage, actor and tactic profiles, and implications
Rise in volumes of AI-powered cyberattacks
Major cyber events in 2024
Malware and malicious payload trends
Cyberattack types and targets
Vulnerability exploit attempts on CVEs
Attacks on counties – USA
Expansion of bot farms – how, where, and why
In-depth analysis of the cyber threat landscape across North America, South America, Europe, APAC, and the Middle East
Why are attacks on smart factories rising?
Cyber risk predictions
Axis of attacks – Europe
Systemic attacks in the Middle East
Download the full report from here:
https://sectrio.com/resources/ot-threat-landscape-reports/sectrio-releases-ot-ics-and-iot-security-threat-landscape-report-2024/
JMeter webinar - integration with InfluxDB and GrafanaRTTS
Watch this recorded webinar about real-time monitoring of application performance. See how to integrate Apache JMeter, the open-source leader in performance testing, with InfluxDB, the open-source time-series database, and Grafana, the open-source analytics and visualization application.
In this webinar, we will review the benefits of leveraging InfluxDB and Grafana when executing load tests and demonstrate how these tools are used to visualize performance metrics.
Length: 30 minutes
Session Overview
-------------------------------------------
During this webinar, we will cover the following topics while demonstrating the integrations of JMeter, InfluxDB and Grafana:
- What out-of-the-box solutions are available for real-time monitoring JMeter tests?
- What are the benefits of integrating InfluxDB and Grafana into the load testing stack?
- Which features are provided by Grafana?
- Demonstration of InfluxDB and Grafana using a practice web application
To view the webinar recording, go to:
https://www.rttsweb.com/jmeter-integration-webinar
Let's dive deeper into the world of ODC! Ricardo Alves (OutSystems) will join us to tell all about the new Data Fabric. After that, Sezen de Bruijn (OutSystems) will get into the details on how to best design a sturdy architecture within ODC.
UiPath Test Automation using UiPath Test Suite series, part 3DianaGray10
Welcome to UiPath Test Automation using UiPath Test Suite series part 3. In this session, we will cover desktop automation along with UI automation.
Topics covered:
UI automation Introduction,
UI automation Sample
Desktop automation flow
Pradeep Chinnala, Senior Consultant Automation Developer @WonderBotz and UiPath MVP
Deepak Rai, Automation Practice Lead, Boundaryless Group and UiPath MVP
PHP Frameworks: I want to break free (IPC Berlin 2024)Ralf Eggert
In this presentation, we examine the challenges and limitations of relying too heavily on PHP frameworks in web development. We discuss the history of PHP and its frameworks to understand how this dependence has evolved. The focus will be on providing concrete tips and strategies to reduce reliance on these frameworks, based on real-world examples and practical considerations. The goal is to equip developers with the skills and knowledge to create more flexible and future-proof web applications. We'll explore the importance of maintaining autonomy in a rapidly changing tech landscape and how to make informed decisions in PHP development.
This talk is aimed at encouraging a more independent approach to using PHP frameworks, moving towards a more flexible and future-proof approach to PHP development.
DevOps and Testing slides at DASA ConnectKari Kakkonen
My and Rik Marselis slides at 30.5.2024 DASA Connect conference. We discuss about what is testing, then what is agile testing and finally what is Testing in DevOps. Finally we had lovely workshop with the participants trying to find out different ways to think about quality and testing in different parts of the DevOps infinity loop.
GDG Cloud Southlake #33: Boule & Rebala: Effective AppSec in SDLC using Deplo...James Anderson
Effective Application Security in Software Delivery lifecycle using Deployment Firewall and DBOM
The modern software delivery process (or the CI/CD process) includes many tools, distributed teams, open-source code, and cloud platforms. Constant focus on speed to release software to market, along with the traditional slow and manual security checks has caused gaps in continuous security as an important piece in the software supply chain. Today organizations feel more susceptible to external and internal cyber threats due to the vast attack surface in their applications supply chain and the lack of end-to-end governance and risk management.
The software team must secure its software delivery process to avoid vulnerability and security breaches. This needs to be achieved with existing tool chains and without extensive rework of the delivery processes. This talk will present strategies and techniques for providing visibility into the true risk of the existing vulnerabilities, preventing the introduction of security issues in the software, resolving vulnerabilities in production environments quickly, and capturing the deployment bill of materials (DBOM).
Speakers:
Bob Boule
Robert Boule is a technology enthusiast with PASSION for technology and making things work along with a knack for helping others understand how things work. He comes with around 20 years of solution engineering experience in application security, software continuous delivery, and SaaS platforms. He is known for his dynamic presentations in CI/CD and application security integrated in software delivery lifecycle.
Gopinath Rebala
Gopinath Rebala is the CTO of OpsMx, where he has overall responsibility for the machine learning and data processing architectures for Secure Software Delivery. Gopi also has a strong connection with our customers, leading design and architecture for strategic implementations. Gopi is a frequent speaker and well-known leader in continuous delivery and integrating security into software delivery.
GDG Cloud Southlake #33: Boule & Rebala: Effective AppSec in SDLC using Deplo...
Unit One Notes 2
1. The Earth’s Climate Zones CLIMATE: the pattern of weather of a place over many years TEMPERATE ZONE: Found between the Tropic of Cancer and the Arctic Circle (Northern Hemisphere) and between the Tropic of Capricorn and the Antarctic Circle (Southern Hemisphere) POLAR ZONE: An area north of the Arctic Circle and south of the Antarctic Circle TROPICAL ZONE: Area between the Tropic of Capricorn and the Tropic of Cancer PRECIPITATION: the falling of moisture such as rain and snow
2. Climate zones Atlas: Page 128 You will need: Red, Blue, Green colors Label and write latitudes for: Equator Tropic of Cancer Tropic of Capricorn Arctic Circle Antarctic Circle Using your definitions, color in the three Climate Zones. Use this key: Temperate: Green Polar: Blue Tropical: Red
3. Honduras Guatemala El Salvador Barbados Fiji Colombia Ecuador Panama Nicaragua Namibia Ghana Senegal 13. South Africa 14. Mozambique 15. Uganda 16. Kenya 17. Eritrea 18. Pakistan 19. Moldova 20. Solomon Islands 21. Jamaica Country List
5. Climate Geographers divide earth into climate zones Each zone has a different pattern of precipitation and temperature This pattern is shown on a climagraph Bars show monthly precipitation Curved line shows temperature per month
6. 12 different Climate zones Ice Cap Subarctic Marine West Coast Tundra Highlands Humid Continental Mediterranean Semiarid Tropical Wet and Dry Humid Subtropical Arid Tropical Wet
7. Population Density Use textbook page 34-35 Answer, in complete sentences, in class notes: What is population density? How does a geographer calculate the density of a place? How does population density affect how people live? List the 5 categories for population density and list at least two cities that fit into each category using the maps around the room.
8. Population Density What is it? A measure that tells us how crowded a place is Higher number= more crowded the place is!
9. New York City: 26,000 people per mile! Mongolia: 4 people per mile Population Density
11. Population Density On your index card, next line down: Using the absolute location of your country, write down the population density of your country.
12. Economic Activity: Land and resources How do people USE the land they live on? It is different because everyone uses the land they live on to meet their needs Examples: farming, mining.
14. Economic Activity: Land and resources Other resources: Fossil Fuels (oil, coal, natural gas), uranium, moving water= provide fuel and power
15. Land Use Hunting and Gathering Subsistence Farming Commercial Farming Nomadic Herding Livestock Raising Commercial Fishing Forestry Trade and Manufacturing Each should have a picture, definition, and example!
16. Example: Hunting and Gathering: people hunt for animals and gather plants for food. Example: hunters in Greenland