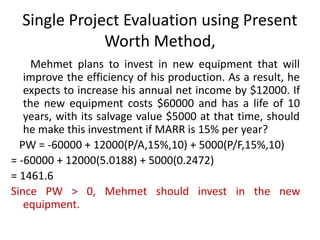
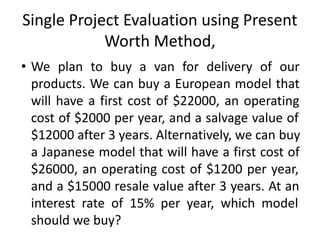
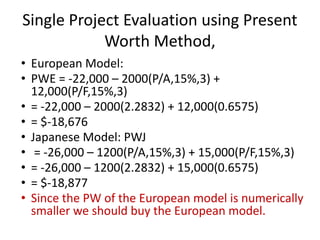
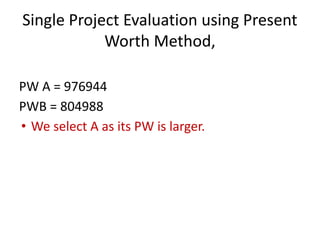
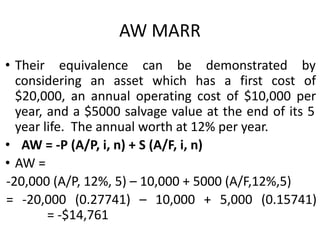
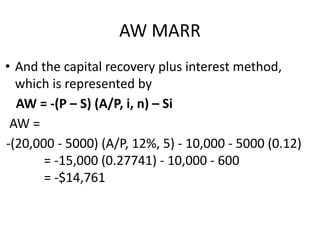
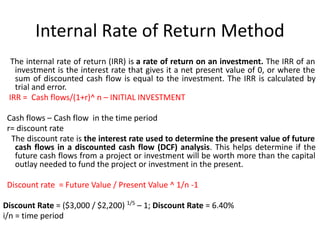
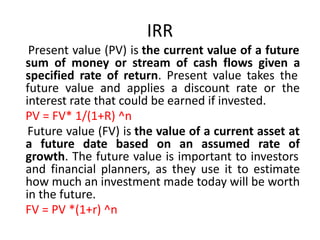
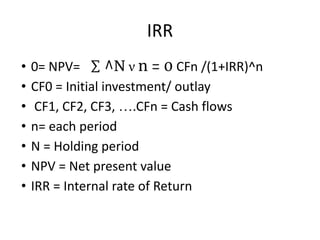
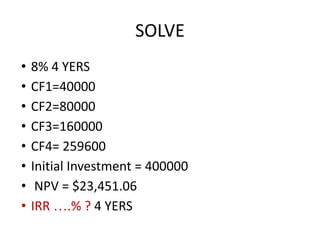
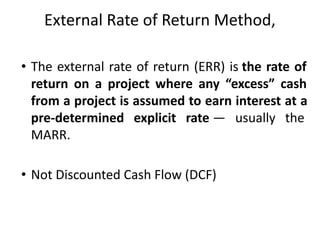
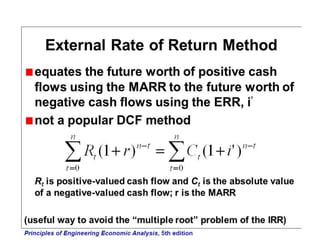
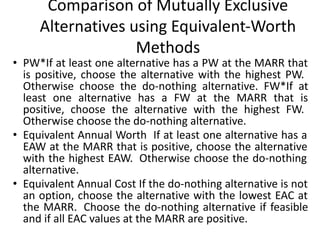
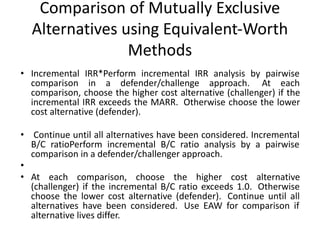
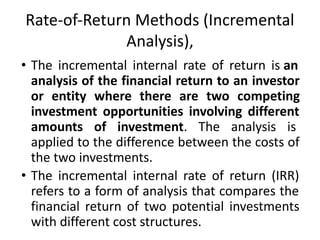
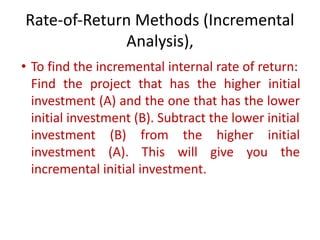
The document discusses various methods for evaluating the economic profitability of projects and investments, including the minimum attractive rate of return (MARR), present worth method, future worth method, annual worth method, internal rate of return method, external rate of return method, and payback period method. It also covers concepts for comparing mutually exclusive alternatives, such as using equivalent worth and rate of return methods, and considerations when useful lives are equal versus unequal among alternatives.
Investment Decision — Capital Budgeting Techniques — Pay Back Method — Accounting Rate Of Return — NPV — IRR — Discounted Pay Back Method — Capital Rationing — Risk Adjusted Techniques Of Capital Budgeting. — Capital Budgeting Practices.
These are short summary enotes for acca paper and more will be available if you message me.
in case you need any sort of assistance do let me know I will provide all type of help in acca advanced financial management course to all of you.
if you are doing acca and need my help in reporting, financial management or any other acca subject you have to just whatsapp me on my number mentioned in the pdf file name.
I can also help you all in performance management acca paper as well
Sheet4Assignment 1 LASA # 2—Capital Budgeting Techniques
Sheet1
Solution
:-A) Computation of WACC:-Cost of equity (Ke) will be calculated using dividend discount model which is as under:-Price of share (P0) = D1/(Ke-g)Ke = (D1/(P0*(1-f))) + gWhere,D1 = D0*(1+g)F = Flotation costKe = ((2.50*(1+6%))/(50*(1-10%))) + 6%Ke = 11.89%i) Equity financing and debt financing are two different sources of financing being used by the organizations to procure funds. Equity and debt are two different sources of financing, equity financing represents internal source of finance whereas debt financing represent external source of finance. Mixture of both is always used by the business organizations to procure funds and is most commonly known as target ratio or capital structure ratio. This ration varies from industry to industry and company and company depending upon various circumstances, equity financing can be raised only through issuing shares in market by the help of initial public offer whereas debt financing can be raise from many sources such as bonds, long term loans, money market instruments etc.Equity Financing has following advantages:1. The total cash flows generated can be used solely for investment purpose, rather than paying back the investors.2. Funds can be raised in shorter time as compared to other sources of funds.However, in equity financing, dilution of ownership easily occurs and more investors can lead to loss of Control.Cost of debt (Kd) will be calculated as follows:-Kd = Market rate of deb*(1-tax rate)Kd = 5%*(1-35%)Kd = 3.25%Debt is a more common source of finance used by most of the organizations, the reason for the same is as follows:-a. Debt is cheaper source of finance as compared to equity the reason being the cost associated with issuing the common stock like. Underwriters commission, legal expenses, various registration charges, issuing of prospectus, printing of various documents etc.b. Debt financing provide leverage to the company which will increase the Earning per Share (EPS) which in turn leads to increase in market value of share, this helps organization to maximize its market capitalization.However, if the expansion venture does not work in favour of the company, then these obligations of repayment of principal and interest may turnout to be a burden to the company. WACC = (Ke*We) + (Kd*Wd)WACC = (11.89%*70%) + (3.25%*30%)WACC = 9.30%B) Computation of NPV of project A:-Depreciation = Cost of the asset – salvage value Life of the asset = 1,500,000/ 3 = 500,000Calculation of cash flows:Revenue – 1,200,000Less Cost – 600,000Less Depreciation – 500,000Profit - 100,000Less taxes (35%) 35,000Profit after taxes .
Thorough understanding and assessment of tools for capital Investment.
Introduction to Discounting & Compounding.
Tools include NPV, IRR, MIRR, Payback, Discounted Payback.
Comparisons, limitations and their effectiveness.
Evaluation and Conclusion.
The investment decisions of a firm are generally known as the capital budgeting, or capital expenditure decisions.
The firm’s investment decisions would generally include expansion, acquisition, modernisation and replacement of the long-term assets. Sale of a division or business (divestment) is also as an investment decision.
Decisions like the change in the methods of sales distribution, or an advertisement campaign or a research and development programme have long-term implications for the firm’s expenditures and benefits, and therefore, they should also be evaluated as investment decisions.
Hierarchical Digital Twin of a Naval Power SystemKerry Sado
A hierarchical digital twin of a Naval DC power system has been developed and experimentally verified. Similar to other state-of-the-art digital twins, this technology creates a digital replica of the physical system executed in real-time or faster, which can modify hardware controls. However, its advantage stems from distributing computational efforts by utilizing a hierarchical structure composed of lower-level digital twin blocks and a higher-level system digital twin. Each digital twin block is associated with a physical subsystem of the hardware and communicates with a singular system digital twin, which creates a system-level response. By extracting information from each level of the hierarchy, power system controls of the hardware were reconfigured autonomously. This hierarchical digital twin development offers several advantages over other digital twins, particularly in the field of naval power systems. The hierarchical structure allows for greater computational efficiency and scalability while the ability to autonomously reconfigure hardware controls offers increased flexibility and responsiveness. The hierarchical decomposition and models utilized were well aligned with the physical twin, as indicated by the maximum deviations between the developed digital twin hierarchy and the hardware.
Sachpazis:Terzaghi Bearing Capacity Estimation in simple terms with Calculati...Dr.Costas Sachpazis
Terzaghi's soil bearing capacity theory, developed by Karl Terzaghi, is a fundamental principle in geotechnical engineering used to determine the bearing capacity of shallow foundations. This theory provides a method to calculate the ultimate bearing capacity of soil, which is the maximum load per unit area that the soil can support without undergoing shear failure. The Calculation HTML Code included.
CFD Simulation of By-pass Flow in a HRSG module by R&R Consult.pptxR&R Consult
CFD analysis is incredibly effective at solving mysteries and improving the performance of complex systems!
Here's a great example: At a large natural gas-fired power plant, where they use waste heat to generate steam and energy, they were puzzled that their boiler wasn't producing as much steam as expected.
R&R and Tetra Engineering Group Inc. were asked to solve the issue with reduced steam production.
An inspection had shown that a significant amount of hot flue gas was bypassing the boiler tubes, where the heat was supposed to be transferred.
R&R Consult conducted a CFD analysis, which revealed that 6.3% of the flue gas was bypassing the boiler tubes without transferring heat. The analysis also showed that the flue gas was instead being directed along the sides of the boiler and between the modules that were supposed to capture the heat. This was the cause of the reduced performance.
Based on our results, Tetra Engineering installed covering plates to reduce the bypass flow. This improved the boiler's performance and increased electricity production.
It is always satisfying when we can help solve complex challenges like this. Do your systems also need a check-up or optimization? Give us a call!
Work done in cooperation with James Malloy and David Moelling from Tetra Engineering.
More examples of our work https://www.r-r-consult.dk/en/cases-en/
Overview of the fundamental roles in Hydropower generation and the components involved in wider Electrical Engineering.
This paper presents the design and construction of hydroelectric dams from the hydrologist’s survey of the valley before construction, all aspects and involved disciplines, fluid dynamics, structural engineering, generation and mains frequency regulation to the very transmission of power through the network in the United Kingdom.
Author: Robbie Edward Sayers
Collaborators and co editors: Charlie Sims and Connor Healey.
(C) 2024 Robbie E. Sayers
Student information management system project report ii.pdfKamal Acharya
Our project explains about the student management. This project mainly explains the various actions related to student details. This project shows some ease in adding, editing and deleting the student details. It also provides a less time consuming process for viewing, adding, editing and deleting the marks of the students.
Welcome to WIPAC Monthly the magazine brought to you by the LinkedIn Group Water Industry Process Automation & Control.
In this month's edition, along with this month's industry news to celebrate the 13 years since the group was created we have articles including
A case study of the used of Advanced Process Control at the Wastewater Treatment works at Lleida in Spain
A look back on an article on smart wastewater networks in order to see how the industry has measured up in the interim around the adoption of Digital Transformation in the Water Industry.
Design and Analysis of Algorithms-DP,Backtracking,Graphs,B&B
unit 4.pdf
1. Unit 4. Methods for Evaluating
the Economic Profitability
4.1. Concept of the Minimum Attractive Rate of
Return (MARR),
Single Project Evaluation using Present Worth
Method, Future Worth Method, Annual Worth
Method, Internal Rate of Return Method, External
Rate of Return Method, Payback Period Method
2. Concept of the Minimum Attractive Rate
of Return (MARR),
An organization's minimum attractive rate of return
(MARR) is just that, the lowest internal rate of return
the organization would consider to be a good
investment. The MARR is a statement that an
organization is confident it can achieve at least that
rate of return.
The MARR is the target rate for evaluation of the
project investment. This is accomplished by creating a
cash flow diagram for the project, and moving all of
the transactions on that diagram to the same point,
using the MARR as the interest rate.
3. (MARR),
• A minimum acceptable rate of return (MARR)
is the minimum profit an investor expects to
make from an investment, taking into
account the risks of the investment and the
opportunity cost of undertaking it instead of
other investments.
4. (MARR),
• The MARR is used for compounding the estimated
cash flows to the end of the planning horizon, or
for discounting the cash flow to the present.
• Discounting is the process of converting a value
received in a future time period to an equivalent
value received immediately.
• For example, a dollar received 50 years from now
may be valued less than a dollar received
today—discounting measures this relative value.
5. (MARR),
• The Minimum Attractive Rate of Return
(MARR) is a reasonable rate of return
established for the evaluation and selection
of alternatives.
• A project is not economically viable unless it is
expected to return at least the MARR.
6. (MARR),
• MARR = project value + rate of interest for loans
+ expected rate of inflation + rate of inflation
change + loan default risk + project risk.
• Key consideration:
• Cost of borrowed money.
• Cost of capital.
• Opportunity cost.
• Rate of return (%) = Interest accrued per time unit
/ Pricipal X 100
7. (MARR),
• The MARR is the target rate for evaluation of the
project investment. This is accomplished by
creating a cash flow diagram for the project, and
moving all of the transactions on that diagram to
the same point, using the MARR as the interest
rate.
• If the resulting value at that point is zero or
higher, then the project will move on to the next
stage of analysis. Otherwise, it is discarded. The
MARR generally increases with increased risk.
8. PW
• Present worth, PW, is calculated at the MARR.
If PW ≥ 0, which indicates that the MARR is
met or exceeded, the alternative is
acceptable.
• If PW < 0, alternative is not acceptable
9. Single Project Evaluation using Present
Worth Method,
Mehmet plans to invest in new equipment that will
improve the efficiency of his production. As a result, he
expects to increase his annual net income by $12000. If
the new equipment costs $60000 and has a life of 10
years, with its salvage value $5000 at that time, should
he make this investment if MARR is 15% per year?
PW = -60000 + 12000(P/A,15%,10) + 5000(P/F,15%,10)
= -60000 + 12000(5.0188) + 5000(0.2472)
= 1461.6
Since PW > 0, Mehmet should invest in the new
equipment.
10. Single Project Evaluation using Present
Worth Method,
• We plan to buy a van for delivery of our
products. We can buy a European model that
will have a first cost of $22000, an operating
cost of $2000 per year, and a salvage value of
$12000 after 3 years. Alternatively, we can buy
a Japanese model that will have a first cost of
$26000, an operating cost of $1200 per year,
and a $15000 resale value after 3 years. At an
interest rate of 15% per year, which model
should we buy?
11. Single Project Evaluation using Present
Worth Method,
• European Model:
• PWE = -22,000 – 2000(P/A,15%,3) +
12,000(P/F,15%,3)
• = -22,000 – 2000(2.2832) + 12,000(0.6575)
• = $-18,676
• Japanese Model: PWJ
• = -26,000 – 1200(P/A,15%,3) + 15,000(P/F,15%,3)
• = -26,000 – 1200(2.2832) + 15,000(0.6575)
• = $-18,877
• Since the PW of the European model is numerically
smaller we should buy the European model.
12. Single Project Evaluation using Present
Worth Method,
PW A = 976944
PWB = 804988
• We select A as its PW is larger.
13. Future Worth
• FW is an alternative to the PW method.
Looking at FW is appropriate since the primary
objective is to maximize the future wealth of
owners of the firm.
• FW is based on the equivalent worth of all cash
inflows and outflows at the end of the study
period at an interest rate that is generally the
MARR. Decisions made using FW and PW will
be the same.
14. Future Worth
• A $45,000 investment in a new conveyor system is projected to
improve throughput and increasing revenue by $14,000 per year for
five years. The conveyor will have an estimated market value of
$4,000 at the end of five years. Using FW and a MARR of 12%, is this
a good investment?
• FW(MARR%)
= -$45,000(F/P, 12%, 5)+$14,000(F/A, 12%, 5)+$4,000
• FW (MARR%)
= -$45,000(1.7623)+$14,000(6.3528)+$4,000
FW(MARR%) = $13635
• This is a good investment!
15. FW
• Consider a project that has an initial
investment of $50,000 and that returns
$18,000 per year for the next four years. If the
MARR is 12%, is this a good investment?
• FW(12%) = -50, ,000 (P/A, 12%, 4)
• FW(12%)= -50, ,000 (3.0373) + $18,000
(F/A,12% ,4)
• FW(12%) = $ 7352
• This is a good investment!
16. Annual worth method
• Annual worth is an equal periodic series of dollar
amounts that is equivalent to the cash inflows and
outflows, at an interest rate that is generally the
MARR. The AW of a project is annual equivalent
revenue or savings minus annual equivalent
expenses, less its annual capital recovery (CR)
amount.
• Annual Worth (AW) Analysis is defined as the
equivalent uniform annual worth of all estimated
receipts (income) and disbursements (costs) during
the life cycle of a project.
17. AW MARR
The repeatability of the uniform annual series
through various life cycles can be demonstrated
by considering the cash-flow diagram, which
represents two life cycles of an asset with a first
cost of $20,000, an annual operating cost of
$8000, and a 3-year life.
The AW for one life cycle (i.e., 3 years) would be
calculated as follows:
AW = -20,000 (A/P, 22%, 3) – 8000
= -$17,793
18. AW MARR
• Their equivalence can be demonstrated by
considering an asset which has a first cost of
$20,000, an annual operating cost of $10,000 per
year, and a $5000 salvage value at the end of its 5
year life. The annual worth at 12% per year.
• AW = -P (A/P, i, n) + S (A/F, i, n)
• AW =
-20,000 (A/P, 12%, 5) – 10,000 + 5000 (A/F,12%,5)
= -20,000 (0.27741) – 10,000 + 5,000 (0.15741)
= -$14,761
19. AW MARR
• And the capital recovery plus interest method,
which is represented by
AW = -(P – S) (A/P, i, n) – Si
AW =
-(20,000 - 5000) (A/P, 12%, 5) - 10,000 - 5000 (0.12)
= -15,000 (0.27741) - 10,000 - 600
= -$14,761
20. Internal Rate of Return Method
The internal rate of return (IRR) is a rate of return on an investment. The IRR of an
investment is the interest rate that gives it a net present value of 0, or where the
sum of discounted cash flow is equal to the investment. The IRR is calculated by
trial and error.
IRR = Cash flows/(1+r)^ n – INITIAL INVESTMENT
Cash flows – Cash flow in the time period
r= discount rate
The discount rate is the interest rate used to determine the present value of future
cash flows in a discounted cash flow (DCF) analysis. This helps determine if the
future cash flows from a project or investment will be worth more than the capital
outlay needed to fund the project or investment in the present.
Discount rate = Future Value / Present Value ^ 1/n -1
Discount Rate = ($3,000 / $2,200) 1/5
– 1; Discount Rate = 6.40%
i/n = time period
21. IRR
Present value (PV) is the current value of a future
sum of money or stream of cash flows given a
specified rate of return. Present value takes the
future value and applies a discount rate or the
interest rate that could be earned if invested.
PV = FV* 1/(1+R) ^n
Future value (FV) is the value of a current asset at
a future date based on an assumed rate of
growth. The future value is important to investors
and financial planners, as they use it to estimate
how much an investment made today will be worth
in the future.
FV = PV *(1+r) ^n
22. IRR
• IRR is a discount rate that makes the net
present value (NPV) of all cash flows equal to
zero in a discounted cash flow analysis. IRR
calculations rely on the same formula as NPV
does.
• NPV = IRR =
• CF0 + CF1/(1+IRR)^1 + CF2/(1+IRR)^2 +
CF3/(1+IRR)^3 +….+ CFn /(1+IRR)^n - Initial
Investment
23. IRR
• Let’s look at Tom’s Machine Shop. Tom is considering
purchasing a new machine, but he is unsure if it’s the
best use of company funds at this point in time. With
the new $100,000 machine, Tom will be able to take
on a new order that will pay $20,000, $30,000,
$40,000, and $40,000 in revenue. @ 8% 4 years
• CF1/(1+IRR)^1 + CF2/(1+IRR)^2 + CF3/(1+IRR)^3 +….+
CFn /(1+IRR)^n - Initial Investment
• F1 = 20, 000
• F2 = 30,000
• F3 = 40,000
• F4 = 40,000
• NPV= $ 5393
24. IRR
• Let’s look at Tom’s Machine Shop. Tom is considering purchasing a new
machine, but he is unsure if it’s the best use of company funds at this
point in time. With the new $100,000 machine, Tom will be able to
take on a new order that will pay $20,000, $30,000, $40,000, and
$40,000 in revenue. @ 10% 4 years
• CF1/(1+IRR)^1 + CF2/(1+IRR)^2 + CF3/(1+IRR)^3 +….+ CFn /(1+IRR)^n
- Initial Investment
• F1 = 20, 000
• F2 = 30,000
• F3 = 40,000
• F4 = 40,000
• NPV= 0
• As you can see, Tom’s internal return rate on this project is 10 percent.
He can compare this to other investing opportunities to see if it makes
sense to spend $100,000 on this piece of equipment or investment the
money in another venture.
25. IRR
• In the above example, if we replace 8% with
10%, NPV will become zero, and that's your
IRR. Therefore, IRR is defined as the discount
rate at which the NPV of a project becomes
zero.
26. IRR
• 0= NPV= ∑ ^N ν n = 0 CFn /(1+IRR)^n
• CF0 = Initial investment/ outlay
• CF1, CF2, CF3, ….CFn = Cash flows
• n= each period
• N = Holding period
• NPV = Net present value
• IRR = Internal rate of Return
28. External Rate of Return Method,
• The external rate of return (ERR) is the rate of
return on a project where any “excess” cash
from a project is assumed to earn interest at a
pre-determined explicit rate — usually the
MARR.
• Not Discounted Cash Flow (DCF)
29.
30. Payback Period Method
• The payback period disregards the time value
of money and is determined by counting the
number of years it takes to recover the funds
invested. For example, if it takes five years to
recover the cost of an investment, the payback
period is five years. This period does not
account for what happens after payback
occurs.
31. Payback Period Method
• To calculate the payback period you can use
the mathematical formula:
• Payback Period = Initial investment / Cash
flow per year
• For example, you have invested Rs 1,00,000
with an annual payback of Rs 20,000.
• Payback
• Period = 1,00,000/20,000 = 5 years.
32. 4. Methods for Evaluating the
Economic Profitability
• 4.2. Basic Concepts for Comparing
Alternatives, Comparison of Mutually
Exclusive Alternatives using Equivalent-Worth
Methods and Rate-of-Return Methods
(Incremental Analysis), Useful Lives Equal to
the Study Period, Useful Lives Unequal among
the Alternatives. Personal Finances
33. Basic Concepts for Comparing
Alternatives,
• In the real world, the majority of engineering
economic analysis problems are alternative
comparisons. In these problems, two or more
mutually exclusive investments compete for limited
funds. A variety of methods exists for selecting the
superior alternative from a group of proposals.
• When the present worth method is used to compare
mutually exclusive alternatives that have different
lives, the equal-service requirement must be met. The
PW of the alternatives must be compared over the
same number of years and must end at the same time
to satisfy the equal-service requirement.
34. Comparison of Mutually Exclusive
Alternatives using Equivalent-Worth
Methods
• PW*If at least one alternative has a PW at the MARR that
is positive, choose the alternative with the highest PW.
Otherwise choose the do-nothing alternative. FW*If at
least one alternative has a FW at the MARR that is
positive, choose the alternative with the highest FW.
Otherwise choose the do-nothing alternative.
• Equivalent Annual Worth If at least one alternative has a
EAW at the MARR that is positive, choose the alternative
with the highest EAW. Otherwise choose the do-nothing
alternative.
• Equivalent Annual Cost If the do-nothing alternative is not
an option, choose the alternative with the lowest EAC at
the MARR. Choose the do-nothing alternative if feasible
and if all EAC values at the MARR are positive.
35. Comparison of Mutually Exclusive
Alternatives using Equivalent-Worth
Methods
• Incremental IRR*Perform incremental IRR analysis by pairwise
comparison in a defender/challenge approach. At each
comparison, choose the higher cost alternative (challenger) if the
incremental IRR exceeds the MARR. Otherwise choose the lower
cost alternative (defender).
• Continue until all alternatives have been considered. Incremental
B/C ratioPerform incremental B/C ratio analysis by a pairwise
comparison in a defender/challenger approach.
•
• At each comparison, choose the higher cost alternative
(challenger) if the incremental B/C ratio exceeds 1.0. Otherwise
choose the lower cost alternative (defender). Continue until all
alternatives have been considered. Use EAW for comparison if
alternative lives differ.
36. Rate-of-Return Methods (Incremental
Analysis),
• The incremental internal rate of return is an
analysis of the financial return to an investor
or entity where there are two competing
investment opportunities involving different
amounts of investment. The analysis is
applied to the difference between the costs of
the two investments.
• The incremental internal rate of return (IRR)
refers to a form of analysis that compares the
financial return of two potential investments
with different cost structures.
37. Rate-of-Return Methods (Incremental
Analysis),
• To find the incremental internal rate of return:
Find the project that has the higher initial
investment (A) and the one that has the lower
initial investment (B). Subtract the lower initial
investment (B) from the higher initial
investment (A). This will give you the
incremental initial investment.
38. Useful Lives Equal to the Study Period
• The useful life of an asset is the period over
which an asset is expected to be available for
use by an entity, or the number of production
or similar units expected to be obtained from
the asset by the entity.
• Useful Lives 8 years and Study period 8 years
39. Useful Lives Unequal among the
Alternatives.
• Useful Lives 3 years, 4 years and 5 years among
the alternatives
40. Personal Finances
• Personal finance is a term that covers
managing your money as well as saving and
investing. It encompasses budgeting, banking,
insurance, mortgages, investments, retirement
planning, and tax and estate planning.
• An example of personal finance is knowing
how to budget, balance a checkbook, obtain
funds for major purchases, save for
retirement, plan for taxes, purchase
insurance and make investments.
41. Five major Personal Finances
1 Saving
2 Investing
3 Financial protection
4 Tax Saving
5 Retirement planning