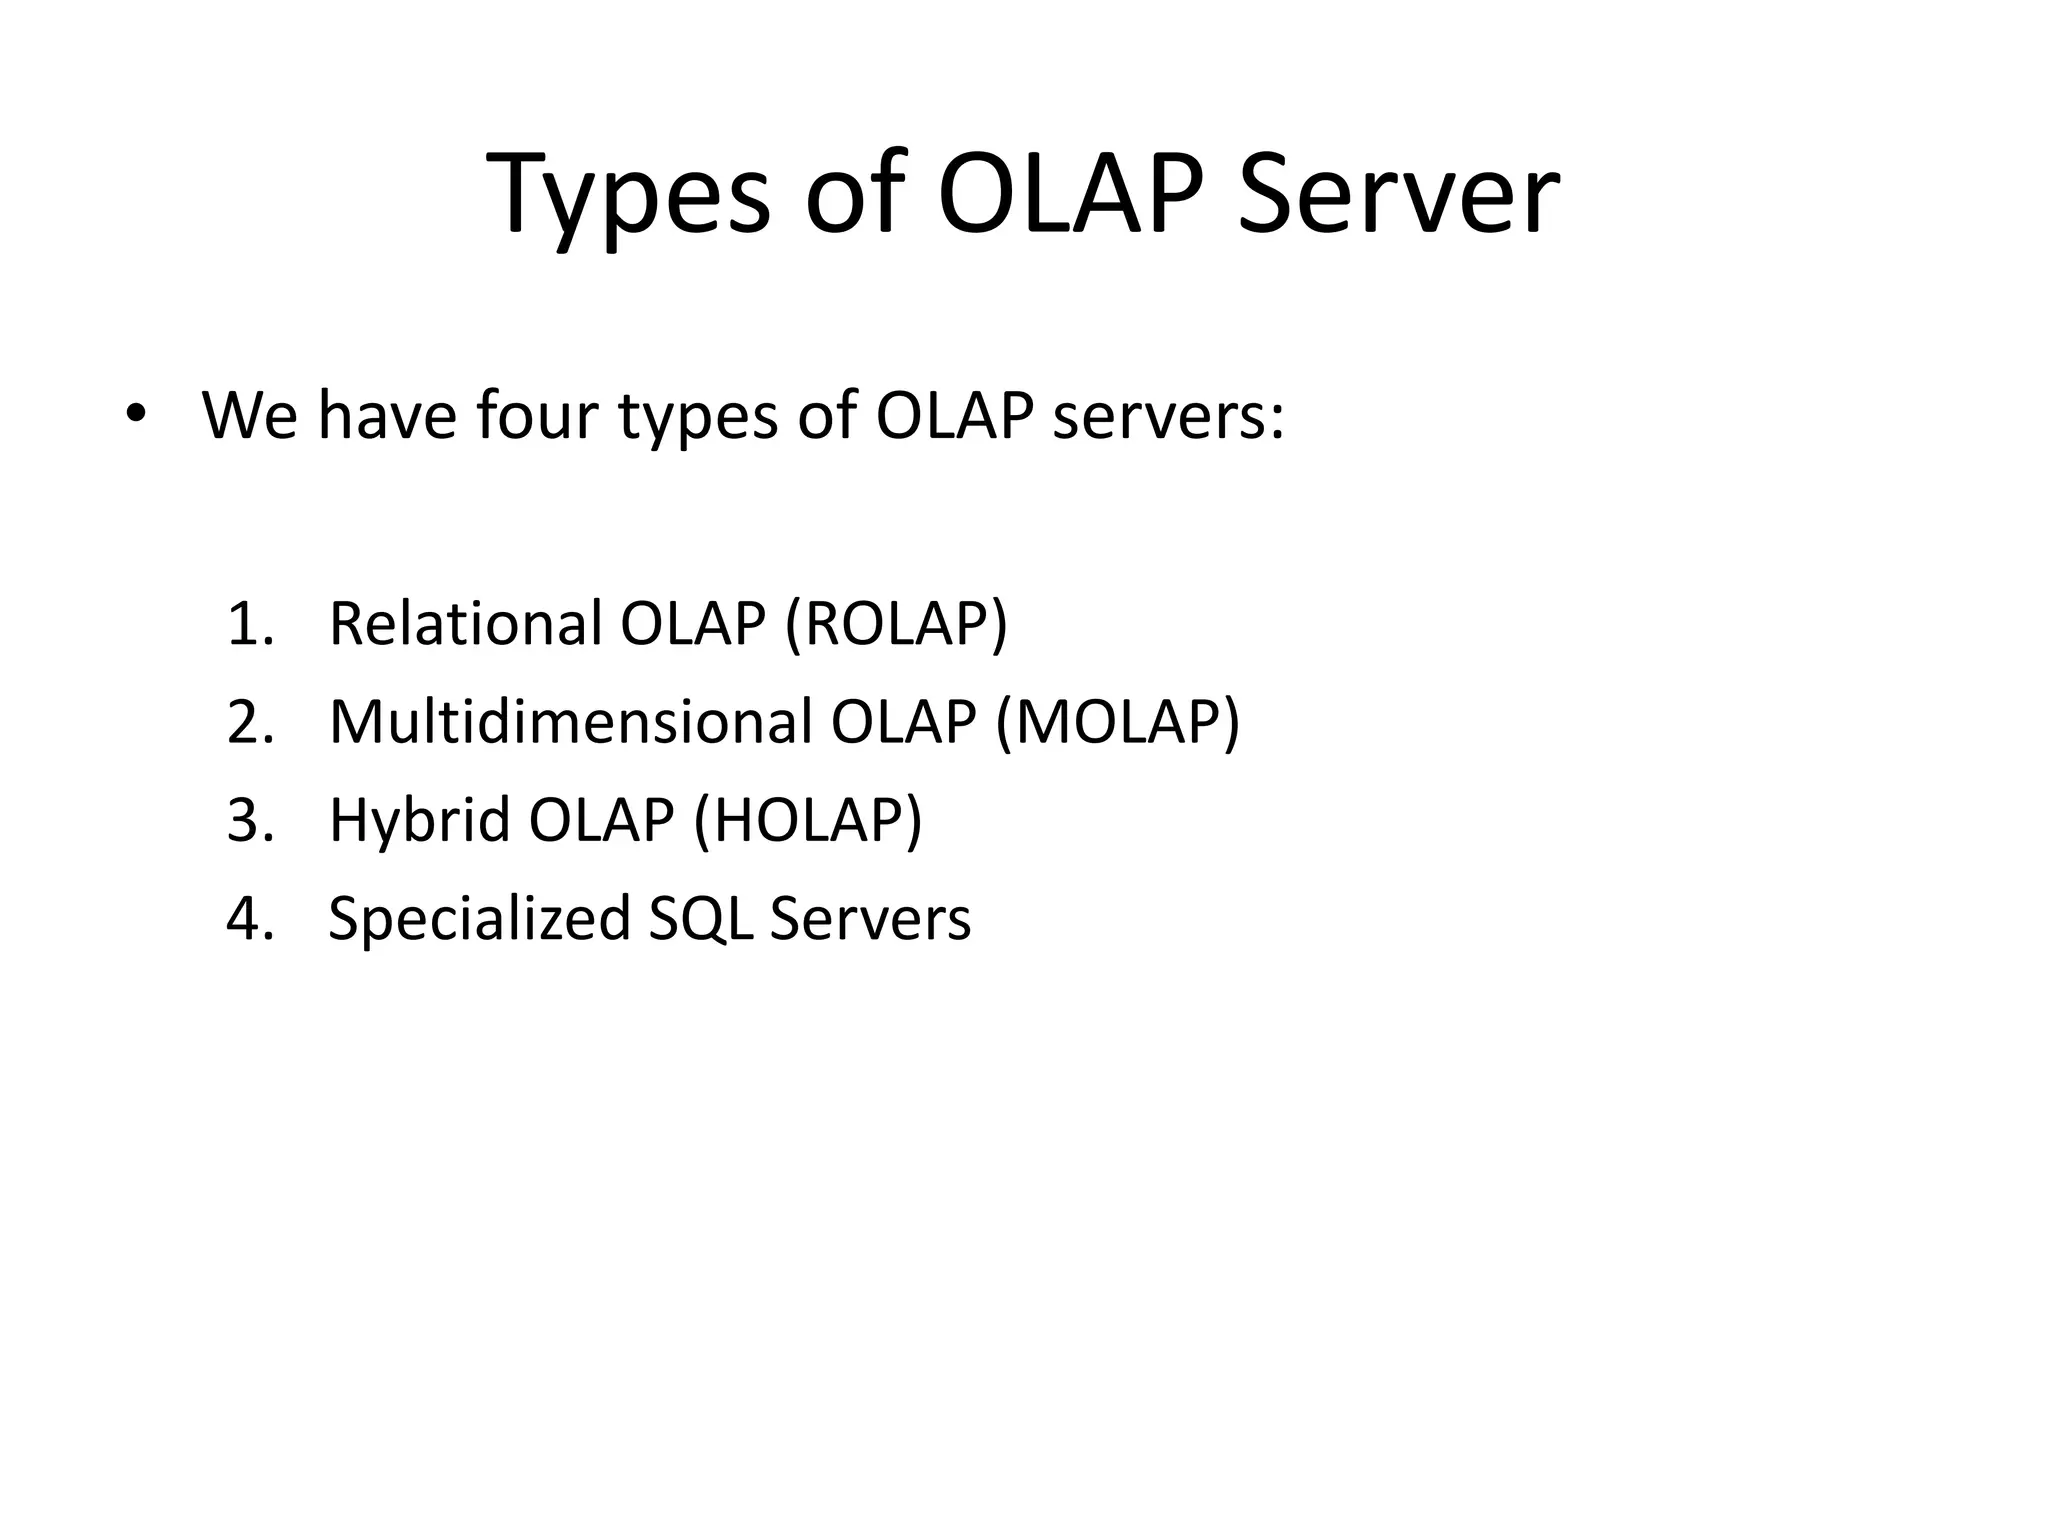
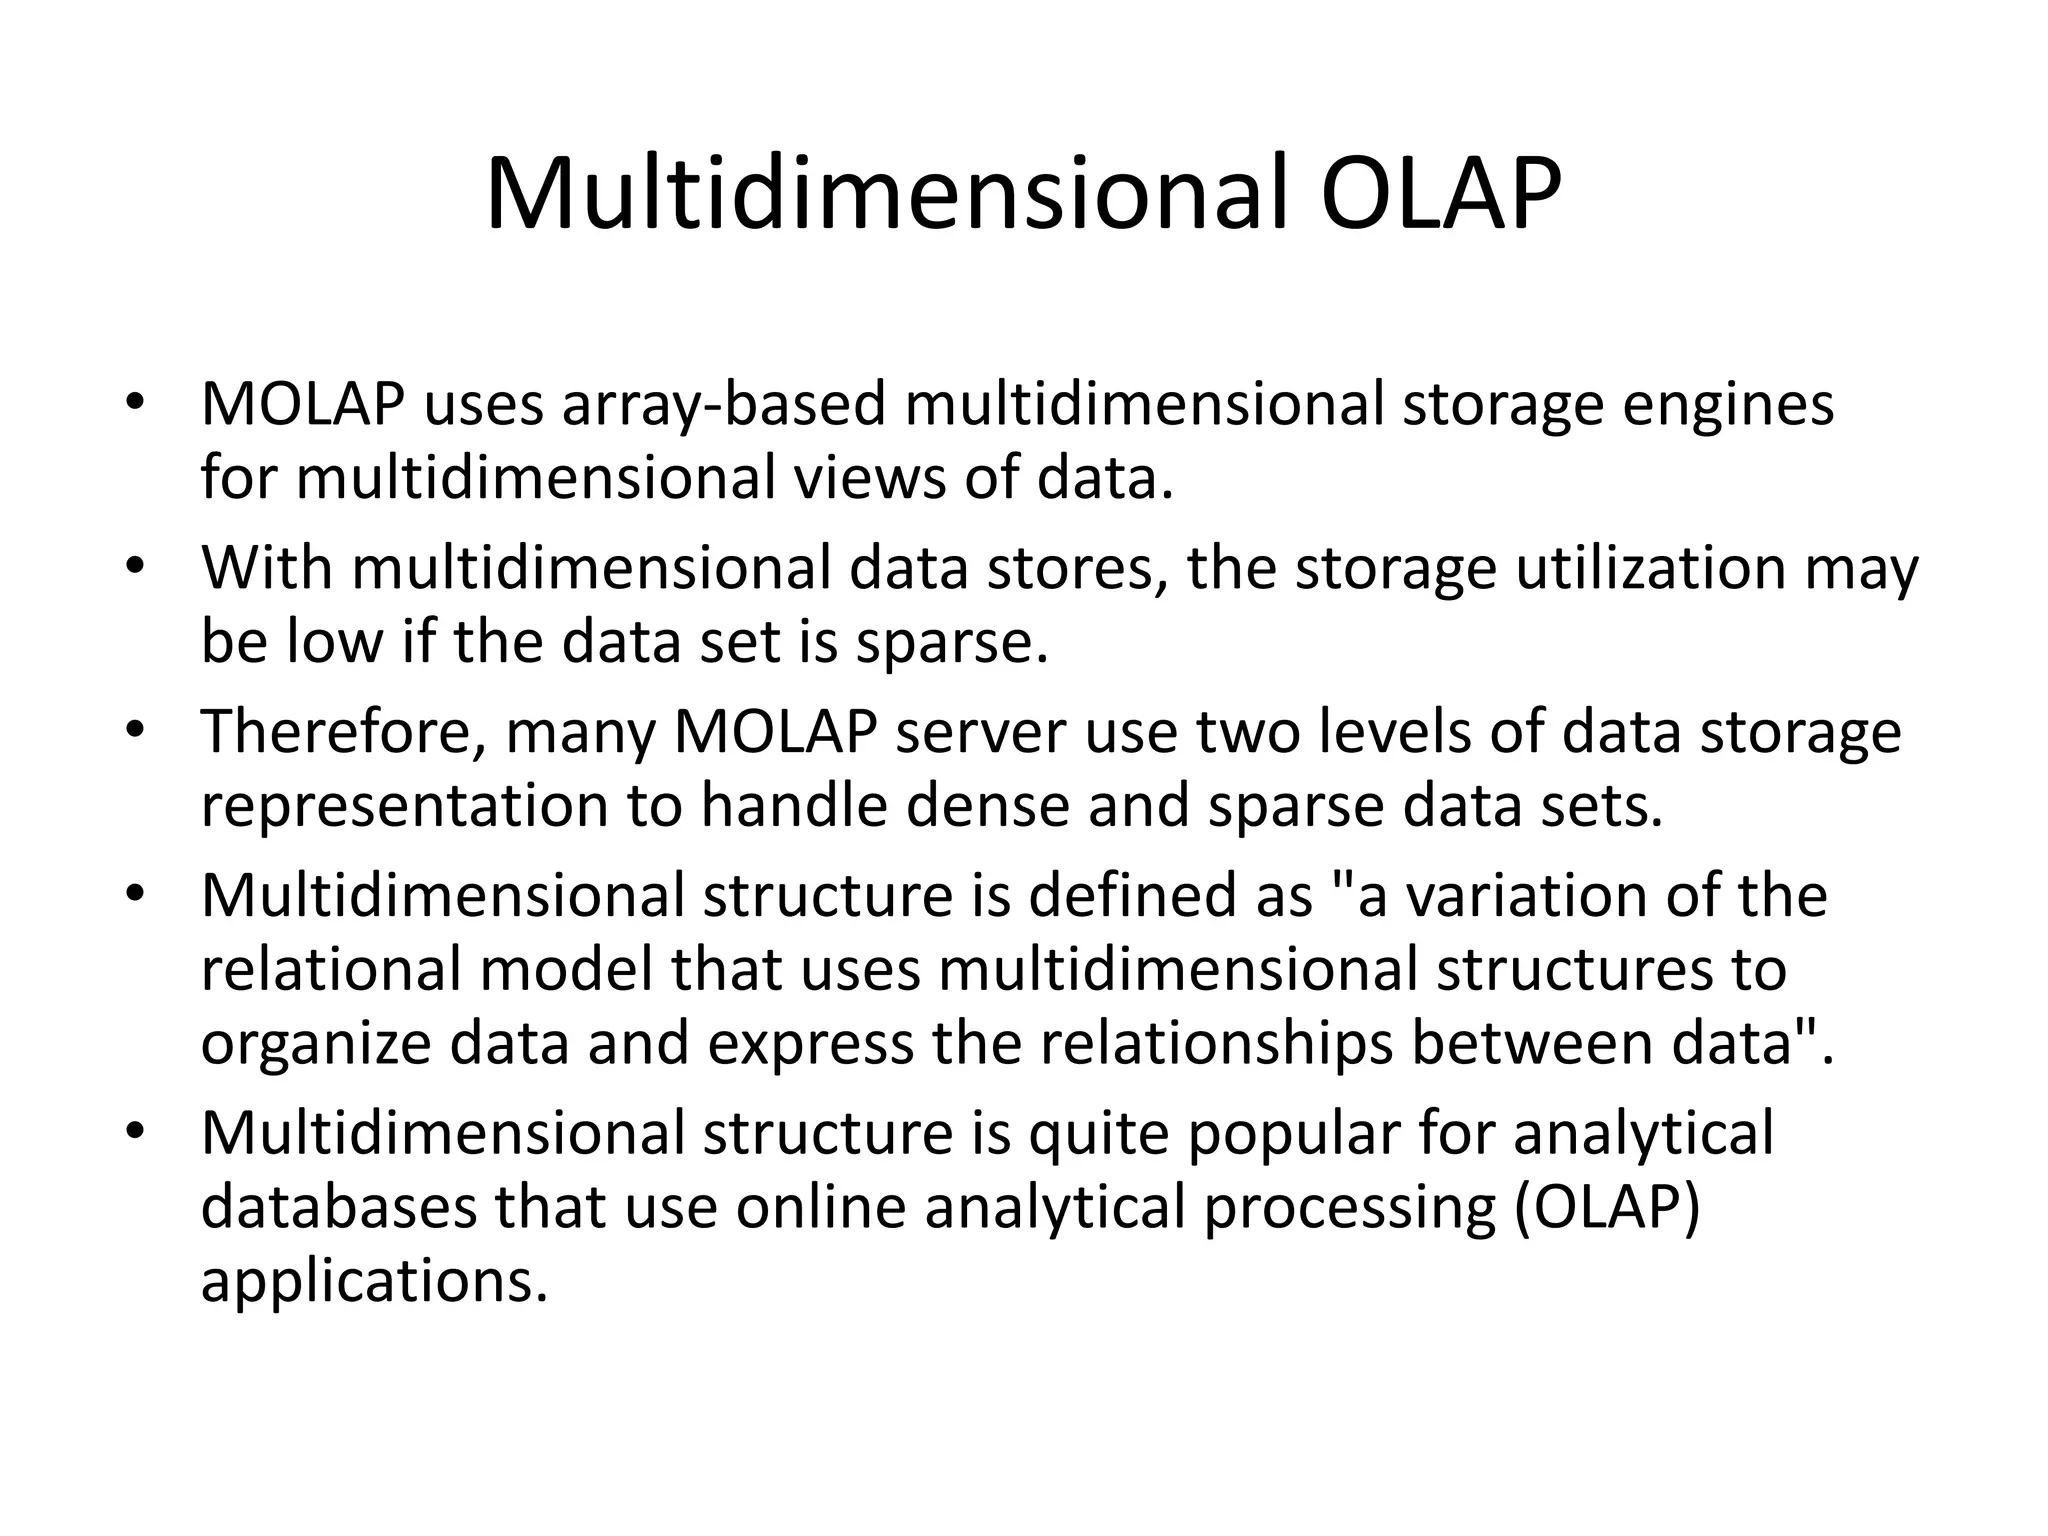
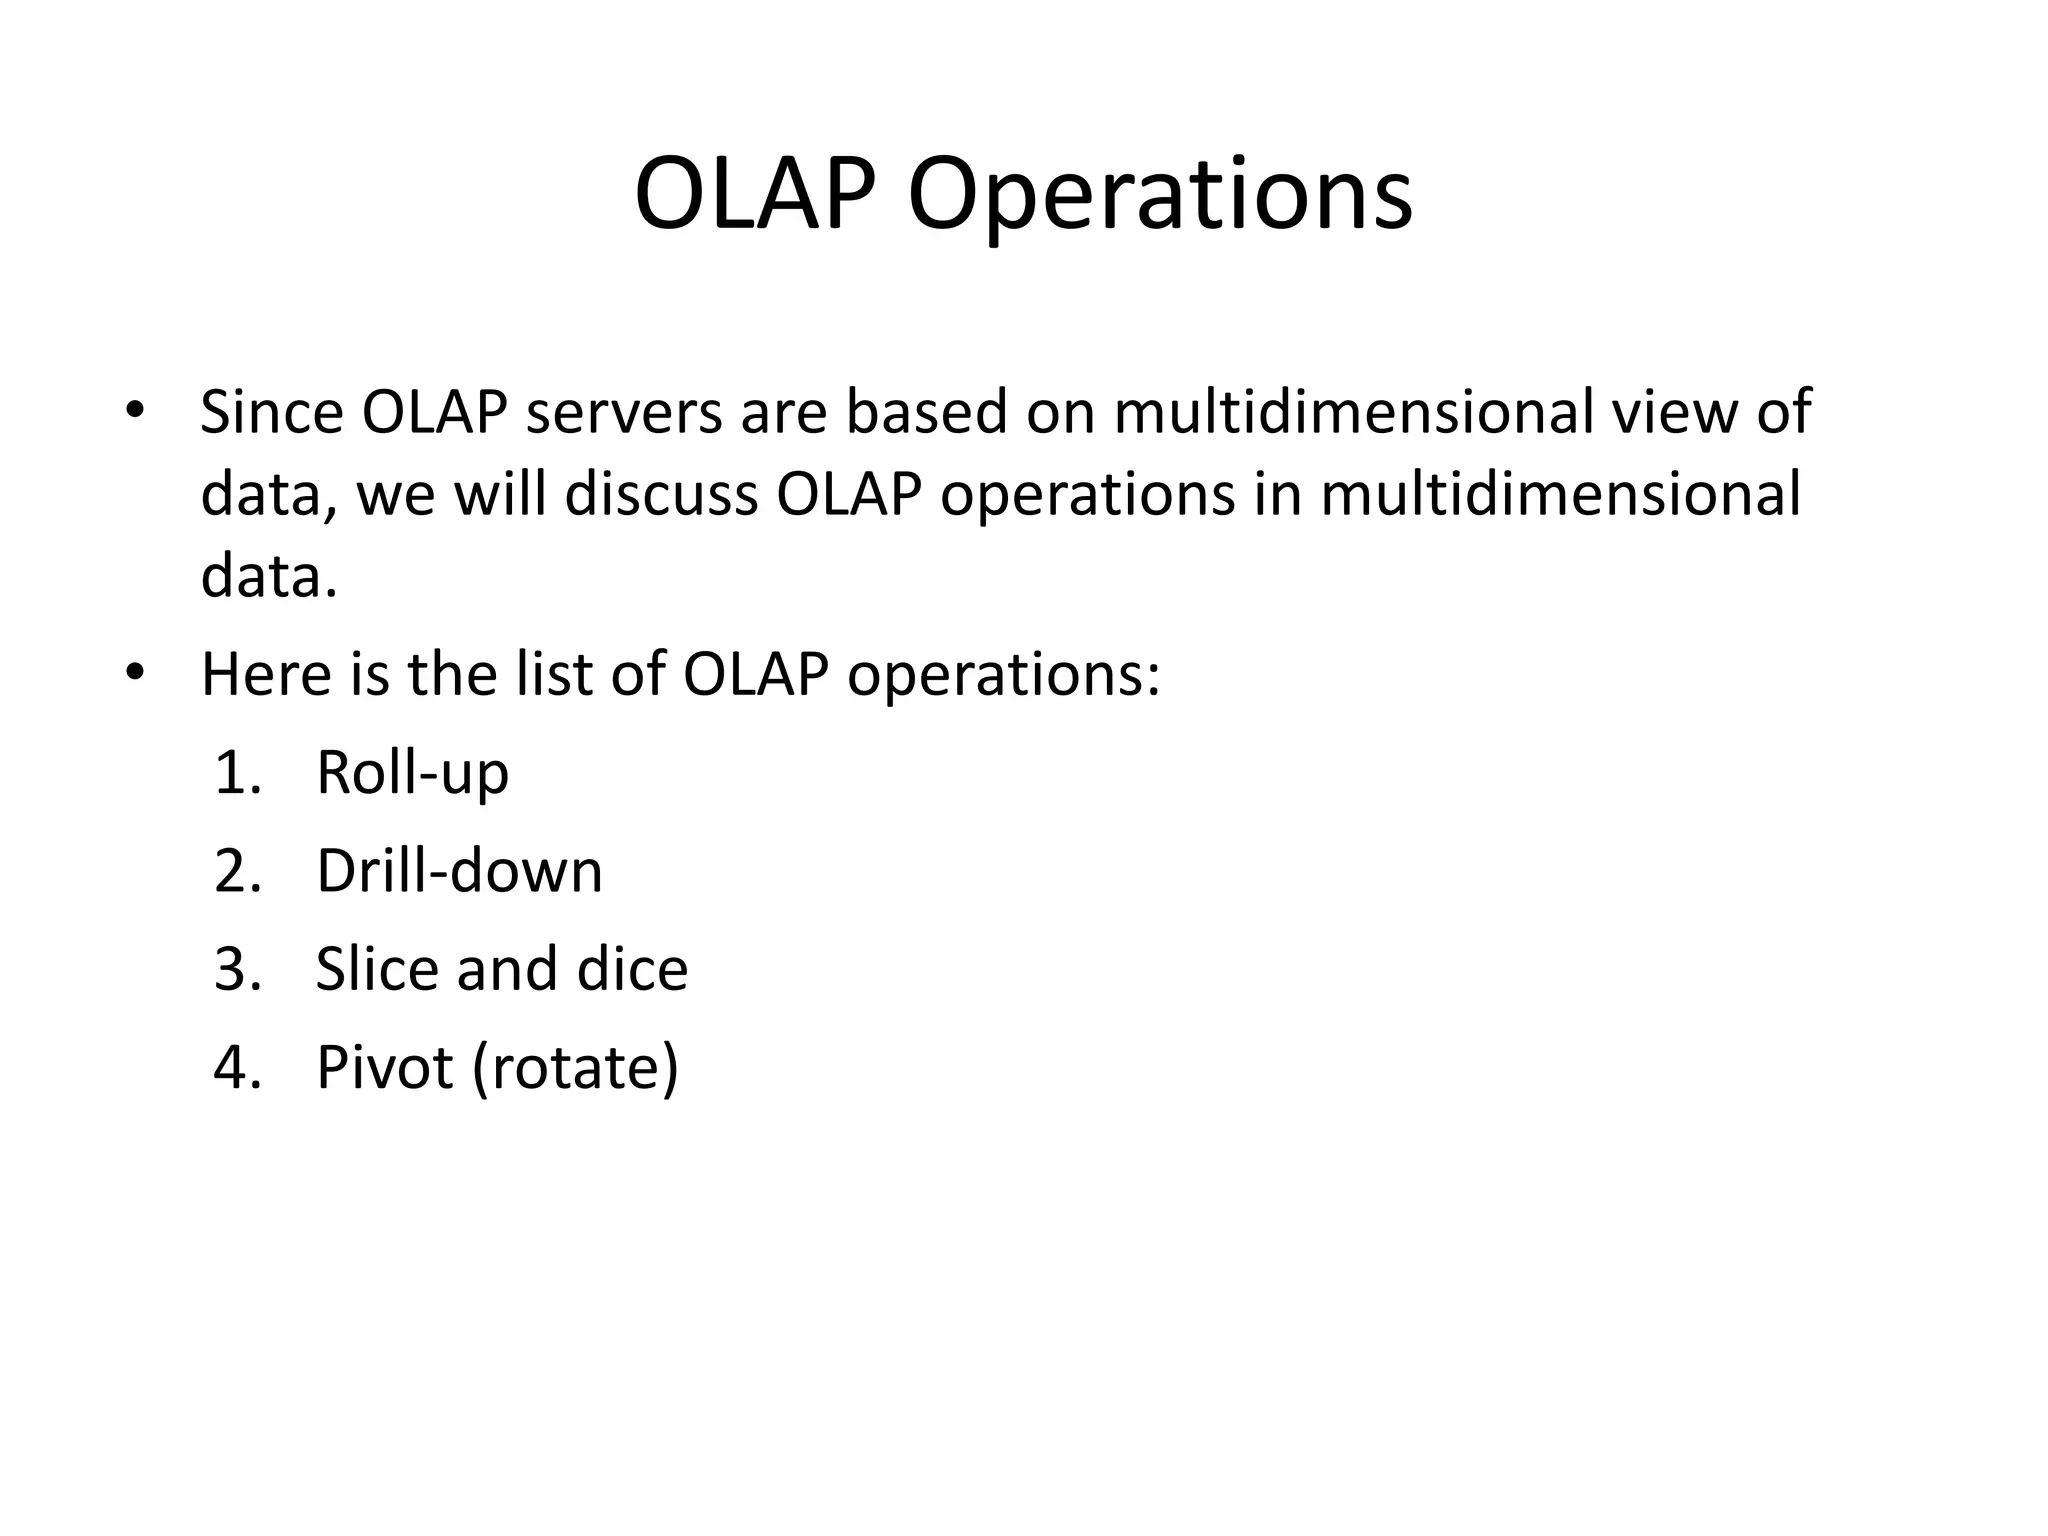
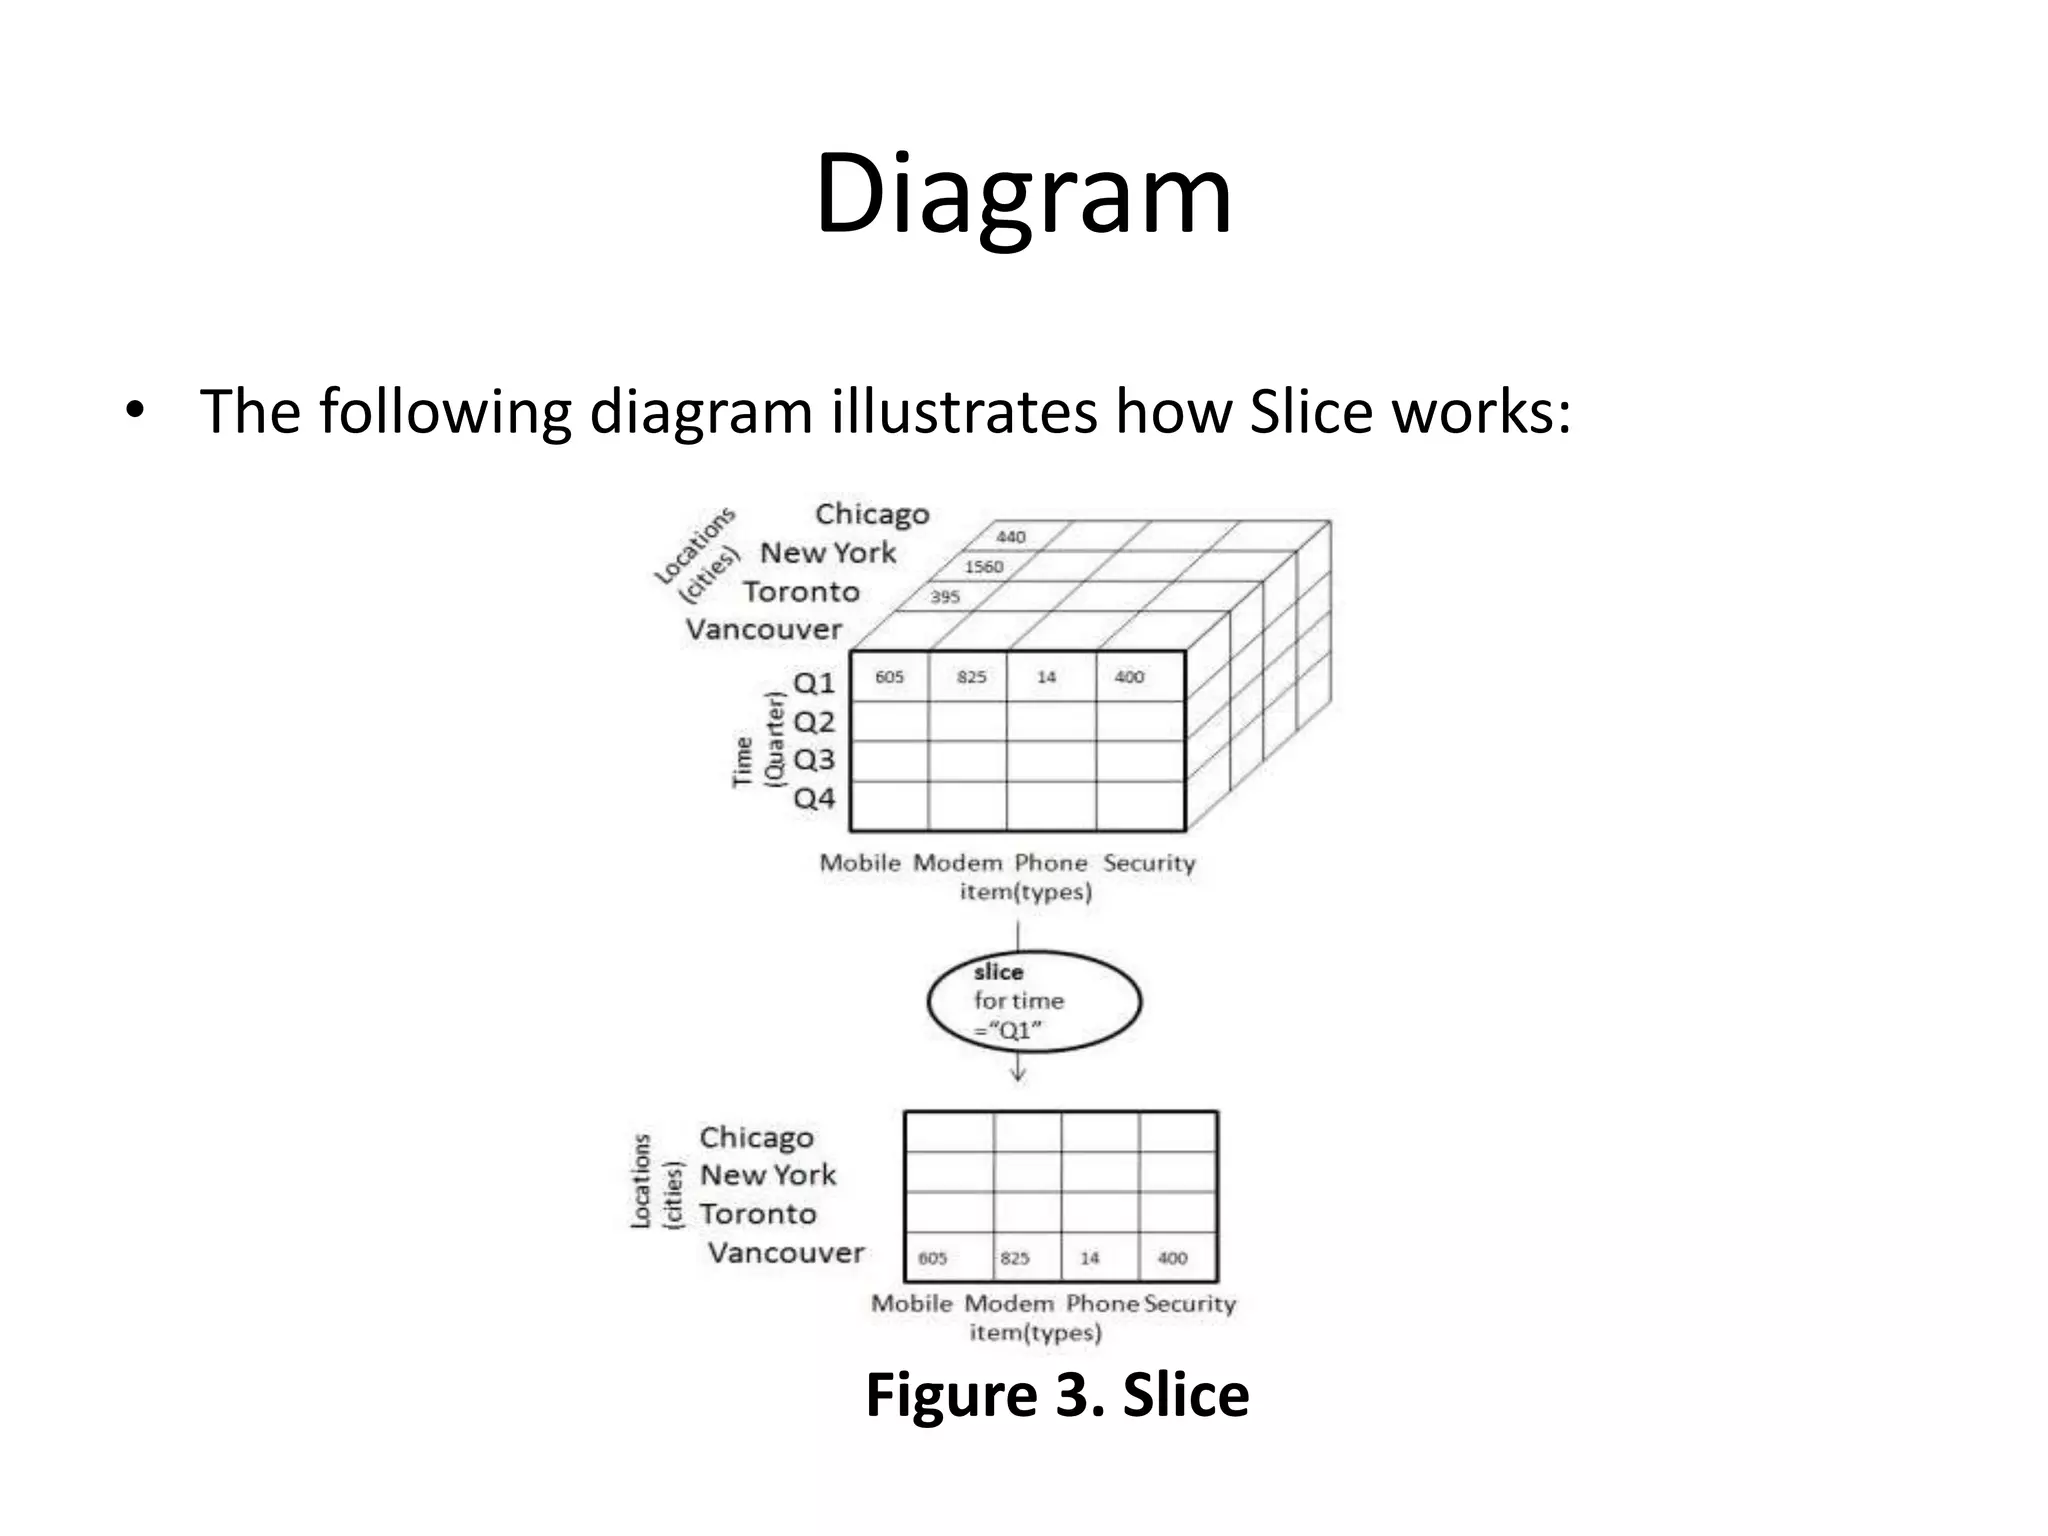
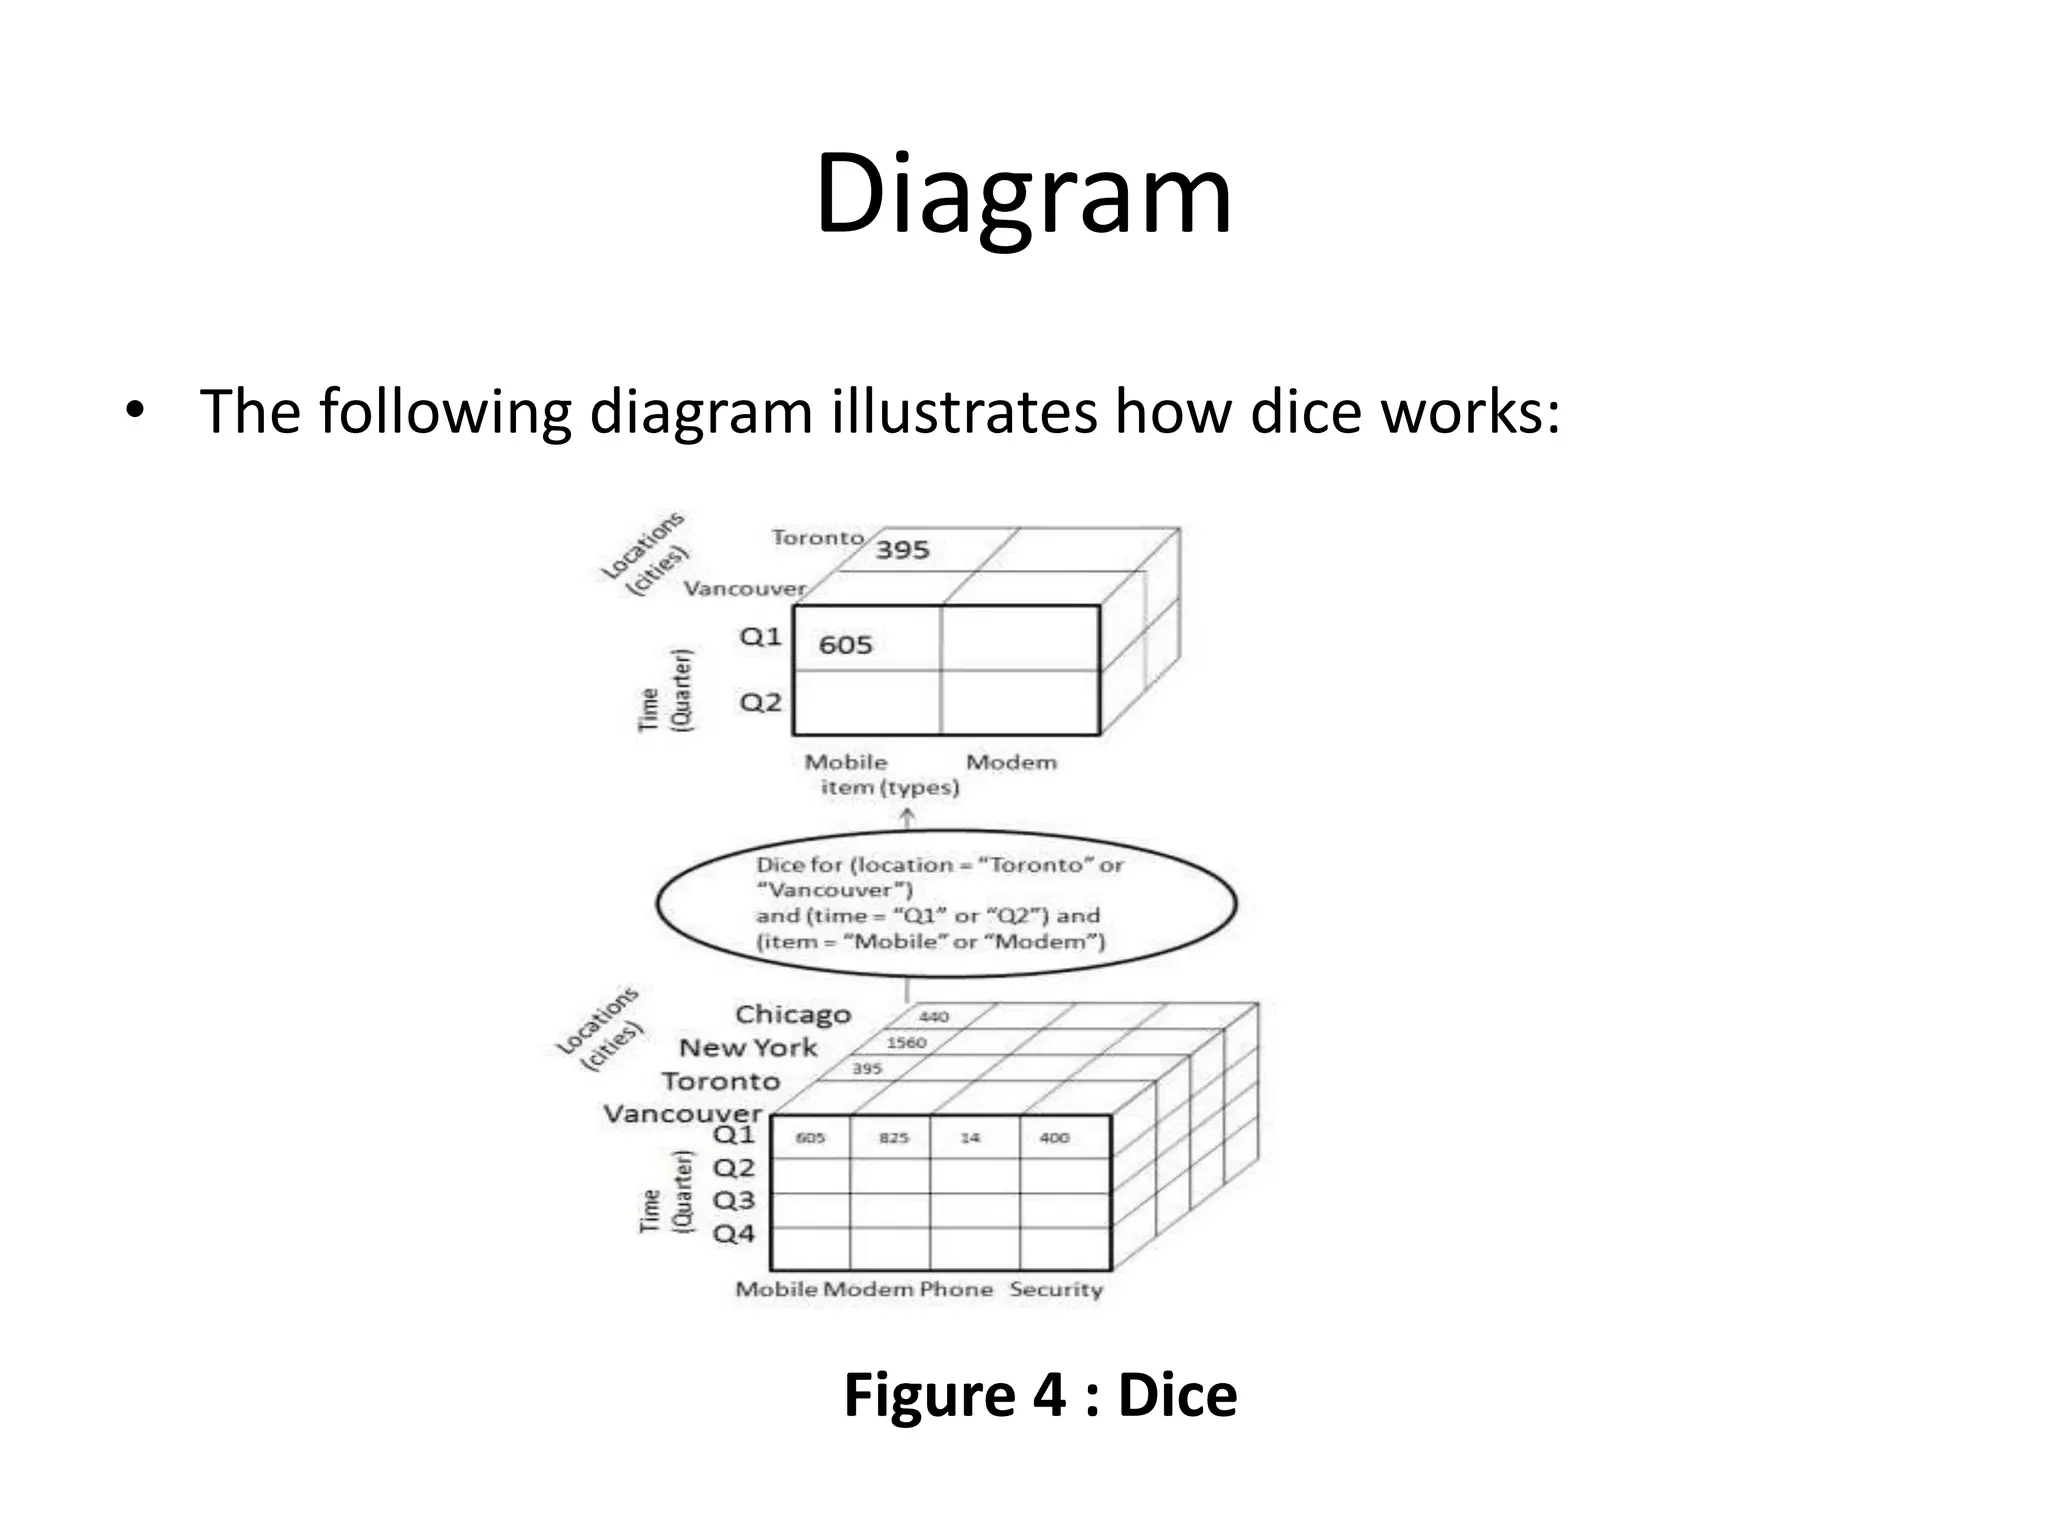
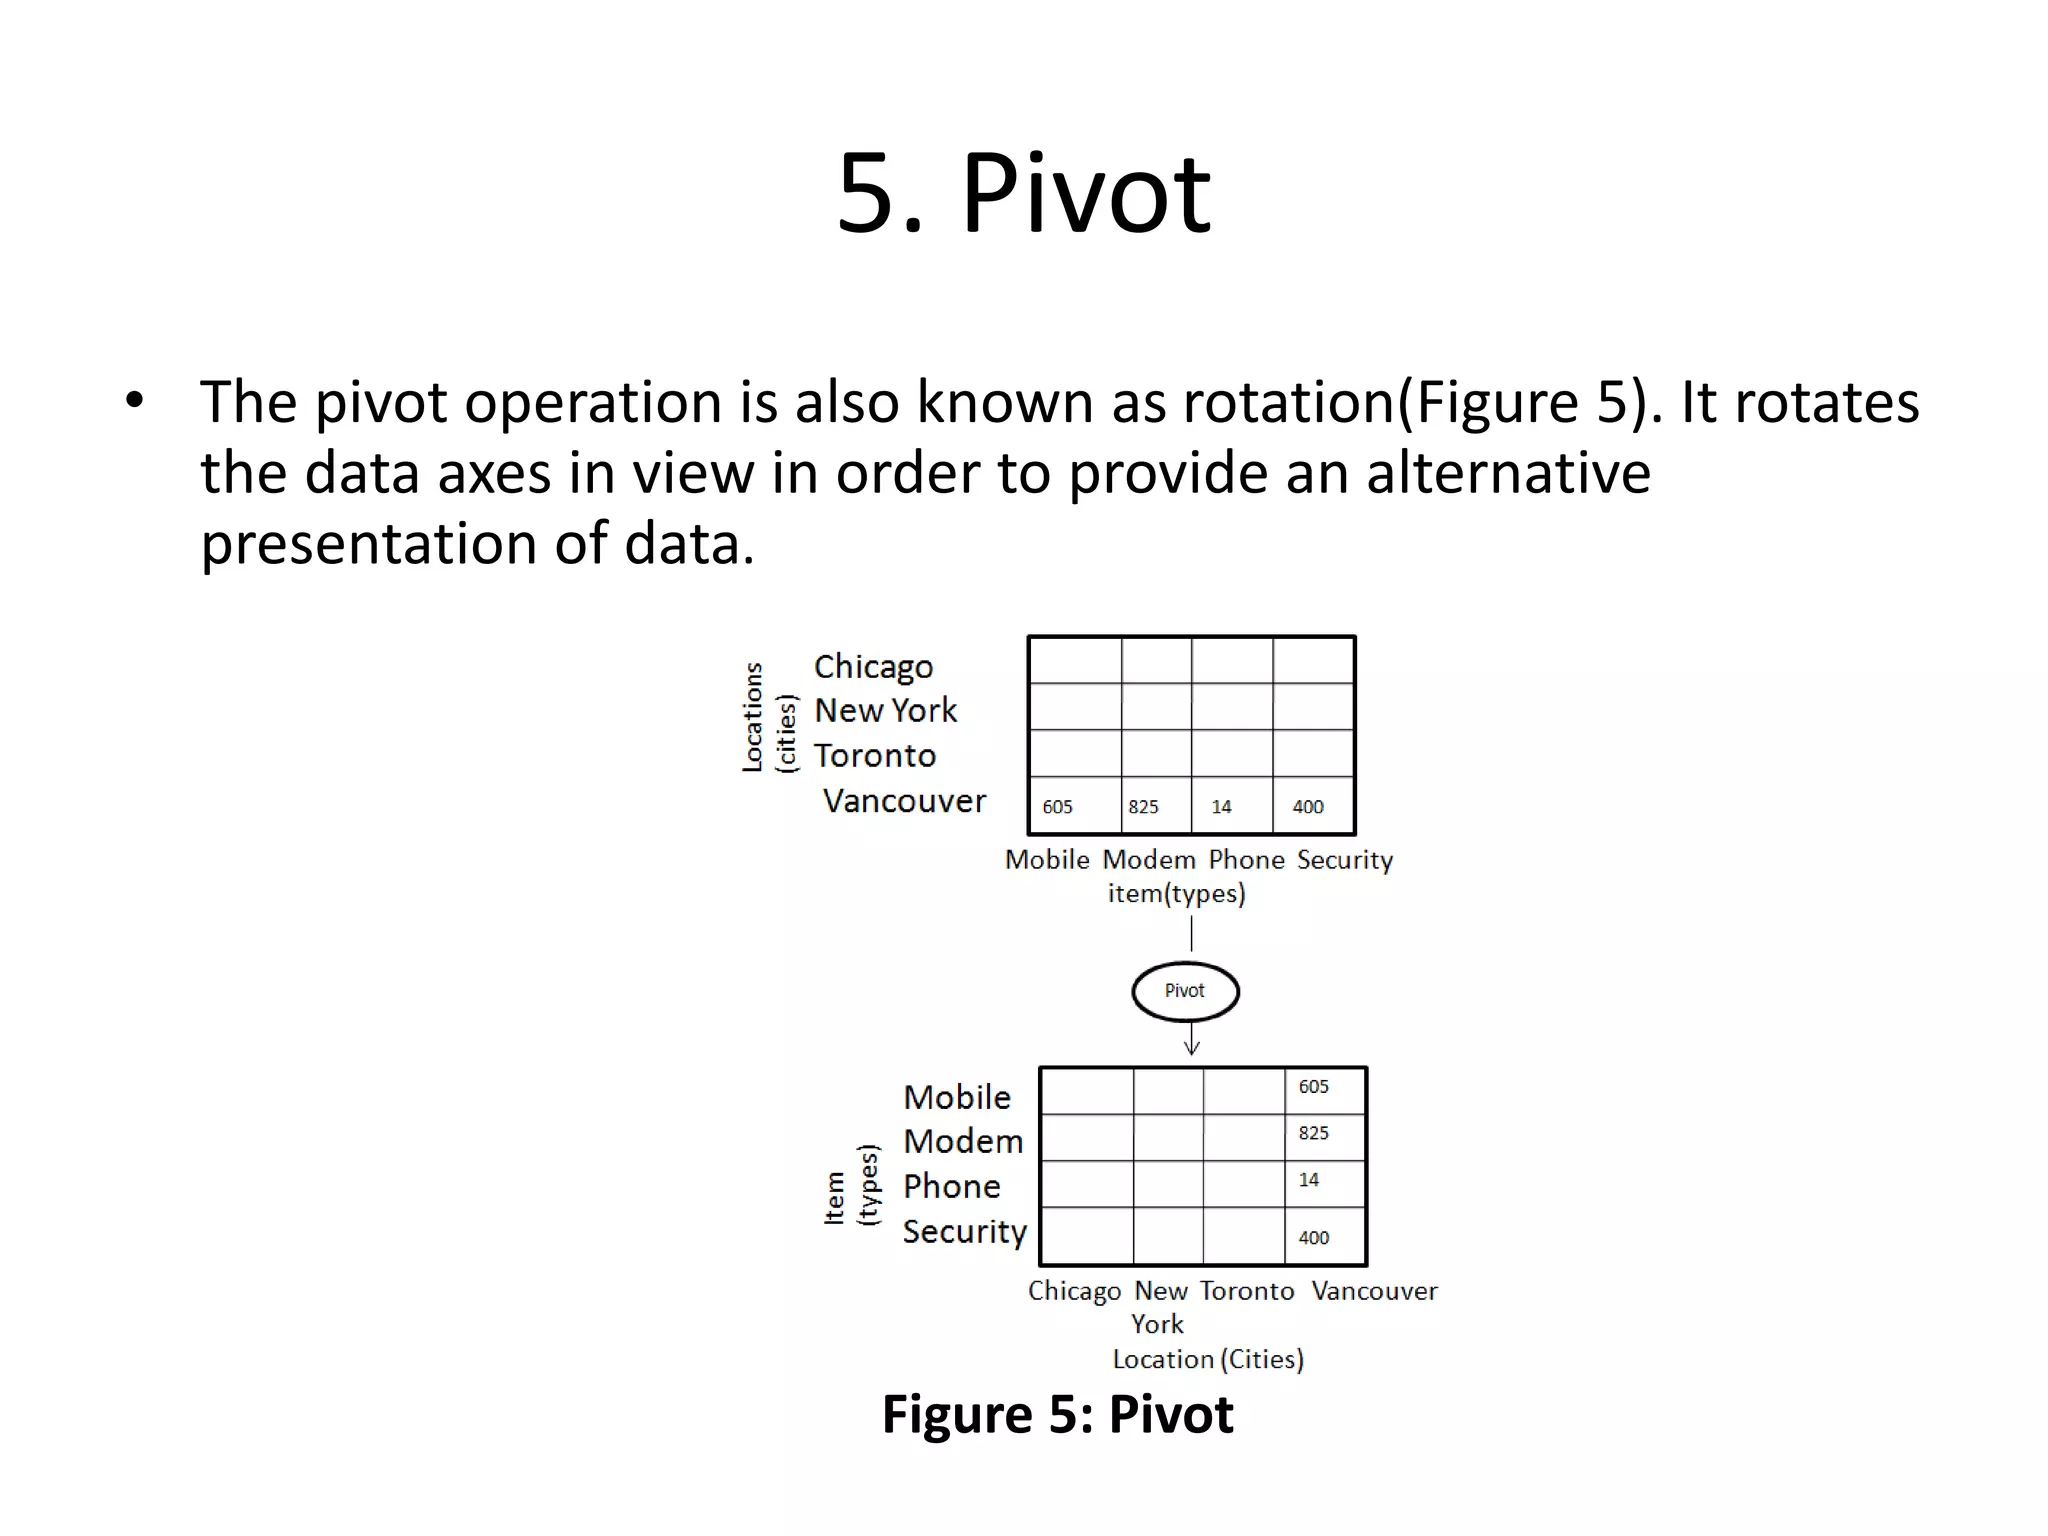
OLAP Operations
• Name : Kunj Desai
• Enrollment Number : 140950107022
• Branch : CSE – A
• Semester : 7th
• Year : 2017
Definition
• Online Analytical Processing Server (OLAP) is based on the
multidimensional data model.
• It allows managers, and analysts to get an insight of the
information through fast, consistent, and interactive access to
information.
• OLAP (Online Analytical Processing) is the technology behind
many Business Intelligence (BI) applications.
• OLAP is a powerful technology for data discovery, including
capabilities for limitless report viewing, complex analytical
calculations, and predictive “what if” scenario (budget,
forecast) planning.
Types of OLAP Server
• We have four types of OLAP servers:
1. Relational OLAP (ROLAP)
2. Multidimensional OLAP (MOLAP)
3. Hybrid OLAP (HOLAP)
4. Specialized SQL Servers
Multidimensional OLAP
• MOLAP uses array-based multidimensional storage engines
for multidimensional views of data.
• With multidimensional data stores, the storage utilization may
be low if the data set is sparse.
• Therefore, many MOLAP server use two levels of data storage
representation to handle dense and sparse data sets.
• Multidimensional structure is defined as "a variation of the
relational model that uses multidimensional structures to
organize data and express the relationships between data".
• Multidimensional structure is quite popular for analytical
databases that use online analytical processing (OLAP)
applications.
OLAP Operations
• Since OLAP servers are based on multidimensional view of
data, we will discuss OLAP operations in multidimensional
data.
• Here is the list of OLAP operations:
1. Roll-up
2. Drill-down
3. Slice and dice
4. Pivot (rotate)
1. Roll - up
• Roll-up performs aggregation on a data cube in any of the
following ways:
1. By climbing up a concept hierarchy for a dimension
2. By dimension reduction
3. Roll-up is performed by climbing up a concept hierarchy for the
dimension location.
4. Initially the concept hierarchy was "street < city < province <
country".
5. On rolling up, the data is aggregated by ascending the location
hierarchy from the level of city to the level of country.
6. The data is grouped into cities rather than countries.
7. When roll-up is performed, one or more dimensions from the
data cube are removed.
Diagram
• The following diagram illustrates how roll-up works:
Figure 1: Roll - Up
2. Drill - Down
• Drill-down is the reverse operation of roll-up. It is performed by
either of the following ways:
1. By stepping down a concept hierarchy for a dimension
2. By introducing a new dimension.
3. Drill-down is performed by stepping down a concept hierarchy
for the dimension time.
4. Initially the concept hierarchy was "day < month < quarter <
year."
5. On drilling down, the time dimension is descended from the
level of quarter to the level of month.
6. When drill-down is performed, one or more dimensions from
the data cube are added.
7. It navigates the data from less detailed data to highly detailed
data.
Diagram
• The following diagram illustrates how drill down works:
Figure 2: Drill - Down
3. Slice
• The slice operation selects one particular dimension from a
given cube and provides a new sub-cube.
• In the following diagram diagram(Figure 3) Slice is performed
for the dimension "time" using the criterion time = "Q1".
• It will form a new sub-cube by selecting one or more
dimensions.
Diagram
• The following diagram illustrates how Slice works:
Figure 3. Slice
4. Dice
• Dice selects two or more dimensions from a given cube and
provides a new sub-cube.
• This is shown in the following diagram (Figure 4 ) Dice is
shown .
• The dice operation on the cube based on the following
selection criteria involves three dimensions.
1. (location = "Toronto" or "Vancouver")
2. (time = "Q1" or "Q2")
3. (item =" Mobile" or "Modem")
Diagram
• The following diagram illustrates how dice works:
Figure 4 : Dice
5. Pivot
• The pivot operation is also known as rotation(Figure 5). It rotates
the data axes in view in order to provide an alternative
presentation of data.
Figure 5: Pivot

OLAP operations

  • 1.
    OLAP Operations • Name: Kunj Desai • Enrollment Number : 140950107022 • Branch : CSE – A • Semester : 7th • Year : 2017
  • 2.
    Definition • Online AnalyticalProcessing Server (OLAP) is based on the multidimensional data model. • It allows managers, and analysts to get an insight of the information through fast, consistent, and interactive access to information. • OLAP (Online Analytical Processing) is the technology behind many Business Intelligence (BI) applications. • OLAP is a powerful technology for data discovery, including capabilities for limitless report viewing, complex analytical calculations, and predictive “what if” scenario (budget, forecast) planning.
  • 3.
    Types of OLAPServer • We have four types of OLAP servers: 1. Relational OLAP (ROLAP) 2. Multidimensional OLAP (MOLAP) 3. Hybrid OLAP (HOLAP) 4. Specialized SQL Servers
  • 4.
    Multidimensional OLAP • MOLAPuses array-based multidimensional storage engines for multidimensional views of data. • With multidimensional data stores, the storage utilization may be low if the data set is sparse. • Therefore, many MOLAP server use two levels of data storage representation to handle dense and sparse data sets. • Multidimensional structure is defined as "a variation of the relational model that uses multidimensional structures to organize data and express the relationships between data". • Multidimensional structure is quite popular for analytical databases that use online analytical processing (OLAP) applications.
  • 5.
    OLAP Operations • SinceOLAP servers are based on multidimensional view of data, we will discuss OLAP operations in multidimensional data. • Here is the list of OLAP operations: 1. Roll-up 2. Drill-down 3. Slice and dice 4. Pivot (rotate)
  • 6.
    1. Roll -up • Roll-up performs aggregation on a data cube in any of the following ways: 1. By climbing up a concept hierarchy for a dimension 2. By dimension reduction 3. Roll-up is performed by climbing up a concept hierarchy for the dimension location. 4. Initially the concept hierarchy was "street < city < province < country". 5. On rolling up, the data is aggregated by ascending the location hierarchy from the level of city to the level of country. 6. The data is grouped into cities rather than countries. 7. When roll-up is performed, one or more dimensions from the data cube are removed.
  • 7.
    Diagram • The followingdiagram illustrates how roll-up works: Figure 1: Roll - Up
  • 8.
    2. Drill -Down • Drill-down is the reverse operation of roll-up. It is performed by either of the following ways: 1. By stepping down a concept hierarchy for a dimension 2. By introducing a new dimension. 3. Drill-down is performed by stepping down a concept hierarchy for the dimension time. 4. Initially the concept hierarchy was "day < month < quarter < year." 5. On drilling down, the time dimension is descended from the level of quarter to the level of month. 6. When drill-down is performed, one or more dimensions from the data cube are added. 7. It navigates the data from less detailed data to highly detailed data.
  • 9.
    Diagram • The followingdiagram illustrates how drill down works: Figure 2: Drill - Down
  • 10.
    3. Slice • Theslice operation selects one particular dimension from a given cube and provides a new sub-cube. • In the following diagram diagram(Figure 3) Slice is performed for the dimension "time" using the criterion time = "Q1". • It will form a new sub-cube by selecting one or more dimensions.
  • 11.
    Diagram • The followingdiagram illustrates how Slice works: Figure 3. Slice
  • 12.
    4. Dice • Diceselects two or more dimensions from a given cube and provides a new sub-cube. • This is shown in the following diagram (Figure 4 ) Dice is shown . • The dice operation on the cube based on the following selection criteria involves three dimensions. 1. (location = "Toronto" or "Vancouver") 2. (time = "Q1" or "Q2") 3. (item =" Mobile" or "Modem")
  • 13.
    Diagram • The followingdiagram illustrates how dice works: Figure 4 : Dice
  • 14.
    5. Pivot • Thepivot operation is also known as rotation(Figure 5). It rotates the data axes in view in order to provide an alternative presentation of data. Figure 5: Pivot