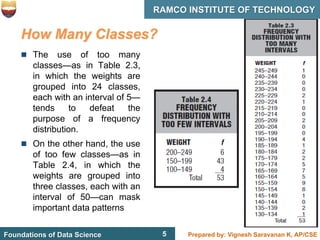
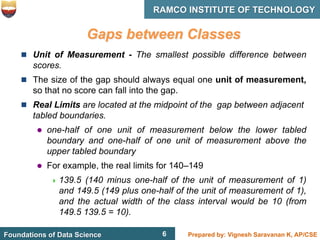
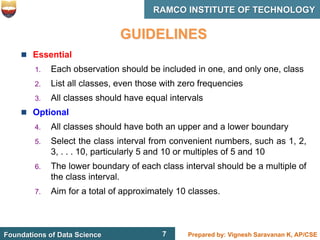
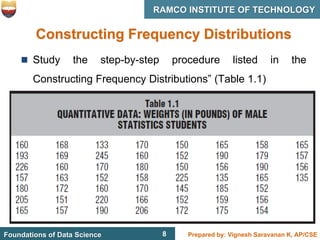
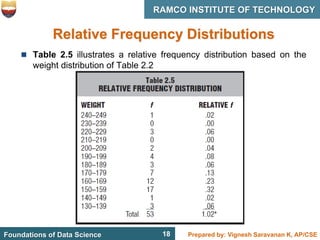
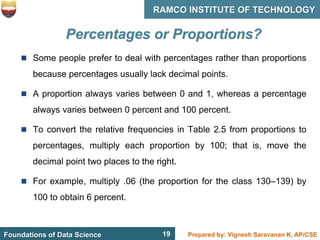
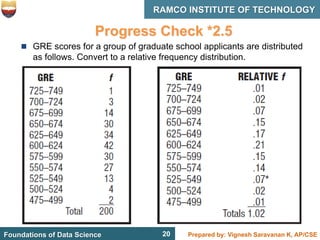
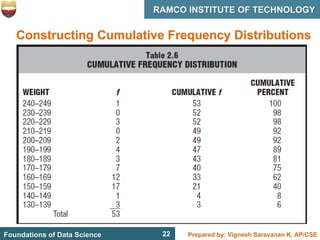
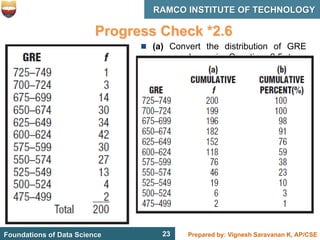
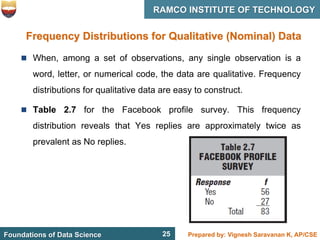
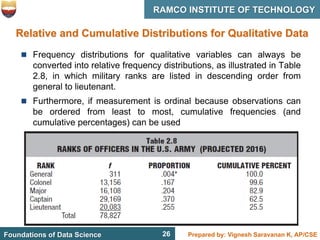
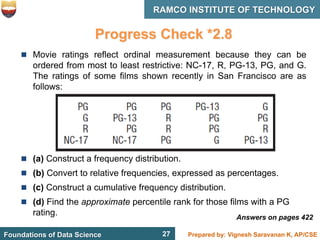
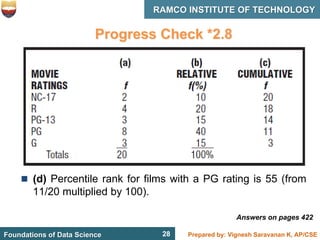
CS3352 - Foundations of Data Science
III Semester CSE
Prepared by, Vignesh Saravanan K, AP/CSE
- Frequency Distributions
- Relative Frequency Distributions
- Cumulative Frequency Distributions
UNIT 2 – Describing Data
Lecture - 3
Describing Data with Tables
2 Prepared by: Vignesh Saravanan K, AP/CSE
Foundations of Data Science
RAMCO INSTITUTE OF TECHNOLOGY
2
Describing data with TABLES
 well-summarized set of data
 Frequency Distributions for Quantitative Data
 Table 2.1 shows one way to organize the
weights of the male statistics students listed
 First, arrange a column of consecutive numbers,
beginning with the lightest weight (133) at the
bottom and ending with the heaviest weight
(245) at the top.
 each time its value appears in the original set of
data
3 Prepared by: Vignesh Saravanan K, AP/CSE
Foundations of Data Science
RAMCO INSTITUTE OF TECHNOLOGY
3
FREQUENCY DISTRIBUTIONS
 A frequency distribution is a collection of observations produced by
sorting observations into classes and showing their frequency (f) of
occurrence in each class.
 Frequency Distribution for Ungrouped Data - A frequency
distribution produced whenever observations are sorted into classes
of single values.
 The frequency distribution shown in Table 2.1 is only partially
displayed because there are more than 100 possible values between
the largest and smallest observations.
 Frequency distributions for ungrouped data are much more
informative when the number of possible values is less than 20.
 If there are 20 or more possible values, consider using a frequency
distribution for grouped data.
4 Prepared by: Vignesh Saravanan K, AP/CSE
Foundations of Data Science
RAMCO INSTITUTE OF TECHNOLOGY
4
FREQUENCY DISTRIBUTIONS
 Frequency Distribution for Grouped Data
 A frequency distribution produced whenever
observations are sorted into classes of more
than one values.
 When observations are sorted into classes of
more than one value, as in Table 2.2, the result
is referred to as a frequency distribution for
grouped data.
 Data are grouped into class intervals with 10
possible values each.
5 Prepared by: Vignesh Saravanan K, AP/CSE
Foundations of Data Science
RAMCO INSTITUTE OF TECHNOLOGY
5
How Many Classes?
 The use of too many
classes—as in Table 2.3,
in which the weights are
grouped into 24 classes,
each with an interval of 5—
tends to defeat the
purpose of a frequency
distribution.
 On the other hand, the use
of too few classes—as in
Table 2.4, in which the
weights are grouped into
three classes, each with an
interval of 50—can mask
important data patterns
6 Prepared by: Vignesh Saravanan K, AP/CSE
Foundations of Data Science
RAMCO INSTITUTE OF TECHNOLOGY
6
Gaps between Classes
 Unit of Measurement - The smallest possible difference between
scores.
 The size of the gap should always equal one unit of measurement,
so that no score can fall into the gap.
 Real Limits are located at the midpoint of the gap between adjacent
tabled boundaries.
 one-half of one unit of measurement below the lower tabled
boundary and one-half of one unit of measurement above the
upper tabled boundary
 For example, the real limits for 140–149
 139.5 (140 minus one-half of the unit of measurement of 1)
and 149.5 (149 plus one-half of the unit of measurement of 1),
and the actual width of the class interval would be 10 (from
149.5 139.5 = 10).
7 Prepared by: Vignesh Saravanan K, AP/CSE
Foundations of Data Science
RAMCO INSTITUTE OF TECHNOLOGY
7
GUIDELINES
 Essential
1. Each observation should be included in one, and only one, class
2. List all classes, even those with zero frequencies
3. All classes should have equal intervals
 Optional
4. All classes should have both an upper and a lower boundary
5. Select the class interval from convenient numbers, such as 1, 2,
3, . . . 10, particularly 5 and 10 or multiples of 5 and 10
6. The lower boundary of each class interval should be a multiple of
the class interval.
7. Aim for a total of approximately 10 classes.
8 Prepared by: Vignesh Saravanan K, AP/CSE
Foundations of Data Science
RAMCO INSTITUTE OF TECHNOLOGY
8
Constructing Frequency Distributions
 Study the step-by-step procedure listed in the
Constructing Frequency Distributions” (Table 1.1)
9 Prepared by: Vignesh Saravanan K, AP/CSE
Foundations of Data Science
RAMCO INSTITUTE OF TECHNOLOGY
9
Constructing Frequency Distributions
1. Find the range, that is, the difference between the largest and
smallest observations. (245 - 133 = 112)
2. Find the class interval required to span the range by dividing the
range by the desired number of classes (ordinarily 10)
3. Round off to the nearest convenient interval (such as 1, 2, 3…10,
particularly 5 or 10 or multiples of 5 or 10).
4. Determine where the lowest class should begin. (Ordinarily, this
number should be a multiple of the class interval.)
5. Determine where the lowest class should end by adding the class
interval to the lower boundary and then subtracting one unit of
measurement
10 Prepared by: Vignesh Saravanan K, AP/CSE
Foundations of Data Science
RAMCO INSTITUTE OF TECHNOLOGY
10
Constructing Frequency Distributions
6. Working upward, list as many equivalent classes as are required
to include the largest observation, such that the last class includes
245, the largest score. In the present example, list 130–139, 140–
149, . . . , 240–249, so that the last class includes 245, the largest
score
7. Indicate with a tally the class in which each observation falls.
8. Replace the tally count for each class with a number—the
frequency (f)—and show the total of all frequencies
9. Supply headings for both columns and a title for the table.
11 Prepared by: Vignesh Saravanan K, AP/CSE
Foundations of Data Science
RAMCO INSTITUTE OF TECHNOLOGY
11
Progress Check *2.1
 Students in a theater arts appreciation class rated the classic film The
Wizard of Oz on a 10-point scale, ranging from 1 (poor) to 10
(excellent), as follows:
 Since the number of possible values is relatively small—only 10—it’s
appropriate to construct a frequency distribution for ungrouped data.
Do this.
12 Prepared by: Vignesh Saravanan K, AP/CSE
Foundations of Data Science
RAMCO INSTITUTE OF TECHNOLOGY
12
Progress Check *2.2
 The IQ scores for a group of 35 high school dropouts are as follows:
 (a) Construct a frequency distribution for grouped data.
 (b) Specify the real limits for the lowest class interval in this
frequency distribution.
Answers on pages 420 and 421
13 Prepared by: Vignesh Saravanan K, AP/CSE
Foundations of Data Science
RAMCO INSTITUTE OF TECHNOLOGY
13
Progress Check *2.2
Answers on pages 420 and 421
14 Prepared by: Vignesh Saravanan K, AP/CSE
Foundations of Data Science
RAMCO INSTITUTE OF TECHNOLOGY
14
Progress Check *2.3
 What are some possible poor features of the following frequency
distribution?
Answers on pages 421
• Not all observations can be assigned to one and only
one class (because of gap between 20–22 and 25–30
and overlap between 25–30 and 30–34).
• All classes are not equal in width (25–30 versus 30–
34).
• All classes do not have both boundaries (35–above).
15 Prepared by: Vignesh Saravanan K, AP/CSE
Foundations of Data Science
RAMCO INSTITUTE OF TECHNOLOGY
15
OUTLIERS - A very extreme score.
 The appearance of one or more very extreme scores / values
are called as outliers.
 Whenever you encounter an outrageously extreme value,
such as a GPA of 0.06, attempt to verify its accuracy.
 For instance, was a respectable GPA of 3.06 recorded
erroneously as 0.06?
 If the outlier survives an accuracy check, it should be treated
as a legitimate score.
16 Prepared by: Vignesh Saravanan K, AP/CSE
Foundations of Data Science
RAMCO INSTITUTE OF TECHNOLOGY
16
Progress Check *2.4
 Identify any outliers in each of the following sets of data collected
from nine college students.
 Outliers are:
 a summer income of $25,700;
 an age of 61;
 a family size of 18.
 No outliers for GPA.
17 Prepared by: Vignesh Saravanan K, AP/CSE
Foundations of Data Science
RAMCO INSTITUTE OF TECHNOLOGY
17
RELATIVE FREQUENCY DISTRIBUTIONS
 Relative frequency distributions show the frequency of each class as
a part or fraction of the total frequency for the entire distribution.
 This type of distribution is especially helpful when you must compare
two or more distributions based on different total numbers of
observations.
 For instance, you might want to compare the distribution of ages for
500 residents of a small town with that for the approximately 300
million residents of the United States.
 The conversion to relative frequencies allows a direct comparison of
the shapes of these two distributions without having to adjust for the
different total numbers of observations.
 To convert a frequency distribution into a relative frequency
distribution, divide the frequency for each class by the total
frequency for the entire distribution.
18 Prepared by: Vignesh Saravanan K, AP/CSE
Foundations of Data Science
RAMCO INSTITUTE OF TECHNOLOGY
18
Relative Frequency Distributions
 Table 2.5 illustrates a relative frequency distribution based on the
weight distribution of Table 2.2
19 Prepared by: Vignesh Saravanan K, AP/CSE
Foundations of Data Science
RAMCO INSTITUTE OF TECHNOLOGY
19
Percentages or Proportions?
 Some people prefer to deal with percentages rather than proportions
because percentages usually lack decimal points.
 A proportion always varies between 0 and 1, whereas a percentage
always varies between 0 percent and 100 percent.
 To convert the relative frequencies in Table 2.5 from proportions to
percentages, multiply each proportion by 100; that is, move the
decimal point two places to the right.
 For example, multiply .06 (the proportion for the class 130–139) by
100 to obtain 6 percent.
20 Prepared by: Vignesh Saravanan K, AP/CSE
Foundations of Data Science
RAMCO INSTITUTE OF TECHNOLOGY
20
Progress Check *2.5
 GRE scores for a group of graduate school applicants are distributed
as follows. Convert to a relative frequency distribution.
21 Prepared by: Vignesh Saravanan K, AP/CSE
Foundations of Data Science
RAMCO INSTITUTE OF TECHNOLOGY
21
Constructing Cumulative Frequency Distributions
 Cumulative frequency distributions show the total number of
observations in each class and in all lower-ranked classes.
 Cumulative percentages are often referred to as percentile ranks.
 To convert a frequency distribution into a cumulative frequency
distribution, add to the frequency of each class the sum of the
frequencies of all classes ranked below it.
 This gives the cumulative frequency for that class.
 Begin with the lowest-ranked class in the frequency distribution and
work upward, finding the cumulative frequencies in ascending order.
22 Prepared by: Vignesh Saravanan K, AP/CSE
Foundations of Data Science
RAMCO INSTITUTE OF TECHNOLOGY
22
Constructing Cumulative Frequency Distributions
• In Table 2.6, the cumulative frequency for the class 130–139 is 3,
since there are no classes ranked lower.
• The cumulative frequency for the class 140–149 is 4, since 1 is the
frequency for that class and 3 is the frequency of all lower-ranked
classes.
• The cumulative frequency for the class 150–159 is 21, since 17 is the
frequency for that class and 4 is the sum of the frequencies of all
lower-ranked classes.
23 Prepared by: Vignesh Saravanan K, AP/CSE
Foundations of Data Science
RAMCO INSTITUTE OF TECHNOLOGY
23
Progress Check *2.6
 (a) Convert the distribution of GRE
scores shown in Question 2.5 to a
cumulative frequency distribution.
 (b) Convert the distribution of GRE
scores obtained in Question 2.6(a) to a
cumulative percent frequency
distribution.
24 Prepared by: Vignesh Saravanan K, AP/CSE
Foundations of Data Science
RAMCO INSTITUTE OF TECHNOLOGY
24
Percentile Ranks
 The percentile rank of a score indicates the percentage of scores in
the entire distribution with similar or smaller values than that score.
 Approximate Percentile Ranks: - The assignment of exact
percentile ranks requires that cumulative percentages be obtained
from frequency distributions for ungrouped data. If we have access
only to a frequency distribution for grouped data, as in Table 2.6,
cumulative percentages can be used to assign approximate
percentile ranks.
 In Table 2.6, for example, any weight in the class 170–179 could be
assigned an approximate percentile rank of 75, since 75 is the
cumulative percent for this class.
 Progress Check *2.7 Referring to Table 2.6, find the approximate
percentile rank of any weight in the class 200–209.
 The approximate percentile rank for weights between 200 and
209 lbs is 92 (because 92 is the cumulative percent for this
interval).
25 Prepared by: Vignesh Saravanan K, AP/CSE
Foundations of Data Science
RAMCO INSTITUTE OF TECHNOLOGY
25
Frequency Distributions for Qualitative (Nominal) Data
 When, among a set of observations, any single observation is a
word, letter, or numerical code, the data are qualitative. Frequency
distributions for qualitative data are easy to construct.
 Table 2.7 for the Facebook profile survey. This frequency
distribution reveals that Yes replies are approximately twice as
prevalent as No replies.
26 Prepared by: Vignesh Saravanan K, AP/CSE
Foundations of Data Science
RAMCO INSTITUTE OF TECHNOLOGY
26
Relative and Cumulative Distributions for Qualitative Data
 Frequency distributions for qualitative variables can always be
converted into relative frequency distributions, as illustrated in Table
2.8, in which military ranks are listed in descending order from
general to lieutenant.
 Furthermore, if measurement is ordinal because observations can
be ordered from least to most, cumulative frequencies (and
cumulative percentages) can be used
27 Prepared by: Vignesh Saravanan K, AP/CSE
Foundations of Data Science
RAMCO INSTITUTE OF TECHNOLOGY
27
Progress Check *2.8
 Movie ratings reflect ordinal measurement because they can be
ordered from most to least restrictive: NC-17, R, PG-13, PG, and G.
The ratings of some films shown recently in San Francisco are as
follows:
 (a) Construct a frequency distribution.
 (b) Convert to relative frequencies, expressed as percentages.
 (c) Construct a cumulative frequency distribution.
 (d) Find the approximate percentile rank for those films with a PG
rating. Answers on pages 422
28 Prepared by: Vignesh Saravanan K, AP/CSE
Foundations of Data Science
RAMCO INSTITUTE OF TECHNOLOGY
28
Progress Check *2.8
 (d) Percentile rank for films with a PG rating is 55 (from
11/20 multiplied by 100).
Answers on pages 422
CS3352 - Foundations of Data Science
III Semester CSE
Prepared by: Vignesh Saravanan K, AP/CSE
End of Lecture
• Describing data with TABLES
• Frequency Distributions
• Guidelines
• Constructing Frequency Distributions
• Progress Checks

Unit - 2 - Lecture-3.pdf

  • 1.
    CS3352 - Foundationsof Data Science III Semester CSE Prepared by, Vignesh Saravanan K, AP/CSE - Frequency Distributions - Relative Frequency Distributions - Cumulative Frequency Distributions UNIT 2 – Describing Data Lecture - 3 Describing Data with Tables
  • 2.
    2 Prepared by:Vignesh Saravanan K, AP/CSE Foundations of Data Science RAMCO INSTITUTE OF TECHNOLOGY 2 Describing data with TABLES  well-summarized set of data  Frequency Distributions for Quantitative Data  Table 2.1 shows one way to organize the weights of the male statistics students listed  First, arrange a column of consecutive numbers, beginning with the lightest weight (133) at the bottom and ending with the heaviest weight (245) at the top.  each time its value appears in the original set of data
  • 3.
    3 Prepared by:Vignesh Saravanan K, AP/CSE Foundations of Data Science RAMCO INSTITUTE OF TECHNOLOGY 3 FREQUENCY DISTRIBUTIONS  A frequency distribution is a collection of observations produced by sorting observations into classes and showing their frequency (f) of occurrence in each class.  Frequency Distribution for Ungrouped Data - A frequency distribution produced whenever observations are sorted into classes of single values.  The frequency distribution shown in Table 2.1 is only partially displayed because there are more than 100 possible values between the largest and smallest observations.  Frequency distributions for ungrouped data are much more informative when the number of possible values is less than 20.  If there are 20 or more possible values, consider using a frequency distribution for grouped data.
  • 4.
    4 Prepared by:Vignesh Saravanan K, AP/CSE Foundations of Data Science RAMCO INSTITUTE OF TECHNOLOGY 4 FREQUENCY DISTRIBUTIONS  Frequency Distribution for Grouped Data  A frequency distribution produced whenever observations are sorted into classes of more than one values.  When observations are sorted into classes of more than one value, as in Table 2.2, the result is referred to as a frequency distribution for grouped data.  Data are grouped into class intervals with 10 possible values each.
  • 5.
    5 Prepared by:Vignesh Saravanan K, AP/CSE Foundations of Data Science RAMCO INSTITUTE OF TECHNOLOGY 5 How Many Classes?  The use of too many classes—as in Table 2.3, in which the weights are grouped into 24 classes, each with an interval of 5— tends to defeat the purpose of a frequency distribution.  On the other hand, the use of too few classes—as in Table 2.4, in which the weights are grouped into three classes, each with an interval of 50—can mask important data patterns
  • 6.
    6 Prepared by:Vignesh Saravanan K, AP/CSE Foundations of Data Science RAMCO INSTITUTE OF TECHNOLOGY 6 Gaps between Classes  Unit of Measurement - The smallest possible difference between scores.  The size of the gap should always equal one unit of measurement, so that no score can fall into the gap.  Real Limits are located at the midpoint of the gap between adjacent tabled boundaries.  one-half of one unit of measurement below the lower tabled boundary and one-half of one unit of measurement above the upper tabled boundary  For example, the real limits for 140–149  139.5 (140 minus one-half of the unit of measurement of 1) and 149.5 (149 plus one-half of the unit of measurement of 1), and the actual width of the class interval would be 10 (from 149.5 139.5 = 10).
  • 7.
    7 Prepared by:Vignesh Saravanan K, AP/CSE Foundations of Data Science RAMCO INSTITUTE OF TECHNOLOGY 7 GUIDELINES  Essential 1. Each observation should be included in one, and only one, class 2. List all classes, even those with zero frequencies 3. All classes should have equal intervals  Optional 4. All classes should have both an upper and a lower boundary 5. Select the class interval from convenient numbers, such as 1, 2, 3, . . . 10, particularly 5 and 10 or multiples of 5 and 10 6. The lower boundary of each class interval should be a multiple of the class interval. 7. Aim for a total of approximately 10 classes.
  • 8.
    8 Prepared by:Vignesh Saravanan K, AP/CSE Foundations of Data Science RAMCO INSTITUTE OF TECHNOLOGY 8 Constructing Frequency Distributions  Study the step-by-step procedure listed in the Constructing Frequency Distributions” (Table 1.1)
  • 9.
    9 Prepared by:Vignesh Saravanan K, AP/CSE Foundations of Data Science RAMCO INSTITUTE OF TECHNOLOGY 9 Constructing Frequency Distributions 1. Find the range, that is, the difference between the largest and smallest observations. (245 - 133 = 112) 2. Find the class interval required to span the range by dividing the range by the desired number of classes (ordinarily 10) 3. Round off to the nearest convenient interval (such as 1, 2, 3…10, particularly 5 or 10 or multiples of 5 or 10). 4. Determine where the lowest class should begin. (Ordinarily, this number should be a multiple of the class interval.) 5. Determine where the lowest class should end by adding the class interval to the lower boundary and then subtracting one unit of measurement
  • 10.
    10 Prepared by:Vignesh Saravanan K, AP/CSE Foundations of Data Science RAMCO INSTITUTE OF TECHNOLOGY 10 Constructing Frequency Distributions 6. Working upward, list as many equivalent classes as are required to include the largest observation, such that the last class includes 245, the largest score. In the present example, list 130–139, 140– 149, . . . , 240–249, so that the last class includes 245, the largest score 7. Indicate with a tally the class in which each observation falls. 8. Replace the tally count for each class with a number—the frequency (f)—and show the total of all frequencies 9. Supply headings for both columns and a title for the table.
  • 11.
    11 Prepared by:Vignesh Saravanan K, AP/CSE Foundations of Data Science RAMCO INSTITUTE OF TECHNOLOGY 11 Progress Check *2.1  Students in a theater arts appreciation class rated the classic film The Wizard of Oz on a 10-point scale, ranging from 1 (poor) to 10 (excellent), as follows:  Since the number of possible values is relatively small—only 10—it’s appropriate to construct a frequency distribution for ungrouped data. Do this.
  • 12.
    12 Prepared by:Vignesh Saravanan K, AP/CSE Foundations of Data Science RAMCO INSTITUTE OF TECHNOLOGY 12 Progress Check *2.2  The IQ scores for a group of 35 high school dropouts are as follows:  (a) Construct a frequency distribution for grouped data.  (b) Specify the real limits for the lowest class interval in this frequency distribution. Answers on pages 420 and 421
  • 13.
    13 Prepared by:Vignesh Saravanan K, AP/CSE Foundations of Data Science RAMCO INSTITUTE OF TECHNOLOGY 13 Progress Check *2.2 Answers on pages 420 and 421
  • 14.
    14 Prepared by:Vignesh Saravanan K, AP/CSE Foundations of Data Science RAMCO INSTITUTE OF TECHNOLOGY 14 Progress Check *2.3  What are some possible poor features of the following frequency distribution? Answers on pages 421 • Not all observations can be assigned to one and only one class (because of gap between 20–22 and 25–30 and overlap between 25–30 and 30–34). • All classes are not equal in width (25–30 versus 30– 34). • All classes do not have both boundaries (35–above).
  • 15.
    15 Prepared by:Vignesh Saravanan K, AP/CSE Foundations of Data Science RAMCO INSTITUTE OF TECHNOLOGY 15 OUTLIERS - A very extreme score.  The appearance of one or more very extreme scores / values are called as outliers.  Whenever you encounter an outrageously extreme value, such as a GPA of 0.06, attempt to verify its accuracy.  For instance, was a respectable GPA of 3.06 recorded erroneously as 0.06?  If the outlier survives an accuracy check, it should be treated as a legitimate score.
  • 16.
    16 Prepared by:Vignesh Saravanan K, AP/CSE Foundations of Data Science RAMCO INSTITUTE OF TECHNOLOGY 16 Progress Check *2.4  Identify any outliers in each of the following sets of data collected from nine college students.  Outliers are:  a summer income of $25,700;  an age of 61;  a family size of 18.  No outliers for GPA.
  • 17.
    17 Prepared by:Vignesh Saravanan K, AP/CSE Foundations of Data Science RAMCO INSTITUTE OF TECHNOLOGY 17 RELATIVE FREQUENCY DISTRIBUTIONS  Relative frequency distributions show the frequency of each class as a part or fraction of the total frequency for the entire distribution.  This type of distribution is especially helpful when you must compare two or more distributions based on different total numbers of observations.  For instance, you might want to compare the distribution of ages for 500 residents of a small town with that for the approximately 300 million residents of the United States.  The conversion to relative frequencies allows a direct comparison of the shapes of these two distributions without having to adjust for the different total numbers of observations.  To convert a frequency distribution into a relative frequency distribution, divide the frequency for each class by the total frequency for the entire distribution.
  • 18.
    18 Prepared by:Vignesh Saravanan K, AP/CSE Foundations of Data Science RAMCO INSTITUTE OF TECHNOLOGY 18 Relative Frequency Distributions  Table 2.5 illustrates a relative frequency distribution based on the weight distribution of Table 2.2
  • 19.
    19 Prepared by:Vignesh Saravanan K, AP/CSE Foundations of Data Science RAMCO INSTITUTE OF TECHNOLOGY 19 Percentages or Proportions?  Some people prefer to deal with percentages rather than proportions because percentages usually lack decimal points.  A proportion always varies between 0 and 1, whereas a percentage always varies between 0 percent and 100 percent.  To convert the relative frequencies in Table 2.5 from proportions to percentages, multiply each proportion by 100; that is, move the decimal point two places to the right.  For example, multiply .06 (the proportion for the class 130–139) by 100 to obtain 6 percent.
  • 20.
    20 Prepared by:Vignesh Saravanan K, AP/CSE Foundations of Data Science RAMCO INSTITUTE OF TECHNOLOGY 20 Progress Check *2.5  GRE scores for a group of graduate school applicants are distributed as follows. Convert to a relative frequency distribution.
  • 21.
    21 Prepared by:Vignesh Saravanan K, AP/CSE Foundations of Data Science RAMCO INSTITUTE OF TECHNOLOGY 21 Constructing Cumulative Frequency Distributions  Cumulative frequency distributions show the total number of observations in each class and in all lower-ranked classes.  Cumulative percentages are often referred to as percentile ranks.  To convert a frequency distribution into a cumulative frequency distribution, add to the frequency of each class the sum of the frequencies of all classes ranked below it.  This gives the cumulative frequency for that class.  Begin with the lowest-ranked class in the frequency distribution and work upward, finding the cumulative frequencies in ascending order.
  • 22.
    22 Prepared by:Vignesh Saravanan K, AP/CSE Foundations of Data Science RAMCO INSTITUTE OF TECHNOLOGY 22 Constructing Cumulative Frequency Distributions • In Table 2.6, the cumulative frequency for the class 130–139 is 3, since there are no classes ranked lower. • The cumulative frequency for the class 140–149 is 4, since 1 is the frequency for that class and 3 is the frequency of all lower-ranked classes. • The cumulative frequency for the class 150–159 is 21, since 17 is the frequency for that class and 4 is the sum of the frequencies of all lower-ranked classes.
  • 23.
    23 Prepared by:Vignesh Saravanan K, AP/CSE Foundations of Data Science RAMCO INSTITUTE OF TECHNOLOGY 23 Progress Check *2.6  (a) Convert the distribution of GRE scores shown in Question 2.5 to a cumulative frequency distribution.  (b) Convert the distribution of GRE scores obtained in Question 2.6(a) to a cumulative percent frequency distribution.
  • 24.
    24 Prepared by:Vignesh Saravanan K, AP/CSE Foundations of Data Science RAMCO INSTITUTE OF TECHNOLOGY 24 Percentile Ranks  The percentile rank of a score indicates the percentage of scores in the entire distribution with similar or smaller values than that score.  Approximate Percentile Ranks: - The assignment of exact percentile ranks requires that cumulative percentages be obtained from frequency distributions for ungrouped data. If we have access only to a frequency distribution for grouped data, as in Table 2.6, cumulative percentages can be used to assign approximate percentile ranks.  In Table 2.6, for example, any weight in the class 170–179 could be assigned an approximate percentile rank of 75, since 75 is the cumulative percent for this class.  Progress Check *2.7 Referring to Table 2.6, find the approximate percentile rank of any weight in the class 200–209.  The approximate percentile rank for weights between 200 and 209 lbs is 92 (because 92 is the cumulative percent for this interval).
  • 25.
    25 Prepared by:Vignesh Saravanan K, AP/CSE Foundations of Data Science RAMCO INSTITUTE OF TECHNOLOGY 25 Frequency Distributions for Qualitative (Nominal) Data  When, among a set of observations, any single observation is a word, letter, or numerical code, the data are qualitative. Frequency distributions for qualitative data are easy to construct.  Table 2.7 for the Facebook profile survey. This frequency distribution reveals that Yes replies are approximately twice as prevalent as No replies.
  • 26.
    26 Prepared by:Vignesh Saravanan K, AP/CSE Foundations of Data Science RAMCO INSTITUTE OF TECHNOLOGY 26 Relative and Cumulative Distributions for Qualitative Data  Frequency distributions for qualitative variables can always be converted into relative frequency distributions, as illustrated in Table 2.8, in which military ranks are listed in descending order from general to lieutenant.  Furthermore, if measurement is ordinal because observations can be ordered from least to most, cumulative frequencies (and cumulative percentages) can be used
  • 27.
    27 Prepared by:Vignesh Saravanan K, AP/CSE Foundations of Data Science RAMCO INSTITUTE OF TECHNOLOGY 27 Progress Check *2.8  Movie ratings reflect ordinal measurement because they can be ordered from most to least restrictive: NC-17, R, PG-13, PG, and G. The ratings of some films shown recently in San Francisco are as follows:  (a) Construct a frequency distribution.  (b) Convert to relative frequencies, expressed as percentages.  (c) Construct a cumulative frequency distribution.  (d) Find the approximate percentile rank for those films with a PG rating. Answers on pages 422
  • 28.
    28 Prepared by:Vignesh Saravanan K, AP/CSE Foundations of Data Science RAMCO INSTITUTE OF TECHNOLOGY 28 Progress Check *2.8  (d) Percentile rank for films with a PG rating is 55 (from 11/20 multiplied by 100). Answers on pages 422
  • 29.
    CS3352 - Foundationsof Data Science III Semester CSE Prepared by: Vignesh Saravanan K, AP/CSE End of Lecture • Describing data with TABLES • Frequency Distributions • Guidelines • Constructing Frequency Distributions • Progress Checks