Downloaded 127 times
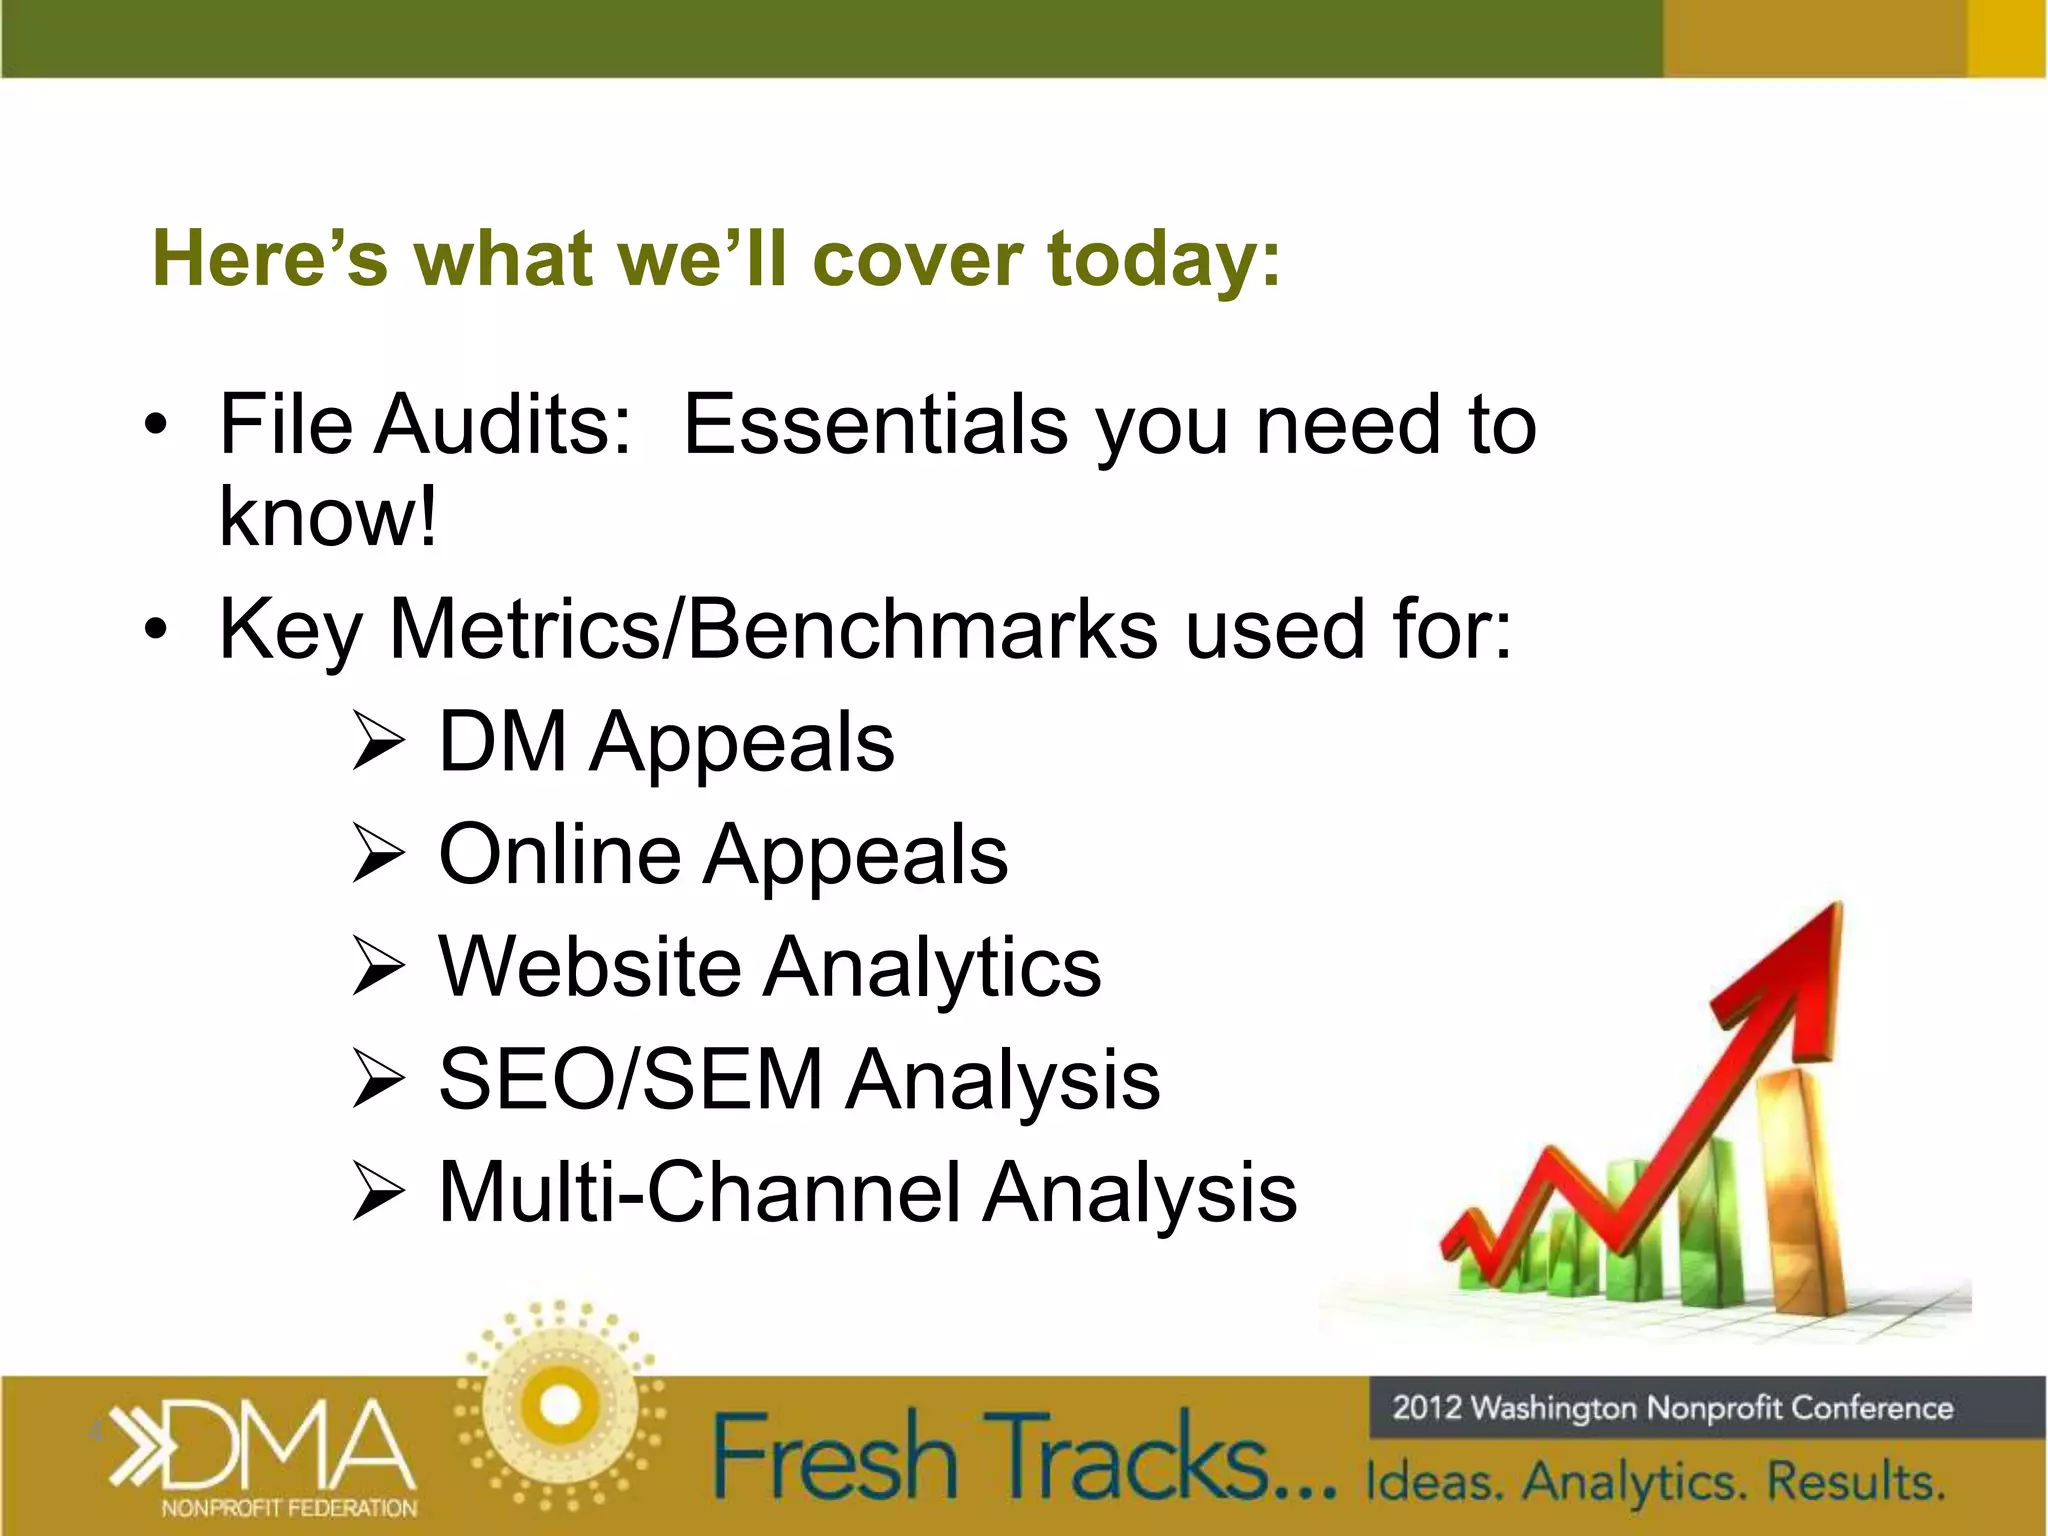

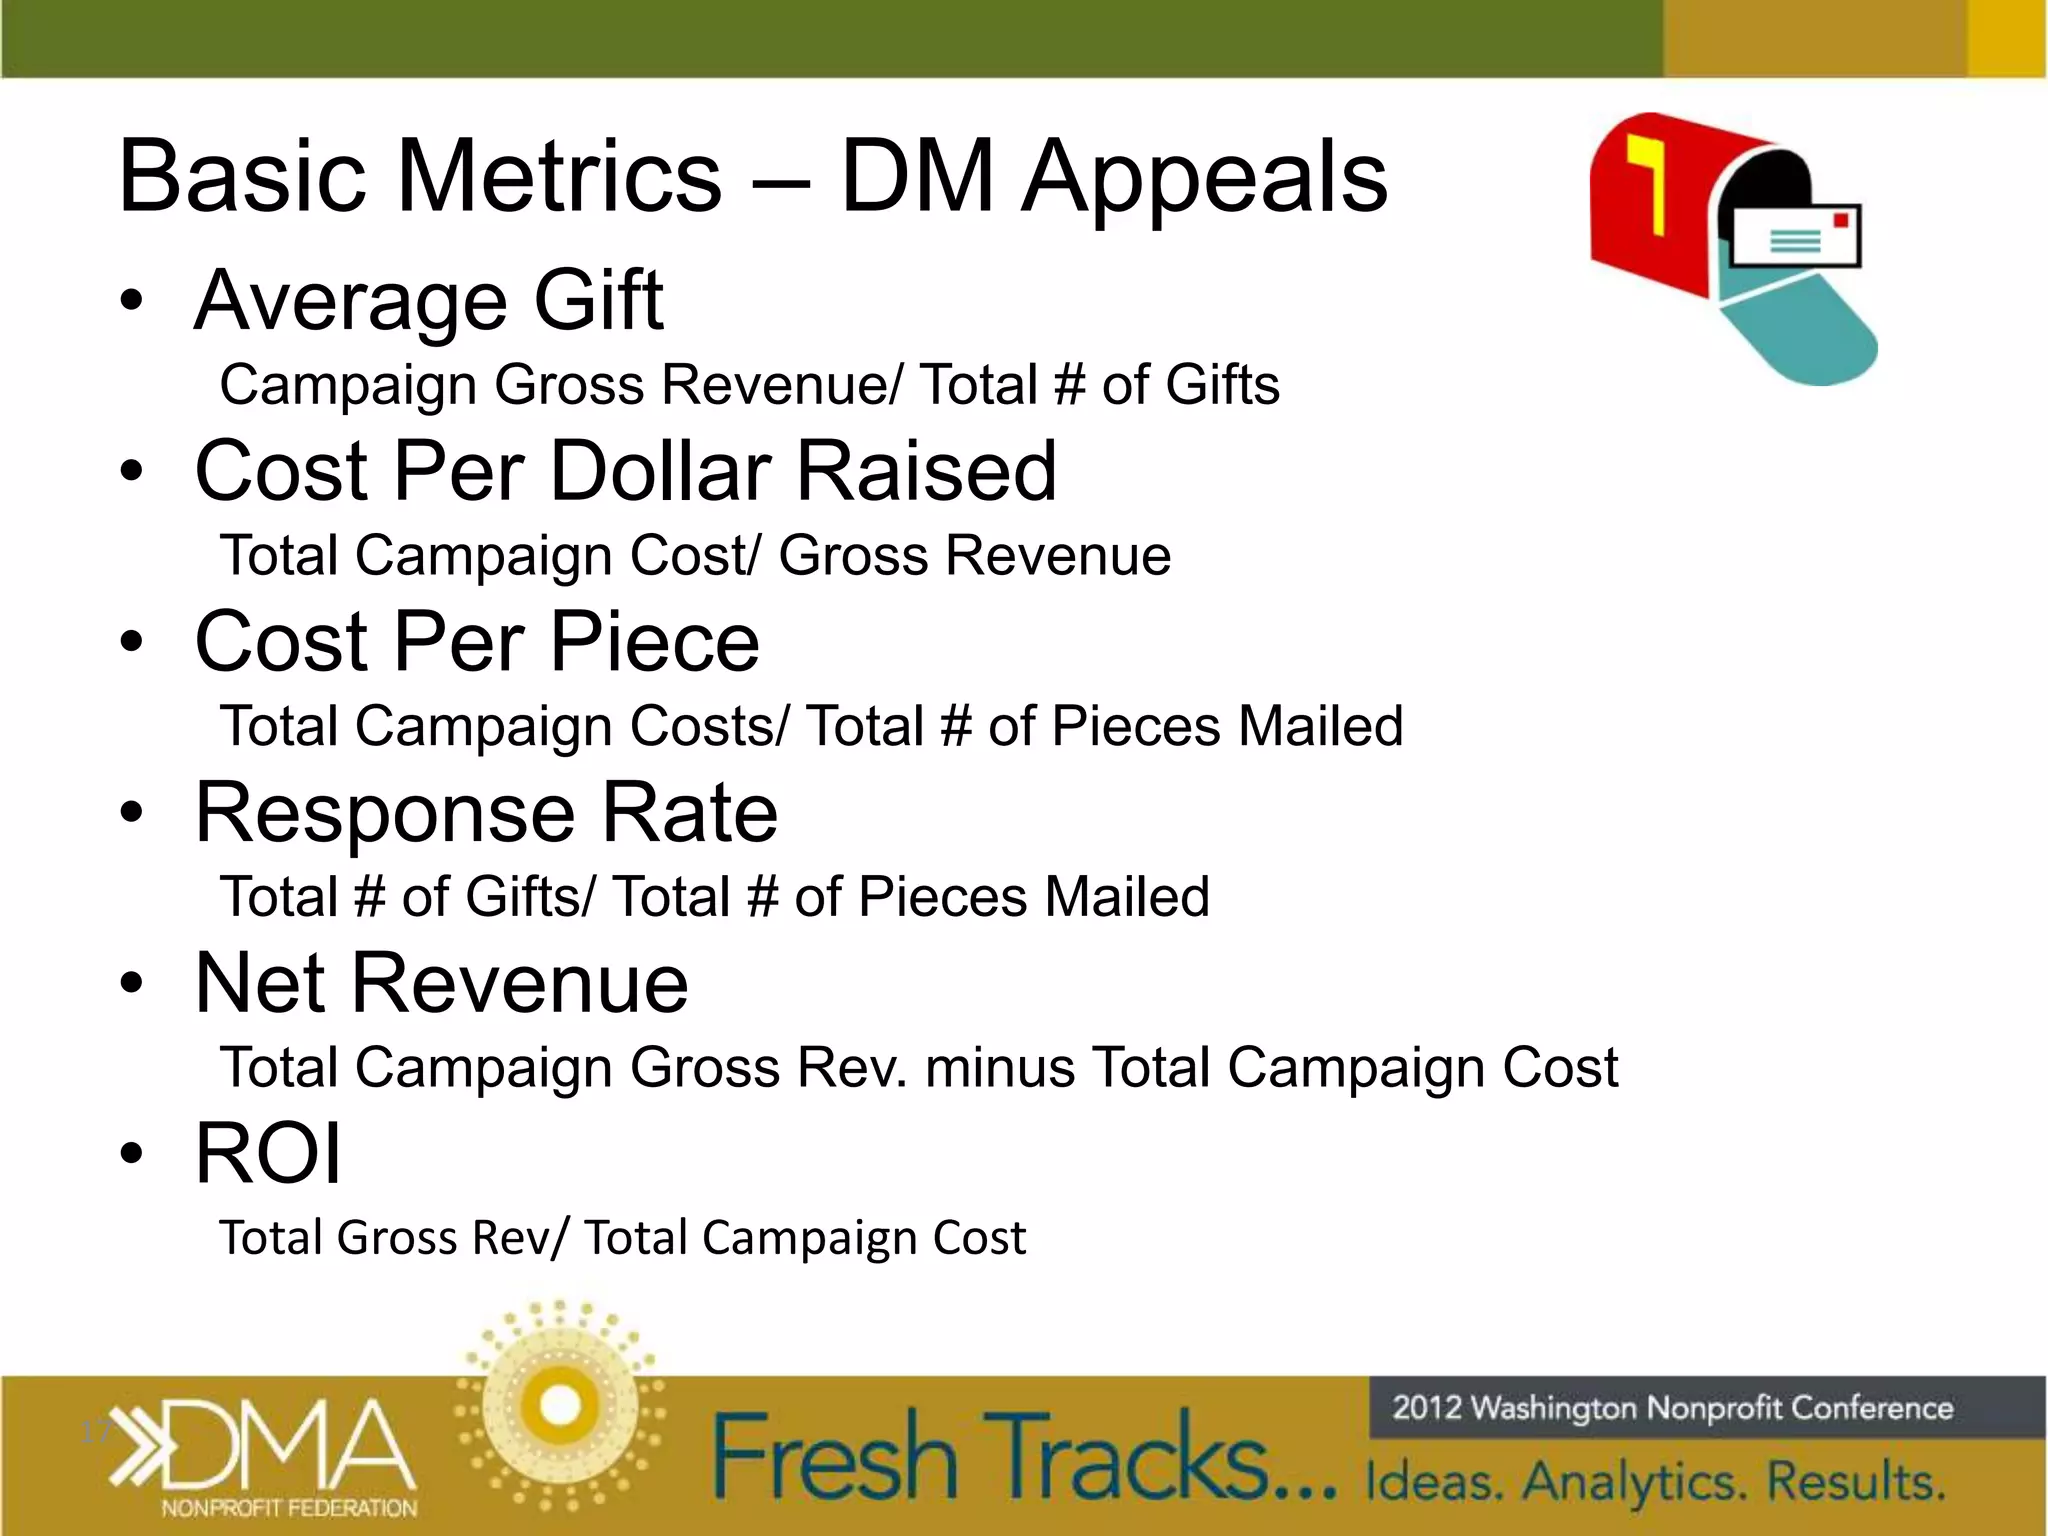
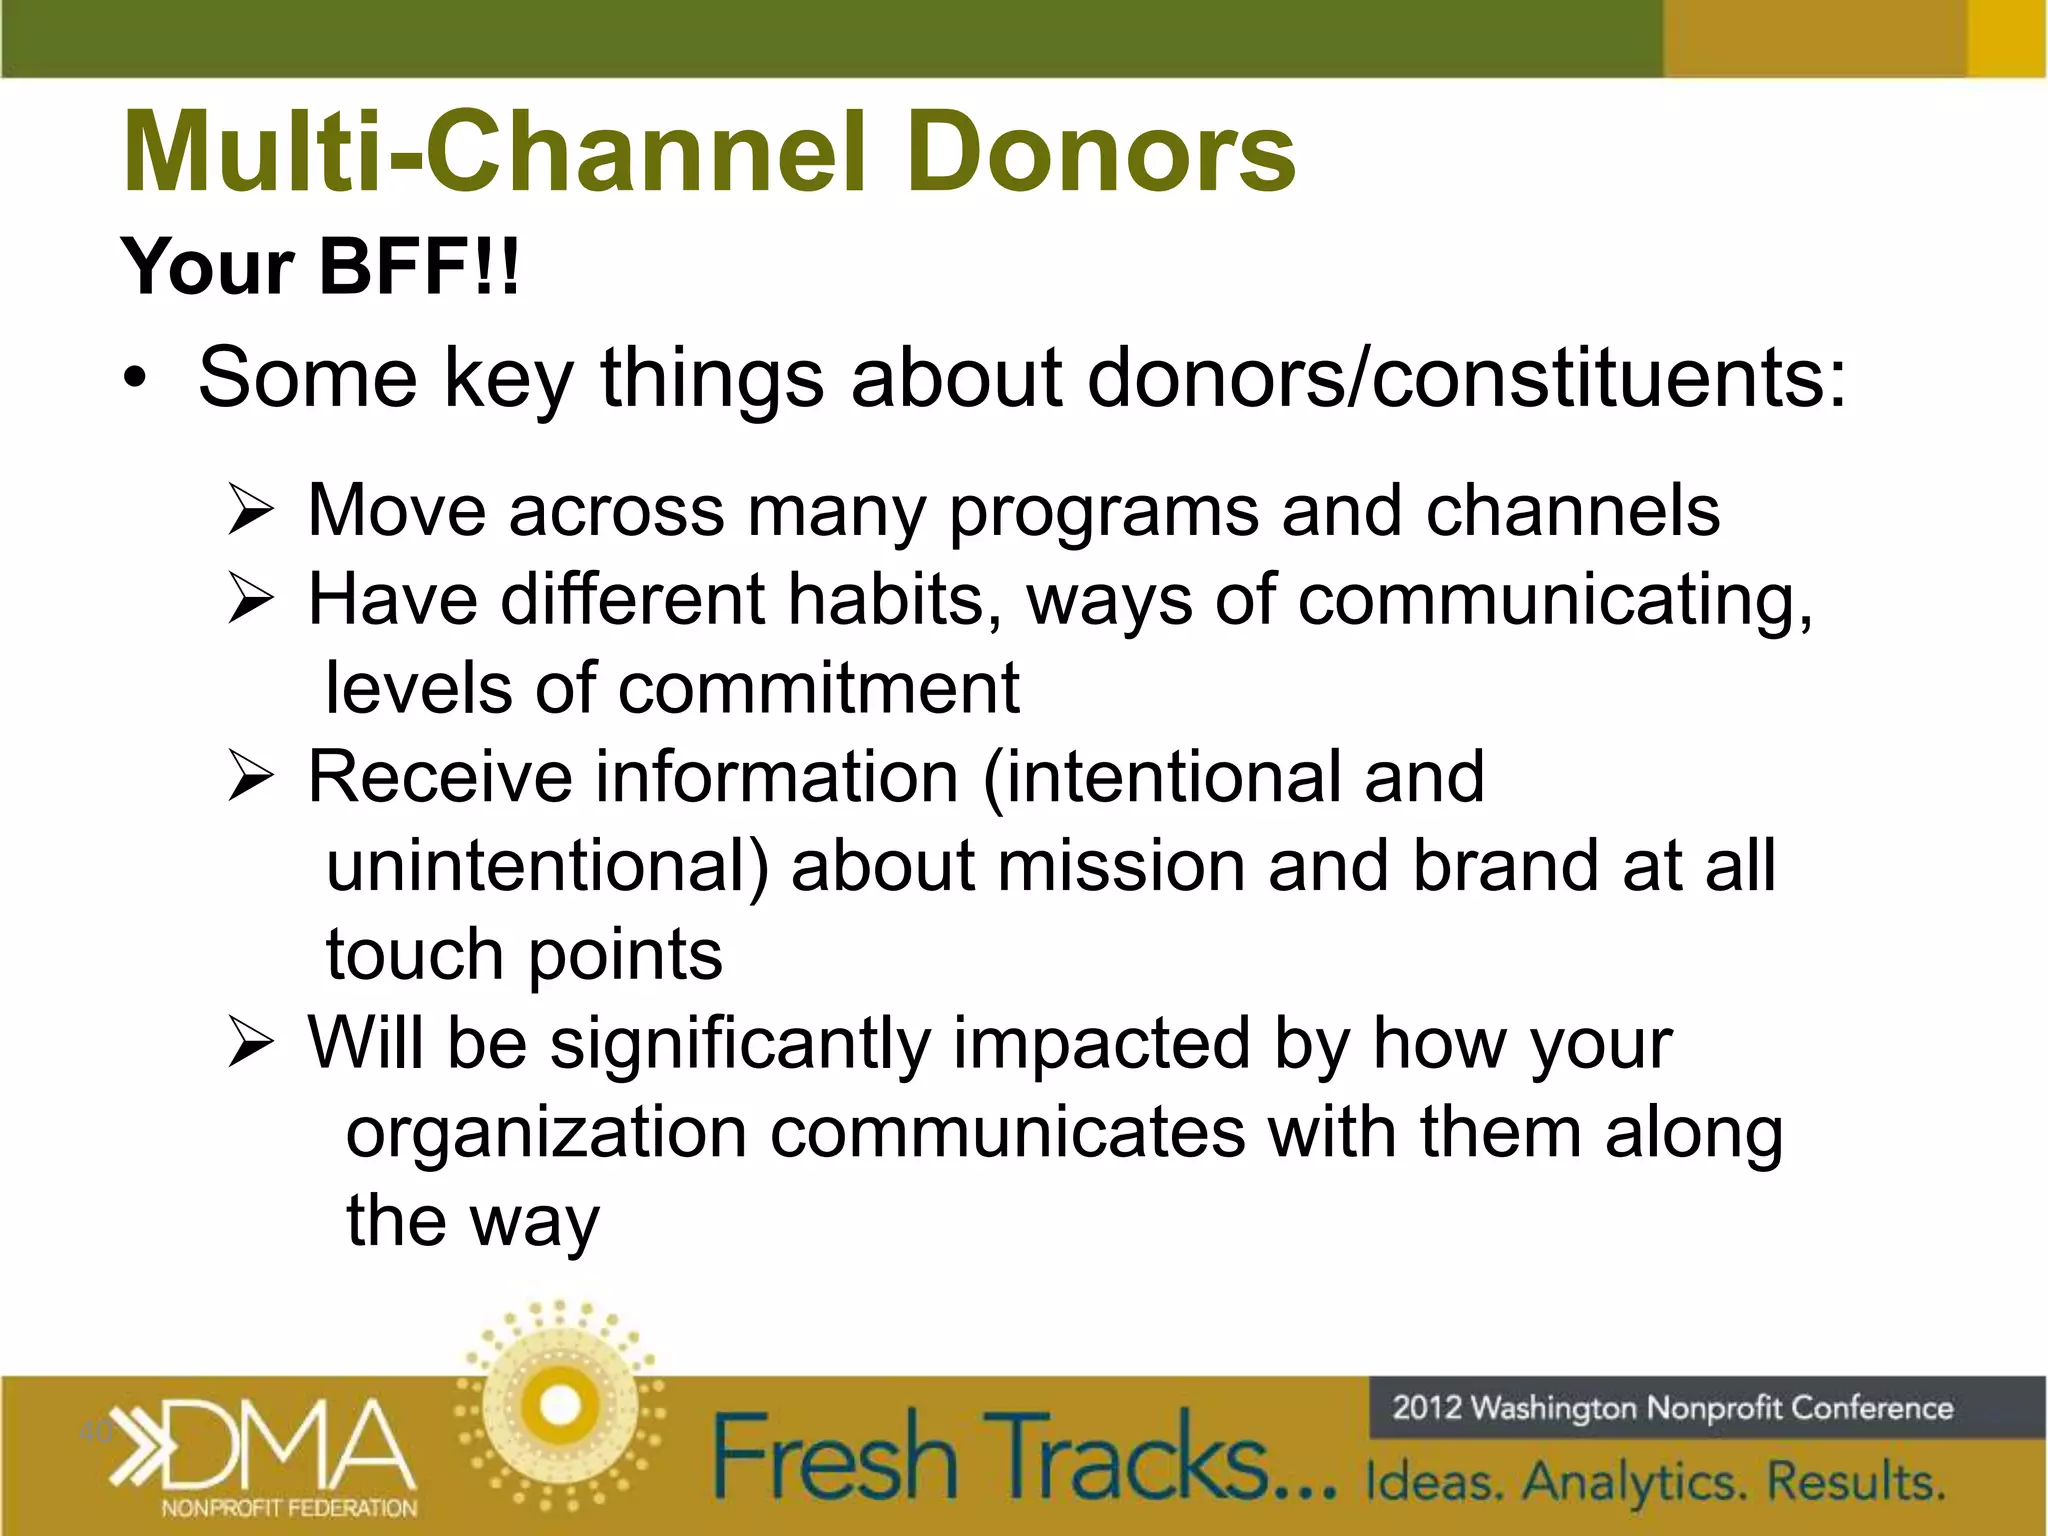
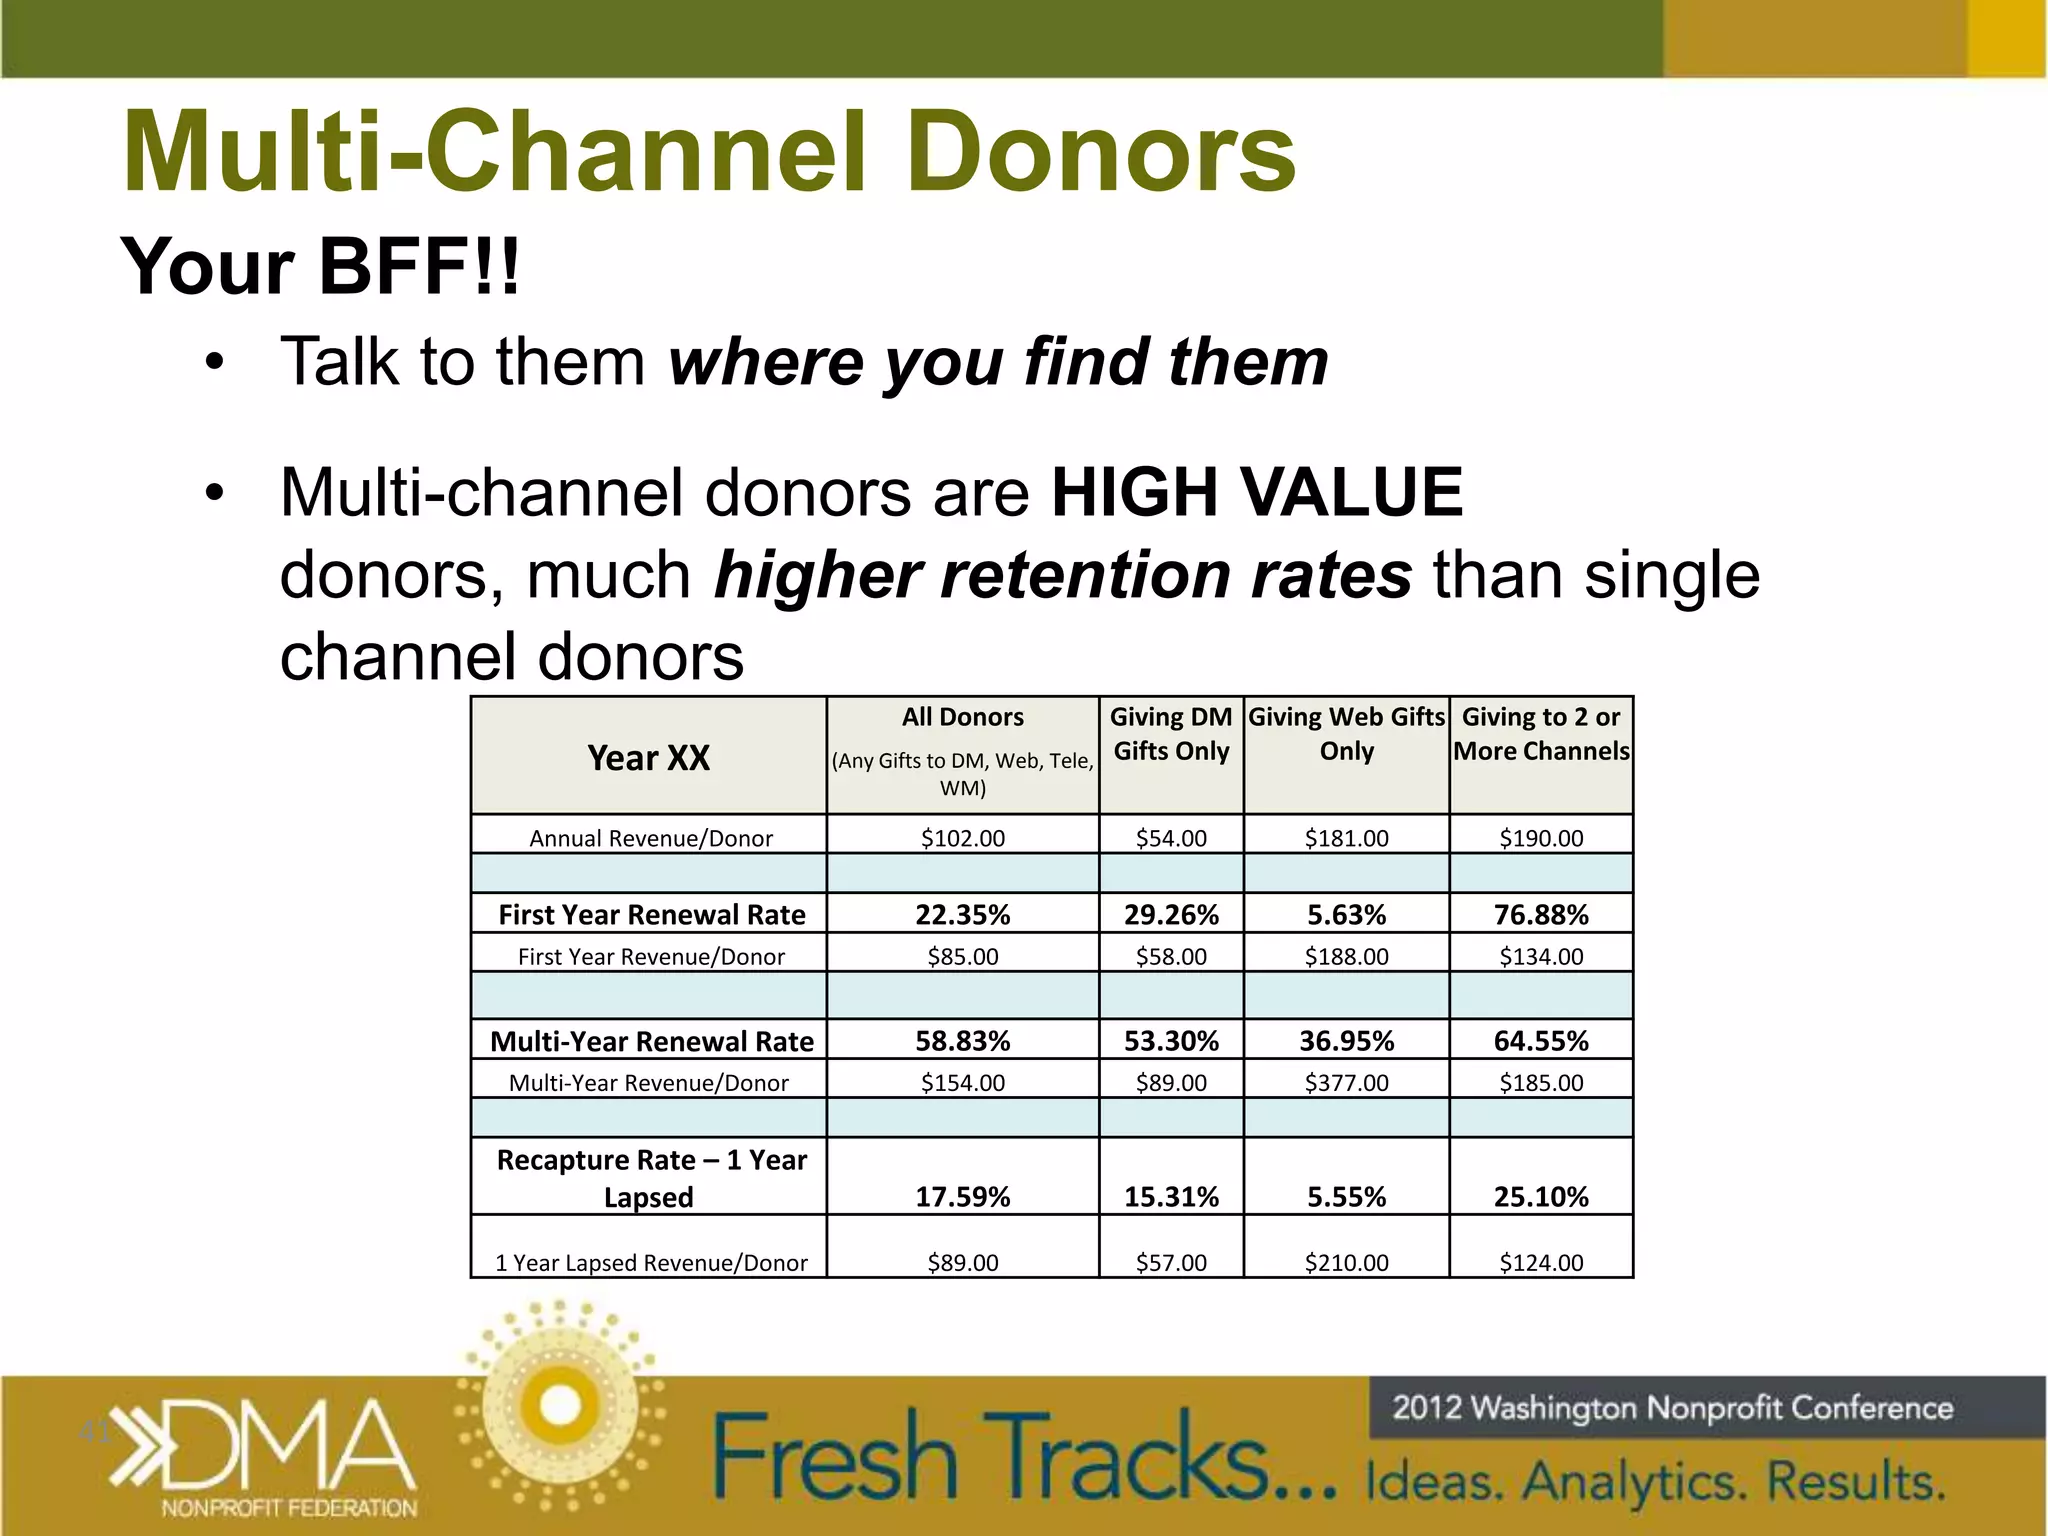

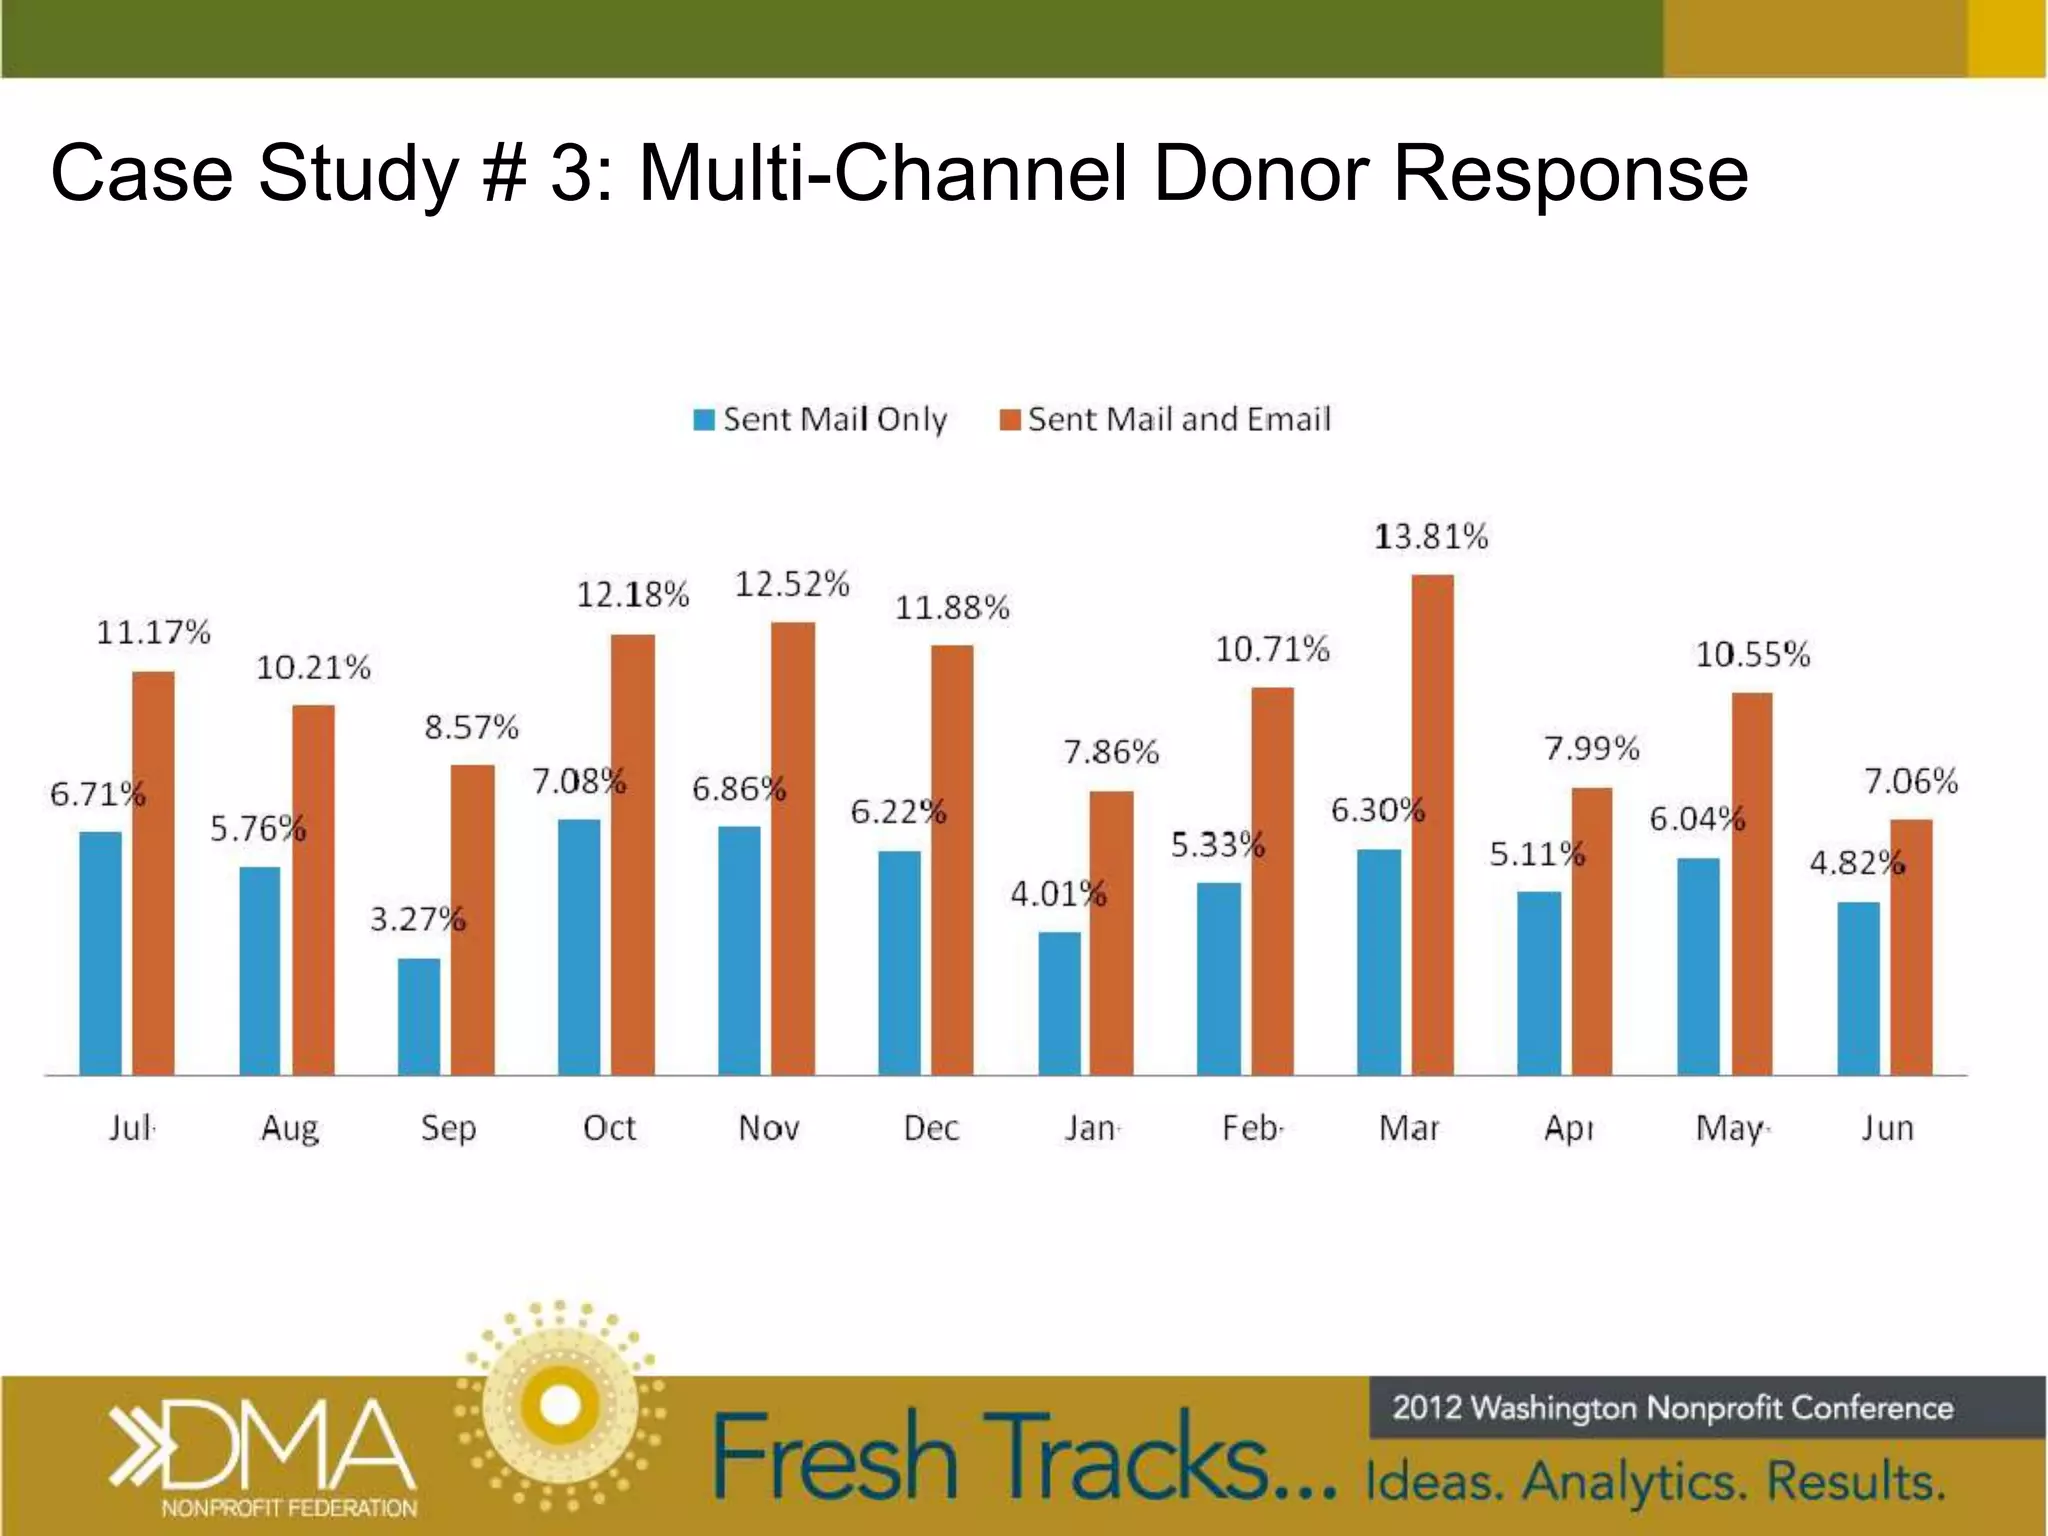


The document covers a session on key metrics for direct mail, online, and multi-channel fundraising strategies aimed primarily at newcomers to the industry. It discusses essential aspects such as donor acquisition, retention rates, multi-channel donor behavior, and various performance metrics, such as cost per new donor and average gift amounts. Additionally, the session includes insights on effectively measuring the success of fundraising campaigns through various channels and the importance of analyzing relevant data to optimize strategies.


![Coded Agents – with UiPath SDK + LangGraph [Virtual Hands-on Workshop]](https://cdn.slidesharecdn.com/ss_thumbnails/codedagentsdeck-251215155422-5497c599-thumbnail.jpg?width=640&height=640&fit=bounds)


