UNCTAD - GLOBAL FLOWS OF FOREIGN DIRECT INVESTMENT EXCEEDING PRE-CRISIS LEVELS IN 2011, DESPITE TURMOIL IN THE GLOBAL ECONOMY
•
0 likes•735 views

Global foreign direct investment (FDI) flows exceeded pre-crisis levels in 2011, rising 17% to reach $1.5 trillion according to UNCTAD estimates. While FDI increased across developed, developing, and transition economies, the reasons differed by region. Developed economies saw an 18% rise driven mainly by cross-border mergers and acquisitions rather than new investment. Developing/transition economies accounted for half of FDI, with a record $755 billion to Latin America and transition economies fueling their growth. Overall, recovery was mixed as greenfield investments declined while mergers and acquisitions rose sharply, though both slowed in the final quarter indicating continued risks in 2012.

Recommended
More Related Content
What's hot
What's hot (19)
Similar to UNCTAD - GLOBAL FLOWS OF FOREIGN DIRECT INVESTMENT EXCEEDING PRE-CRISIS LEVELS IN 2011, DESPITE TURMOIL IN THE GLOBAL ECONOMY
Similar to UNCTAD - GLOBAL FLOWS OF FOREIGN DIRECT INVESTMENT EXCEEDING PRE-CRISIS LEVELS IN 2011, DESPITE TURMOIL IN THE GLOBAL ECONOMY (20)
More from Office of Trade Negotiations (OTN), CARICOM Secretariat
More from Office of Trade Negotiations (OTN), CARICOM Secretariat (20)
Recently uploaded
Recently uploaded (20)
UNCTAD - GLOBAL FLOWS OF FOREIGN DIRECT INVESTMENT EXCEEDING PRE-CRISIS LEVELS IN 2011, DESPITE TURMOIL IN THE GLOBAL ECONOMY
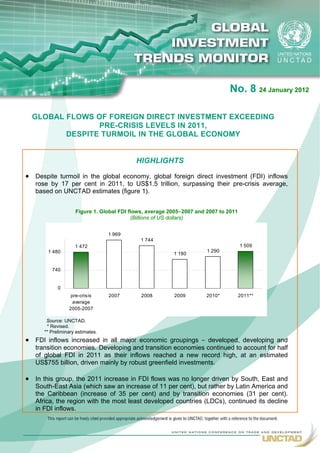
- 1. No. 8 24 January 2012 GLOBAL FLOWS OF FOREIGN DIRECT INVESTMENT EXCEEDING PRE-CRISIS LEVELS IN 2011, DESPITE TURMOIL IN THE GLOBAL ECONOMY HIGHLIGHTS Despite turmoil in the global economy, global foreign direct investment (FDI) inflows rose by 17 per cent in 2011, to US$1.5 trillion, surpassing their pre-crisis average, based on UNCTAD estimates (figure 1). Figure 1. Global FDI flows, average 2005−2007 and 2007 to 2011 (Billions of US dollars) 1 969 1 744 1 472 1 509 1 480 1 290 1 180 740 0 pre-crisis 2007 2008 2009 2010* 2011** average 2005-2007 Source: UNCTAD. * Revised. ** Preliminary estimates. FDI inflows increased in all major economic groupings − developed, developing and transition economies. Developing and transition economies continued to account for half of global FDI in 2011 as their inflows reached a new record high, at an estimated US$755 billion, driven mainly by robust greenfield investments. In this group, the 2011 increase in FDI flows was no longer driven by South, East and South-East Asia (which saw an increase of 11 per cent), but rather by Latin America and the Caribbean (increase of 35 per cent) and by transition economies (31 per cent). Africa, the region with the most least developed countries (LDCs), continued its decline in FDI inflows.
- 2. FDI flows to developed countries also rose by 18 per cent, but the growth was largely due to cross-border merger and acquisitions (M&As), not the much-needed investment in productive assets through greenfield investment projects. Moreover, part of the M&A deals appear to be driven by corporate restructurings and a focus on core activities, especially in Europe. Looking forward, UNCTAD estimates that FDI flows will rise moderately in 2012, to around US$1.6 trillion. However, the downward quarterly trend in FDI projects over the final quarter of 2011 indicates that the risks and uncertainties for further FDI growth in 2012 remain in place. Global FDI flows rose in 2011, surpassing their pre-crisis level Global FDI inflows rose in 2011 by 17 per cent compared with 2010, despite the economic and financial crisis. The rise of FDI was widespread, including all three major groups of economies − developed, developing and transition − though the reasons for this increase differed across the globe (see below). During 2011, many countries continued to implement policy changes aimed at further liberalizing and facilitating FDI entry and operations, but also introduced new measures regulating FDI (see UNCTAD's Investment Policy Monitor). UNCTAD’s global FDI quarterly index remained steady during 2011, underscoring the increased stability of flows witnessed during the year. Unlike foreign portfolio flows that have dramatically started to decline in the third quarter of 2011, FDI flows maintained their upward trends at least until this period (figure 2). However, as preliminary data from cross-border M&As and greenfield investment projects suggest, FDI flows are expected to slow down in the fourth quarter of 2011. Figure 2. UNCTAD’s global FDI quarterly index compared with global foreign portfolio investment index , first quarter 2007 to last quarter 2011 (Base 100: quarterly average of 2005) 350 300 250 200 FDI 150 Foreign portfolio investment 100 50 0 Q1 Q2 Q3 Q4 Q1 Q2 Q3 Q4 Q1 Q2 Q3 Q4 Q1 Q2 Q3 Q4 Q1 Q2 Q3 Q4 - 50 2007 2008 2009 2010 2011 - 100 Source: UNCTAD. Notes: The Global FDI Quarterly Index is based on quarterly data of FDI inflows for 67 countries. The index has been calibrated so that the average of quarterly flows in 2005 is equivalent to 100. The similar index for global foreign portfolio investment is also based on quarterly data of portfolio investment inflows for the same 67 countries. This index has also been calibrated so that the average of quarterly flows in 2005 is equivalent to 100. Figures for the last quarter of 2011 are UNCTAD estimates.
- 3. After three years of consecutive decline, FDI flows to developed countries grew robustly in 2011, reaching an estimate US$753 billion, 18 per cent up from 2010. While FDI flows to Europe increased by 23 per cent, flows to the United States declined by 8 per cent (annex 1). These trends stand in stark contrast with the previous year, which saw a strong recovery in the United States and a continuing decline in Europe. Large-scale swings (from contraction in 2010 to expansion in 2011 or vice versa) were also observed for a number of major FDI recipients, including Denmark, Germany, Italy, Sweden and the United Kingdom. Ireland witnessed a large increase in FDI flows due entirely to equity and debt movements in the financial sector. The rise in FDI in developed economies, mainly in European countries, was driven by cross- border M&As which in most cases appear to be driven by corporate restructuring, stabilization and rationalization of their operations, improving their capital usage and reducing the costs. Rising cross- border M&As in developed countries were partly due to the sale of non-core assets (e.g. Carrefour SA of France completed the spin-off of its Distribuidora Internacional de Alimentación in Spain for US$3.1 billion), and targeted opportunistic deals due to the lower currency values and fire sales caused by lower prices of stock exchange markets. However, these general trends were not shared equally by all developed countries. For example, FDI in Greece and Germany was down, but up in Italy and France. The differences also manifested themselves among different FDI components (figure 3). In the majority of developed countries, the share of equity investment declined to less than 40 per cent; reinvested earnings accounted for almost half of FDI flows while other capital flows (primarily intra-company loans) increased. In Europe alone, these debt flows swung from -(minus) US$25 billion in the first three quarters of 2010 to +US$36 billion in the same period in 2011, reflecting parent firms’ responses to the financial difficulties faced by their European affiliates. Figure 3. FDI inflows by components for 27 selected developed countries, average 2005–2007 and 2007–2011 (Percentage) 100 80 60 40 20 0 Average 2007 2008 2009 2010 2011 Q1-Q3 2005-2007 Equity flows Reinvested earnings Other capital flows Source: UNCTAD. Notes: Selected developed countries included here: Australia, Austria, Belgium, Bulgaria, Canada, Czech Republic, Denmark, Estonia, Finland, Germany, Hungary, Ireland, Israel, Japan, Latvia, Lithuania, Malta, the Netherlands, New Zealand, Norway, Portugal, Slovakia, Slovenia, Sweden, Switzerland, the United Kingdom and the United States. Data for 2011 cover the first three quarters only.
- 4. Developing and transition economies continued to absorb half of global FDI inflows in 2011, though with a somewhat smaller share than in the previous year. FDI flows to developing Asia (excluding West Asia) − the principal driver of the dynamic rise of developing and transition economies − decelerated as the region suffered from the protracted crisis in Europe. On the other hand, Latin America and the transition economies saw a significant rise in inflows, though not enough to increase the share of all developing countries and transition economies in global flows. FDI flows to developing Asia (excluding West Asia) rose 11 per cent in 2011, despite a slowing down in the latter part of the year. By subregion, East Asia, South-East Asia and South Asia received inflows of around US$209 billion, US$92 billion and US$43 billion, respectively. With a 16 per cent increase, South-East Asia continued to outperform East Asia in growth of FDI, while South Asia saw its inflows rise by one -third after a slide in 2010. The good performance of South-East Asia, which encompasses the Association of Southeast Asian Nations (ASEAN) as a whole, was driven by sharp increases of FDI inflows in a number of countries, including Indonesia, Malaysia and Thailand. FDI to China rose by 8 per cent to an estimated US$124 billion (US$116 billion in the non-financial sector) as a result of increasing flows to non-financial services, though FDI growth in the country slowed down in the last two months of 2011. FDI to Latin America and the Caribbean rose an estimated 35 per cent in 2011, to US$216 billion, despite a 31 per cent drop of the region's cross-border M&A sales. Most of the FDI growth occurred in Brazil, Colombia and offshore financial centres. Foreign investors continue to find appeal in South America's endowment of natural resources, and they are increasingly attracted by the region's expanding consumer markets. Particularly attractive are Brazil's market size and its strategic position that brings other emerging markets such as Argentina, Chile, Colombia and Peru within easy reach. In addition, uncertainty in the global financial market served to boost flows to the region's offshore financial centres. The fall in FDI flows to Africa in 2009 and 2010 continued into 2011, though at a much slower rate. The recovery in flows to South Africa did not offset the significant fall in FDI flows to North Africa: Egypt, Libya and Tunisia all witnessed sharp declines in FDI flows during the year. Central and East Africa experienced overall decreases in inward investment flows. West and Southern Africa, meanwhile, saw robust growth during the year. West Asia witnessed a 13 per cent decline in FDI flows to an estimated US$50 billion in 2011. Turkey stood out as an exception, with inward FDI registering a strong 45 per cent increase to US$13 billion, mainly due to a sharp rise in cross-border M&As sales. This consolidated the country's position as the region's second largest FDI recipient behind Saudi Arabia, where FDI dropped by 44 per cent, to an estimated US$16 billion in 2011. Transition economies of South-East Europe and the Commonwealth of Independent States (CIS) experienced a strong recovery of 31 per cent in their FDI inflows in 2011. This was mainly due to a number of large cross-border deals in the Russian Federation targeting the energy industry. Investors were also motivated by the continued growth of local consumer markets and by a new round of privatizations. Diverging trends in FDI modes accentuated in 2011 Cross-border M&As rose sharply in 2011 – especially mid-year – as deals announced in late 2010 came to fruition (figure 4). Rising M&A activity, especially in the form of megadeals, in developed countries and transition economies served as the major driver for this increase. The extractive industry was targeted by a number of important deals in both regions, while a sharp rise in pharmaceutical M&As took place in developed countries. M&As in developing economies fell slightly in value. New deal activity began to falter in the middle part of the year as the number of announcements tumbled dramatically. Completed deals, which follow announcements roughly by half a year, also started to slow down by year’s end.
- 5. Figure 4. Value of cross-border M&A sales and greenfield investment projects, First quarter 2007 to last quarter 2011 (Billions of dollars) 500 450 400 350 300 $ billion 250 200 150 100 50 0 Q1 Q2 Q3 Q4 Q1 Q2 Q3 Q4 Q1 Q2 Q3 Q4 Q1 Q2 Q3 Q4 Q1 Q2 Q3 Q4 2007 2008 2009 2010 2011 M&A value Greenfield value Source: UNCTAD. Note: Data for the last quarter of 2011 are preliminary. Greenfield investment projects, in contrast, declined in value terms for the third straight year, despite a strong performance in the first quarter (figure 4). As these projects are registered on an announcement basis, their performance largely coincides with investor sentiment during a given period. Thus, their tumble in value terms beginning in the second quarter of the year was strongly linked with rising concerns about the direction of the global economy and events in Europe. For the year as a whole, the value of greenfield investment projects dropped 3 per cent, compared with the previous year, with nearly three quarters of this decline occurring in developed countries. Greenfield investment projects in developing and transition economies rose slightly in 2011, accounting for about two thirds of the total value of greenfield investment projects (annex 1). FDI prospects for 2012: cautiously optimistic Based on the current prospects of underlying factors, such as GDP growth and cash holdings by transnational corporations (TNCs), UNCTAD estimates that FDI flows will rise moderately in 2012, to around US$1.6 trillion. However, the fragility of the world economy, with growth tempered by the debt crisis, the uncertainties surrounding the future of the euro and rising financial market turbulence, will have an impact on FDI flows in 2012. Both cross-border M&As and greenfield investments slipped in the last quarter of 2011. M&A announcements continue to be weak, suggesting that equity investment − part of FDI flows − will slow down in 2012, especially in developed countries. All these factors indicate that the risks and uncertainties for further FDI growth in 2012 remain in place.
- 6. Annex 1. FDI inflows, cross-border M&As, and greenfield investment by region and major economy, 2010–2011 (Billions of US dollars) c FDI inflows Net cross-border M&As Greenfield investments a b Host region / economy 2010 2011 Growth rate 2010 2011 Growth rate 2010 2011 Growth rate (%) (%) (%) World 1 289.7 1 508.6 17.0 338.8 507.3 49.7 807.0 780.4 - 3.3 Developed economies 635.6 753.2 18.5 251.7 396.3 57.4 263.5 229.9 - 12.7 Europe 346.8 425.7 22.8 123.4 191.2 55.0 148.9 145.2 - 2.5 European Union 314.1 414.4 31.9 113.5 162.8 43.3 143.1 142.2 - 0.7 Austria 3.8 17.9 366.3 0.4 6.9 1 505.6 1.9 3.7 94.6 Belgium 72.0 41.1 -42.9 9.4 3.9 - 58.3 4.6 2.8 - 39.3 Czech Republic 6.8 5.0 -25.9 - 0.5 0.7 - 258.4 5.5 4.2 - 23.7 Denmark - 1.8 17.8 .. 1.4 7.7 431.4 0.3 0.5 53.1 Finland 6.9 0.5 -92.2 0.3 1.0 200.6 1.5 1.6 7.0 France 33.9 40.0 18.1 3.8 23.6 524.6 8.5 7.3 - 13.8 Germany 46.1 32.3 -30.0 10.9 12.8 17.2 13.7 13.6 - 1.2 Greece 0.4 - 0.8 .. - 1.2 1.2 - 201.7 1.0 2.0 95.8 Ireland 26.3 53.0 101.3 2.1 2.2 2.5 4.4 5.9 32.6 Italy 9.2 33.1 261.0 6.8 13.4 98.8 10.1 4.8 - 52.2 Luxembourg 20.3 27.2 33.8 2.1 9.4 350.9 0.4 0.2 - 43.4 Netherlands - 13.5 - 5.3 .. 4.0 9.4 134.9 9.8 4.3 - 55.8 Poland 9.7 14.2 46.7 1.0 10.1 868.3 10.0 9.1 - 8.9 Portugal 1.5 4.4 203.3 2.2 0.9 - 58.8 2.6 1.0 - 61.7 Spain 24.5 25.0 1.9 8.7 17.3 99.1 14.8 9.1 - 38.6 Sweden - 1.2 22.0 .. 1.4 4.4 203.2 1.8 2.3 27.1 United Kingdom 51.8 77.1 49.0 58.3 34.9 - 40.1 23.6 31.1 32.2 United States 228.2 210.7 -7.7 80.3 129.7 61.6 57.1 51.3 - 10.2 Japan - 1.3 - 1.3 .. 6.7 5.1 - 23.9 4.5 4.2 - 8.0 Developing economies 583.9 663.7 13.7 82.8 78.8 - 4.8 491.6 498.1 1.3 Africa 54.7 54.4 -0.7 7.6 6.3 - 17.1 84.1 76.6 - 8.9 Egypt 6.4 0.5 -92.2 0.2 0.6 198.9 13.8 6.1 - 55.7 Nigeria 6.1 6.8 12.0 0.3 0.5 82.2 12.5 4.0 - 67.7 South Africa 1.2 4.5 269.2 3.9 4.4 10.6 5.9 9.1 55.0 Latin America and the Caribbean 160.8 216.4 34.6 29.5 20.3 - 31.3 118.2 126.9 7.3 Argentina 7.0 6.3 -10.0 3.5 - 0.2 - 107.1 7.1 11.6 62.8 Brazil 48.4 65.5 35.3 8.9 15.1 70.5 43.2 59.7 38.2 Chile 15.1 17.6 16.4 1.6 0.6 - 65.0 8.1 11.6 43.5 Colombia 6.8 14.4 113.4 - 1.6 - 0.9 - 44.5 8.8 7.7 - 12.9 Mexico 19.6 17.9 -8.8 8.0 1.2 - 84.6 14.5 15.8 9.1 Peru 7.3 7.9 7.4 0.7 0.5 - 28.8 11.6 3.8 - 67.0 Asia and Oceania 368.4 392.9 6.7 45.7 52.3 14.3 289.3 294.7 1.8 West Asia 58.2 50.4 -13.4 4.6 9.5 105.8 52.0 60.2 15.7 Turkey 9.1 13.2 45.1 2.1 7.2 251.9 9.1 6.6 - 27.9 South, East and South-East Asia 308.7 343.7 11.4 32.1 42.7 33.2 236.2 231.4 - 2.1 China 114.7 124.0 8.1 6.0 9.0 50.8 84.6 81.9 - 3.2 Hong Kong, China 68.9 78.4 13.8 12.0 1.0 - 91.5 5.0 3.9 - 21.4 India 24.6 34.0 37.9 5.5 12.5 125.2 45.4 51.5 13.6 Indonesia 13.3 19.7 48.2 1.7 6.5 287.8 11.7 22.2 90.7 Malaysia 9.1 11.6 27.6 3.4 4.5 31.3 12.8 10.7 - 15.7 Singapore 38.6 41.0 6.1 4.6 4.5 - 2.1 13.6 16.6 22.3 Thailand 5.8 7.7 33.1 0.5 0.6 24.7 7.7 3.1 - 59.7 South-East Europe and CIS 70.2 91.7 30.6 4.3 32.2 644.5 51.8 52.3 0.9 Russian Federation 41.2 50.8 23.4 2.9 29.0 895.9 33.4 19.5 - 41.4 Source : UNCTAD. a Revised. b Preliminary estimates by UNCTAD. c Net cross-border M&As are sales of companies in the host economy to foreign TNCs excluding sales of foreign affiliates in the host economy. Note: World FDI inflows are projected on the basis of 153 economies for which data are available for part of 2011 or full year estimate, as of 19 January 2012. Data are estimated by annualizing their available data, in most cases the first three quarters of 2011. The proportion of inflows to these economies in total inflows to their respective region or subregion in 2010 is used to extrapolate the 2011 regional data.
- 7. Annex 2. Cross-border M&A deals with a value of over US$3 billion in 2011 Value (US$ Industry of the acquired Ultimate acquiring Acquired company Host economy Ultimate acquiring company million) company nation First quarter 25 056 GDF Suez Energy Natural gas transmission Belgium GDF Suez SA France 7 057 AXA Asia Pacific Holdings Ltd Life insurance Australia AMP Ltd Australia 6 041 AXA Asia Pacific Holdings Ltd Life insurance Australia AMP Ltd Australia 5 629 Bank Zachodni WBK SA Banks Poland Banco Santander SA Spain 4 948 Vale SA Iron ores Brazil Norsk Hydro ASA Norway 4 800 AIG Star Life Insurance Co Ltd Life insurance Japan Prudential Financial Inc United States Crude petroleum and natural Chesapeake Energy Corp. United States BHP Billiton Ltd Australia 4 750 gas Automobiles and other motor Porsche Automobil Holding Porsche Holding GmbH Austria Germany 4 546 vehicles SE 3 895 Baldor Electric Co Motors and generators United States ABB Ltd Switzerland 3 832 Turkiye Garanti Bankasi AS Banks Turkey BBVA Spain Universal Studios Holding III Television broadcasting United States GE United States 3 800 Corp stations OAO "Vimm-Bill'-Dann Produkty Fluid milk Russian Federation PepsiCo Inc United States 3 800 Pitaniya" Services allied to motion EMI Group PLC United Kingdom CitiGroup Inc United States 3 549 picture production Second quarter Telephone communications, Weather Investments Srl Italy VimpelCom Ltd Netherlands except radiotelephone 22 382 Biological products, except Genzyme Corp United States Sanofi-Aventis SA France 21 230 diagnostic substances Land subdividers and Centro Properties Group United States Blackstone Group LP United States developers, except cemeteries 9 400 Offices of bank holding Morgan Stanley United States Mitsubishi UFJ Finl Grp Inc Japan 7 800 companies 7 359 Equinox Minerals Ltd Copper ores Australia Barrick Gold Corp Canada 7 306 Pride International Inc Drilling oil and gas wells United States Ensco PLC United Kingdom 7 206 Danisco A/S Food preparations Denmark DuPont United States 6 505 Central Networks PLC Electric services United Kingdom PPL Corp United States 6 300 Chrysler Financial Corp Personal credit institutions United States Toronto-Dominion Bank Canada Radiotelephone Vivo Participacoes SA Brazil Telefonica SA Spain 5 524 communications Shell International Petroleum Co Industrial organic chemicals Brazil Cosan Ltd Brazil 4 925 Ltd Consolidated Thompson Iron Iron ores Canada Cliffs Natural Resources Inc United States 4 356 Mines Ltd Crude petroleum and natural OAO "Novatek" Russian Federation Total SA France 4 000 gas Bituminous coal and lignite Riversdale Mining Ltd Australia Rio Tinto PLC United Kingdom 3 908 surface mining Perfumes, cosmetics, and Alberto-Culver Co United States Unilever PLC United Kingdom 3 842 other toilet preparations Talecris Biotherapeutics Pharmaceutical preparations United States Grifols SA Spain 3 560 Holdings Corp 3 500 Frac Tech Holdings LLC Oil and gas field services United States Investor Group Singapore 3 400 Securitas Direct AB Security systems services Sweden Investor Group United States Atria Senior Living Group Inc. Skilled nursing care facilities United States Ventas Inc United States 3 117 Peregrino Project,Campos Crude petroleum and natural Brazil Sinochem Group China 3 070 Basin gas Third quarter Nycomed International Takeda Pharmaceutical Co Pharmaceutical preparations Switzerland Japan 13 683 Management GmbH Ltd Crude petroleum and natural Petrohawk Energy Corp United States BHP Billiton Ltd Australia 11 776 gas Crude petroleum and natural Reliance Industries Ltd India BP PLC United Kingdom 9 000 gas OAO "Polyus Zoloto" Gold ores Russian Federation Polyus Zoloto Russian Federation 6 256 Cia Espanola de Petroleos SA Crude petroleum and natural United Arab Spain IPIC 4 964 {CEPSA} gas Emirates Tognum AG Internal combustion engines Germany Rolls-Royce Group plc United Kingdom 4 723 Manmade organic fibers, Rhodia SA France Solvay SA Belgium 4 640 except cellulosic 4 095 Marshall & Ilsley Corp. National commercial banks United States Bank of Montreal Canada 3 599 Parmalat SpA Fluid milk Italy Investor Group France Surgical and medical Phadia AB Sweden Thermo Fisher Scientific Inc United States 3 540 instruments and apparatus 3 200 Converteam Group SAS Motors and generators France GE United States Distribuidora Internacional de Grocery stores Spain Shareholders France 3 140 Alimentacion SA{Dia} 3 033 SPIE SA Engineering services France Investor Group United States Fourth quarter 10 793 Foster's Group Ltd Malt beverages Australia SABMiller PLC United Kingdom 8 500 Skype Global Sarl Prepackaged Software Luxembourg Microsoft Corp United States Radiotelephone Polkomtel SA Poland Metelem Holding Ltd Cyprus 6 611 communications Teva Pharmaceutical Cephalon Inc Pharmaceutical preparations United States Israel 6 311 Industries OAO "Polimetall" Gold ores Russian Federation Polymetal International Plc Jersey 5 499 5 390 Anglo American Sur SA Copper ores Chile Mitsubishi Corp Japan Surgical and medical Kinetic Concepts Inc United States Chiron Holdings Inc United Kingdom 5 139 instruments and apparatus 4 949 Macarthur Coal Ltd Coal mining services Australia Peabody Energy Corp United States Crude petroleum and natural Cairn India Ltd India Volcan Investments Ltd United Kingdom 4 542 gas Cable and other pay television Musketeer GmbH Germany Liberty Global Inc United States 4 495 services OAO "Pervaya Gruzovaya Railroads, line-haul operating Russian Federation UCL Holding BV Netherlands 4 223 Kompaniya" Northumbrian Water Group PLC Water supply United Kingdom Hutchison Whampoa Ltd Hong Kong, China 3 837 Insurance agents, brokers, ING Groep NV Mexico Grupo Sura Colombia 3 614 and service 3 259 GDF Suez SA Electric services France China Investment Corp China Telephone communications, Global Crossing Ltd Bermuda Level 3 Communications Inc United States except radiotelephone 3 017 Source: UNCTAD.
- 8. The next issue of UNCTAD’s Global Investment Trends Monitor will be released in mid-April 2012. The next issue of UNCTAD's Investment Policy Monitor will be released in the first week of February 2012.