Download to read offline
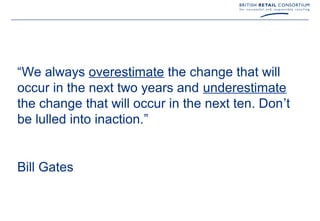
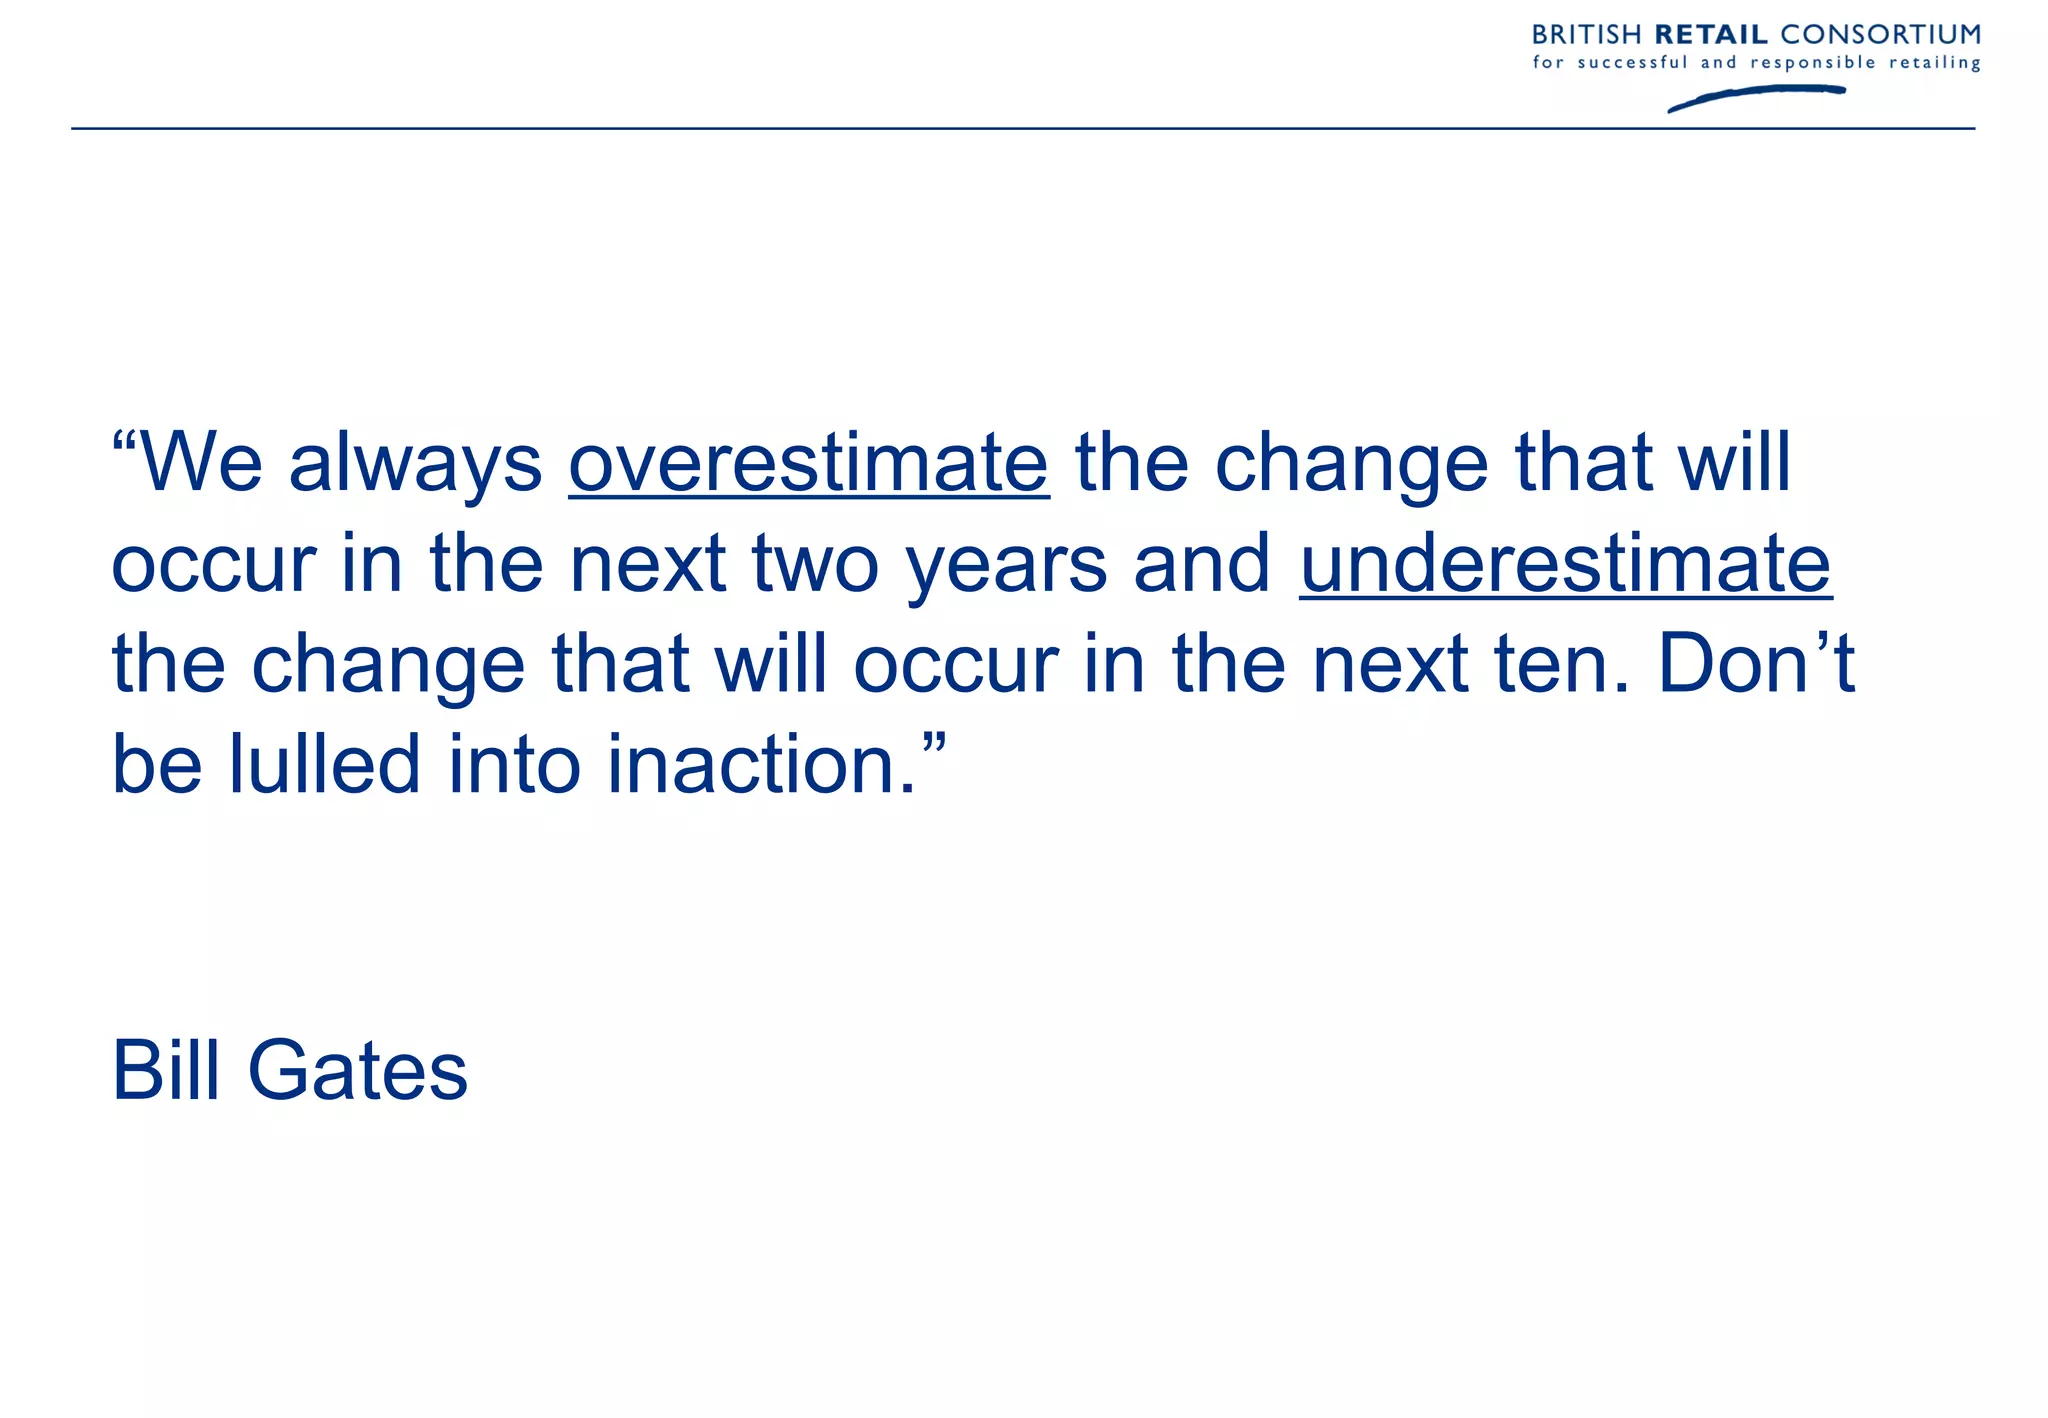
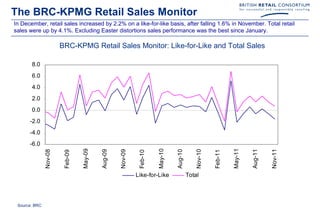
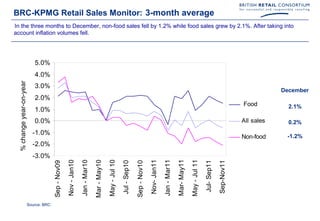
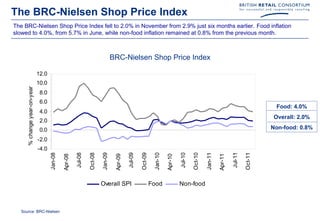
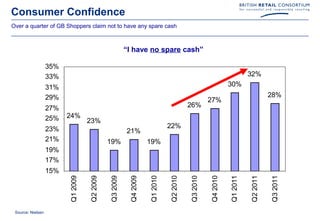

The document discusses how we tend to overestimate change in the short term and underestimate it in the long term, advising against inaction. It then provides brief summaries of retail sales trends in the UK, including a rise in like-for-like sales in December after a November drop, growth in food but decline in non-food sales over three months, and strong non-store non-food sales growth but slowing inflation.


