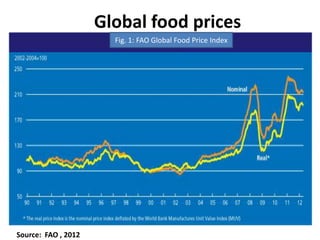
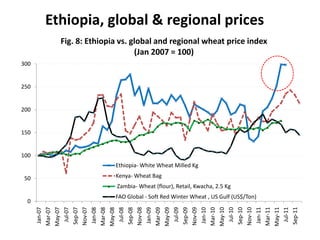
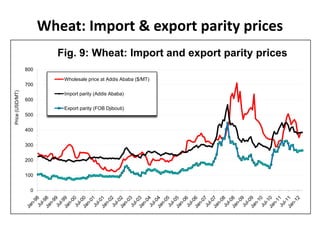
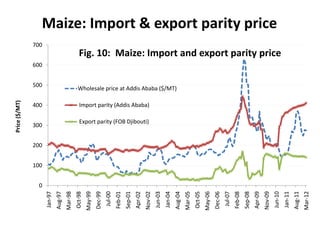
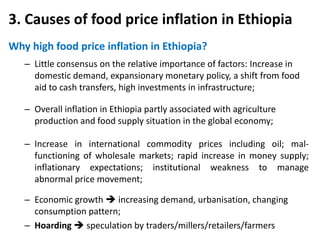
Cereals price dynamics in Ethiopia
             Tadesse Kuma
             EDRI

             Improved evidence towards better food and
             agricultural policies in Ethiopia
             November 02, 2012
             Hilton Hotel, Addis Ababa


                                                         1
Outline
• Introduction and Purpose of Study
• Food Price Trends in Ethiopia
• Causes of Food Price Inflation in
  Ethiopia
• Government Response
• Concluding Remarks
1. Introduction (1)
• Food is a fundamental necessity to human
  survival, economic and social stability;
• Any shock in the food production and prices directly or
  indirectly affects millions in developing countries;

• Global food price trends
   – Food prices on the international market remained relatively
     stable until early 2000s;
   – However, it began to soar and by mid-2008 it had reached its
     highest level in 30 years (FAO, 2011).

• Ethiopia experienced abnormally high food price hike
  in the recent years;
Global food prices
                       Fig. 1: FAO Global Food Price Index


Source: FAO , 2012
Introduction (3)
Purpose of the study
• Understand current price trends of major cereals in
  Ethiopia
• Explore major causes of food price hike in Ethiopia
• Discuss future challenges and possible policy options

Method of analysis:
• Analysis of monthly average price trends for major
  cereals
2. Food price trends in Ethiopia                  (1)


• Although there has been promising achievement in the
  agricultural sector performance, food price remained
  so high;

• Understanding cereal price movement has important
  implication for national food security in Ethiopia;
   – Contribution for overall GDP (30%), food expenditure (40%),
     calories intake (60%), agricultural GDP (62%), .... (CSA, 2010)

• Cereal price intervention has remained a predominant
  consideration in food policy making in Ethiopia (e.g.,
  Commodity Marketing Board (CMB), AMC, EGTE);
Fig. 2: Food and non-food price index (Dec. 2007=100)
        350.0
                                                                                                                                                                                  Cereal price
                                                                                                                                                                                  index

        300.0

                                                                General price index
        250.0
                                                                Food price index
        200.0
Index


                                                                Cereals price index

        150.0                                                   Non-food price index

        100.0


         50.0


          0.0

                                                                                                                                                                Nov-06
                                                    Nov-99
                                           Apr-99


                                                                               Aug-01


                                                                                                                                                       Apr-06


                                                                                                                                                                                            Aug-08
                                                                                                          May-03


                                                                                                                                                                                                                       May-10
                                                                      Jan-01


                                                                                        Mar-02


                                                                                                                                                                                   Jan-08


                                                                                                                                                                                                     Mar-09
                                  Sep-98


                                                                                                                                              Sep-05
                Jul-97
                         Feb-98


                                                                                                                   Dec-03
                                                                                                                            Jul-04
                                                                                                                                     Feb-05


                                                                                                                                                                                                                                Dec-10
                                                                                                                                                                                                                                         Jul-11
                                                                                                                                                                                                                                                  Feb-12
                                                             Jun-00


                                                                                                 Oct-02


                                                                                                                                                                         Jun-07


                                                                                                                                                                                                              Oct-09
                                                                                   Source: CSA, 2012
Price trends of major cereals
                             Fig. 3: Nominal wholesale cereals price trends for Addis Ababa
                                                        market
                      1600

                      1400                                            Teff
                      1200                                         Wheat
Price (Birr/100kgs)


                      1000                                       Maize

                      800                                          Sorghum

                      600

                      400

                      200

                        0
                                      May-05


                                                                 May-06


                                                                                            May-07


                                                                                                                       May-08


                                                                                                                                                  May-09


                                                                                                                                                                             May-10


                                                                                                                                                                                                        May-11


                                                                                                                                                                                                                                   May-12
                                               Sep-05


                                                                          Sep-06


                                                                                                     Sep-07


                                                                                                                                Sep-08


                                                                                                                                                           Sep-09


                                                                                                                                                                                      Sep-10


                                                                                                                                                                                                                 Sep-11


                                                                                                                                                                                                                                            Sep-12
                                                                                   Jan-07
                             Jan-05


                                                        Jan-06


                                                                                                              Jan-08


                                                                                                                                         Jan-09


                                                                                                                                                                    Jan-10


                                                                                                                                                                                               Jan-11


                                                                                                                                                                                                                          Jan-12
                                                                                       Source: EGTE, 2012
Price difference between regional markets
                                Fig. 4: Wholesale price difference between major regional teff
                                                            markets
               1800

               1600
                                                          Addis Ababa
               1400
Birr /100kgs


                                                          Bahir Dar
               1200                                       Shashemene
               1000                                       Jimma
               800                                        Mekele

               600

               400

               200

                  0
                      Jul-05


                                                 Jul-06


                                                                            Jul-07


                                                                                                       Jul-08


                                                                                                                                  Jul-09


                                                                                                                                                             Jul-10


                                                                                                                                                                                        Jul-11


                                                                                                                                                                                                                   Jul-12
                                                                                                                Nov-08
                               Nov-05


                                                          Nov-06


                                                                                     Nov-07


                                                                                                                                           Nov-09


                                                                                                                                                                      Nov-10


                                                                                                                                                                                                 Nov-11
                                        Mar-06


                                                                   Mar-07


                                                                                              Mar-08


                                                                                                                         Mar-09


                                                                                                                                                    Mar-10


                                                                                                                                                                               Mar-11


                                                                                                                                                                                                          Mar-12
Price difference between regional markets
                      Fig. : Nominal maize price difference b/n major regional
                                              markets
              800

              700                          Addis Ababa
              600                          Dire Dawa

              500                          Shashemene
Birr/100kgs


              400                          Jimma

              300

              200

              100

                0


                                                                                                                                                                    May-11
                             May-06


                                                        May-07


                                                                                   May-08


                                                                                                              May-09


                                                                                                                                         May-10


                                                                                                                                                                                               May-12
                    Jan-06


                                               Jan-07


                                                                          Jan-08


                                                                                                     Jan-09


                                                                                                                                Jan-10


                                                                                                                                                           Jan-11


                                                                                                                                                                                      Jan-12
                                      Sep-06


                                                                 Sep-07


                                                                                            Sep-08


                                                                                                                       Sep-09


                                                                                                                                                  Sep-10


                                                                                                                                                                             Sep-11


                                                                                                                                                                                                        Sep-12
                                                                 Source: EGTE, 2012
Real and Nominal Price trends of teff and
                                         wheat
                                 Fig. 5: Price trends of teff (real and nominal)
                          1200

                          1000
                                                        Addis Ababa (NP)
   Price (Birr/100Kgs)


                          800
                                                        Addis Ababa (RP)
                          600

                          400

                          200

                            0
                                                   Nov-04


                                                                                                                                                               Nov-09
                                                                                                                                                                        Apr-10
                                                            Apr-05


                                                                                                                                    Aug-08
                                 Jan-04


                                                                                                         May-07


                                                                                                                           Mar-08


                                                                                                                                             Jan-09
                                                                     Sep-05
                                                                              Feb-06


                                                                                                                                                                                 Sep-10
                                                                                       Jul-06
                                                                                                Dec-06


                                                                                                                                                                                          Feb-11
                                                                                                                                                                                                   Jul-11
                                                                                                                                                                                                            Dec-11
                                                                                                                  Oct-07
                                          Jun-04


                                                                                                                                                      Jun-09
The divergence between nominal and real prices may accounts for
current food price inflation
Price trends of maize
                        700
                                                          Fig. 6: Price trends of Maize (real and nominal)

                        600
                                                         AA Addis Ababa (NP)
Prices (Birr/100Kgs)


                        500
                                                         AA Addis Ababa (RP)
                        400
                        300
                        200
                        100
                          0
                                                                                                                         Apr-08
                                       Apr-05
                                                Aug-05


                                                                   Apr-06
                                                                            Aug-06


                                                                                              Apr-07
                                                                                                       Aug-07


                                                                                                                                  Aug-08


                                                                                                                                                    Apr-09
                                                                                                                                                             Aug-09


                                                                                                                                                                               Apr-10
                                                                                                                                                                                        Aug-10


                                                                                                                                                                                                          Apr-11
                                                                                                                                                                                                                   Aug-11
                                                                                                                                                                                                                            Dec-11
                              Dec-04


                                                          Dec-05


                                                                                     Dec-06


                                                                                                                Dec-07


                                                                                                                                           Dec-08


                                                                                                                                                                      Dec-09


                                                                                                                                                                                                 Dec-10
                       • Maize and sorghum prices exhibited high volatility
                       • During second price surge in 2011, wheat and maize price
                         exceeded its 2008 level.
Ethiopia, global & regional prices
                       Fig. 7: Global and regional maize price index (Jan. 2007= 100)
        600
                                                                                                                                   Kenya - dry maize bag 90kg bag
                                                                                                                                   Uganda - Maize grain Kg
        500                                                                                                                        Ethiopia- Maize (white) kg
                                                                                                                                   Tanzania Wholesale Prices TZS/ 100 kg
                                                                                                                                   FAO Global - Maize (U.S. Gulf, #2 yellow, US$/Ton)
        400
                                                                                                                                   Malawi - Retail prices in Malawi kwacha per kilogram
Index


        300


        200


        100


         0
                                         Jul-07


                                                                                               Jul-08


                                                                                                                                                      Jul-09


                                                                                                                                                                                                            Jul-10


                                                                                                                                                                                                                                                                  Jul-11
                                                  Sep-07


                                                                                                        Sep-08


                                                                                                                                                               Sep-09


                                                                                                                                                                                                                     Sep-10


                                                                                                                                                                                                                                                                           Sep-11
                                                                    Jan-08


                                                                                                                                                                                                                                                Mar-11
              Jan-07
                       Mar-07


                                                           Nov-07


                                                                             Mar-08


                                                                                                                 Nov-08
                                                                                                                          Jan-09
                                                                                                                                    Mar-09


                                                                                                                                                                        Nov-09
                                                                                                                                                                                 Jan-10
                                                                                                                                                                                          Mar-10


                                                                                                                                                                                                                              Nov-10
                                                                                                                                                                                                                                       Jan-11


                                                                                                                                                                                                                                                         May-11
                                May-07


                                                                                      May-08


                                                                                                                                             May-09


                                                                                                                                                                                                   May-10
Ethiopia, global & regional prices
        Fig. 8: Ethiopia vs. global and regional wheat price index
                              (Jan 2007 = 100)
300


250


200


150


100
                       Ethiopia- White Wheat Milled Kg

 50                    Kenya- Wheat Bag
                       Zambia- Wheat (flour), Retail, Kwacha, 2.5 Kg
                       FAO Global - Soft Red Winter Wheat , US Gulf (US$/Ton)
 0
      Nov-09
      Nov-07


      Nov-08


      Nov-10
      Mar-07
      May-07


      Mar-08
      May-08


      Mar-09
      May-09


      Mar-10
      May-10


      Mar-11
      May-11
        Jul-07
      Sep-07


        Jul-08
      Sep-08


        Jul-09
      Sep-09


        Jul-10
      Sep-10


        Jul-11
      Sep-11
       Jan-08
       Jan-07


       Jan-09


       Jan-10


       Jan-11
Wheat: Import & export parity prices
                          Fig. 9: Wheat: Import and export parity prices
                 800
                           Wholesale price at Addis Ababa ($/MT)
                 700
Price (USD/MT)


                           Import parity (Addis Ababa)
                 600
                           Export parity (FOB Djibouti)
                 500


                 400


                 300


                 200


                 100


                  0
Maize: Import & export parity price
               700
                                                  Fig. 10: Maize: Import and export parity price
               600


               500
                                                 Wholesale price at Addis Ababa ($/MT)
Price ($/MT)


               400                                 Import parity (Addis Ababa)

                                                   Export parity (FOB Djibouti)
               300


               200


               100


                0
                                                                                                               Nov-02


                                                                                                                                                                                                                           Nov-09
                                                         May-99


                                                                                                                                                                     May-06
                                       Mar-98


                                                                                                                                                   Mar-05


                                                                                                                                                                                                                                                               Mar-12
                                                                                             Sep-01


                                                                                                                                                                                                         Sep-08
                                                                                    Feb-01
                                                                  Dec-99
                                                                           Jul-00


                                                                                                      Apr-02


                                                                                                                                                                              Dec-06
                                                                                                                                                                                       Jul-07
                                                                                                                                                                                                Feb-08


                                                                                                                                                                                                                  Apr-09
                              Aug-97


                                                Oct-98


                                                                                                                        Jun-03


                                                                                                                                          Aug-04


                                                                                                                                                            Oct-05


                                                                                                                                                                                                                                    Jun-10


                                                                                                                                                                                                                                                      Aug-11
                     Jan-97


                                                                                                                                 Jan-04


                                                                                                                                                                                                                                             Jan-11
3. Causes of food price inflation in Ethiopia
Why high food price inflation in Ethiopia?
   – Little consensus on the relative importance of factors: Increase in
     domestic demand, expansionary monetary policy, a shift from food
     aid to cash transfers, high investments in infrastructure;

   – Overall inflation in Ethiopia partly associated with agriculture
     production and food supply situation in the global economy;

   – Increase in international commodity prices including oil; mal-
     functioning of wholesale markets; rapid increase in money supply;
     inflationary expectations; institutional weakness to manage
     abnormal price movement;

   – Economic growth  increasing demand, urbanisation, changing
     consumption pattern;
   – Hoarding  speculation by traders/millers/retailers/farmers
Impacts on the poor
• Large negative impacts on poor net consumers of
  food, because food is a large part of household budget
  (Eg., food account for > 60% HH exp. ).

• Potentially positive impact on net producers of food, if
  farmers have access to agricultural inputs and markets.
4. Government responses
• During 2008 food price crisis, the GoE initiated a
  subsidized urban food supply programs, carried out
  open market sales, suspended local procurement by
  the World Food Programme (WFP); removal of taxes
  on food items, banning cereal export,
• In January 2011, the government imposed price caps
  on basic commodes and lifted in the June 2011 (for
  most commodities but not all);
• Outcome(s): subsidized food supply stabilized market
  prices of cereals but of price cap is not very clear.
5. Concluding remarks
Observations from trends:
• Ethiopia has registered considerable economic
  growth in the last nine years;
• In Ethiopia, food prices remained high
  compared to many countries;
• Excessive price volatility;
• Dominance of some of markets over others (e.g., Addis
  Ababa)
5. Concluding remarks
• Suggested policy choices:

  - Short term:
     • Prudent macroeconomic policy
     • Understanding market structure and behavior (wholesale
       market);
     • Protecting the most vulnerable through the expansion of
       social protection programs (PSNP, and others).

  - Medium term:
     • Rising domestic agricultural production/supply and
       productivity;
     • Stimulating private investment in agriculture;
     • Improving competitiveness of agricultural markets
Cereals price dynamics

Cereals price dynamics

  • 1.
    Cereals price dynamicsin Ethiopia Tadesse Kuma EDRI Improved evidence towards better food and agricultural policies in Ethiopia November 02, 2012 Hilton Hotel, Addis Ababa 1
  • 2.
    Outline • Introduction andPurpose of Study • Food Price Trends in Ethiopia • Causes of Food Price Inflation in Ethiopia • Government Response • Concluding Remarks
  • 3.
    1. Introduction (1) •Food is a fundamental necessity to human survival, economic and social stability; • Any shock in the food production and prices directly or indirectly affects millions in developing countries; • Global food price trends – Food prices on the international market remained relatively stable until early 2000s; – However, it began to soar and by mid-2008 it had reached its highest level in 30 years (FAO, 2011). • Ethiopia experienced abnormally high food price hike in the recent years;
  • 4.
    Global food prices Fig. 1: FAO Global Food Price Index Source: FAO , 2012
  • 5.
    Introduction (3) Purpose ofthe study • Understand current price trends of major cereals in Ethiopia • Explore major causes of food price hike in Ethiopia • Discuss future challenges and possible policy options Method of analysis: • Analysis of monthly average price trends for major cereals
  • 6.
    2. Food pricetrends in Ethiopia (1) • Although there has been promising achievement in the agricultural sector performance, food price remained so high; • Understanding cereal price movement has important implication for national food security in Ethiopia; – Contribution for overall GDP (30%), food expenditure (40%), calories intake (60%), agricultural GDP (62%), .... (CSA, 2010) • Cereal price intervention has remained a predominant consideration in food policy making in Ethiopia (e.g., Commodity Marketing Board (CMB), AMC, EGTE);
  • 7.
    Fig. 2: Foodand non-food price index (Dec. 2007=100) 350.0 Cereal price index 300.0 General price index 250.0 Food price index 200.0 Index Cereals price index 150.0 Non-food price index 100.0 50.0 0.0 Nov-06 Nov-99 Apr-99 Aug-01 Apr-06 Aug-08 May-03 May-10 Jan-01 Mar-02 Jan-08 Mar-09 Sep-98 Sep-05 Jul-97 Feb-98 Dec-03 Jul-04 Feb-05 Dec-10 Jul-11 Feb-12 Jun-00 Oct-02 Jun-07 Oct-09 Source: CSA, 2012
  • 8.
    Price trends ofmajor cereals Fig. 3: Nominal wholesale cereals price trends for Addis Ababa market 1600 1400 Teff 1200 Wheat Price (Birr/100kgs) 1000 Maize 800 Sorghum 600 400 200 0 May-05 May-06 May-07 May-08 May-09 May-10 May-11 May-12 Sep-05 Sep-06 Sep-07 Sep-08 Sep-09 Sep-10 Sep-11 Sep-12 Jan-07 Jan-05 Jan-06 Jan-08 Jan-09 Jan-10 Jan-11 Jan-12 Source: EGTE, 2012
  • 9.
    Price difference betweenregional markets Fig. 4: Wholesale price difference between major regional teff markets 1800 1600 Addis Ababa 1400 Birr /100kgs Bahir Dar 1200 Shashemene 1000 Jimma 800 Mekele 600 400 200 0 Jul-05 Jul-06 Jul-07 Jul-08 Jul-09 Jul-10 Jul-11 Jul-12 Nov-08 Nov-05 Nov-06 Nov-07 Nov-09 Nov-10 Nov-11 Mar-06 Mar-07 Mar-08 Mar-09 Mar-10 Mar-11 Mar-12
  • 10.
    Price difference betweenregional markets Fig. : Nominal maize price difference b/n major regional markets 800 700 Addis Ababa 600 Dire Dawa 500 Shashemene Birr/100kgs 400 Jimma 300 200 100 0 May-11 May-06 May-07 May-08 May-09 May-10 May-12 Jan-06 Jan-07 Jan-08 Jan-09 Jan-10 Jan-11 Jan-12 Sep-06 Sep-07 Sep-08 Sep-09 Sep-10 Sep-11 Sep-12 Source: EGTE, 2012
  • 11.
    Real and NominalPrice trends of teff and wheat Fig. 5: Price trends of teff (real and nominal) 1200 1000 Addis Ababa (NP) Price (Birr/100Kgs) 800 Addis Ababa (RP) 600 400 200 0 Nov-04 Nov-09 Apr-10 Apr-05 Aug-08 Jan-04 May-07 Mar-08 Jan-09 Sep-05 Feb-06 Sep-10 Jul-06 Dec-06 Feb-11 Jul-11 Dec-11 Oct-07 Jun-04 Jun-09 The divergence between nominal and real prices may accounts for current food price inflation
  • 12.
    Price trends ofmaize 700 Fig. 6: Price trends of Maize (real and nominal) 600 AA Addis Ababa (NP) Prices (Birr/100Kgs) 500 AA Addis Ababa (RP) 400 300 200 100 0 Apr-08 Apr-05 Aug-05 Apr-06 Aug-06 Apr-07 Aug-07 Aug-08 Apr-09 Aug-09 Apr-10 Aug-10 Apr-11 Aug-11 Dec-11 Dec-04 Dec-05 Dec-06 Dec-07 Dec-08 Dec-09 Dec-10 • Maize and sorghum prices exhibited high volatility • During second price surge in 2011, wheat and maize price exceeded its 2008 level.
  • 13.
    Ethiopia, global &regional prices Fig. 7: Global and regional maize price index (Jan. 2007= 100) 600 Kenya - dry maize bag 90kg bag Uganda - Maize grain Kg 500 Ethiopia- Maize (white) kg Tanzania Wholesale Prices TZS/ 100 kg FAO Global - Maize (U.S. Gulf, #2 yellow, US$/Ton) 400 Malawi - Retail prices in Malawi kwacha per kilogram Index 300 200 100 0 Jul-07 Jul-08 Jul-09 Jul-10 Jul-11 Sep-07 Sep-08 Sep-09 Sep-10 Sep-11 Jan-08 Mar-11 Jan-07 Mar-07 Nov-07 Mar-08 Nov-08 Jan-09 Mar-09 Nov-09 Jan-10 Mar-10 Nov-10 Jan-11 May-11 May-07 May-08 May-09 May-10
  • 14.
    Ethiopia, global &regional prices Fig. 8: Ethiopia vs. global and regional wheat price index (Jan 2007 = 100) 300 250 200 150 100 Ethiopia- White Wheat Milled Kg 50 Kenya- Wheat Bag Zambia- Wheat (flour), Retail, Kwacha, 2.5 Kg FAO Global - Soft Red Winter Wheat , US Gulf (US$/Ton) 0 Nov-09 Nov-07 Nov-08 Nov-10 Mar-07 May-07 Mar-08 May-08 Mar-09 May-09 Mar-10 May-10 Mar-11 May-11 Jul-07 Sep-07 Jul-08 Sep-08 Jul-09 Sep-09 Jul-10 Sep-10 Jul-11 Sep-11 Jan-08 Jan-07 Jan-09 Jan-10 Jan-11
  • 15.
    Wheat: Import &export parity prices Fig. 9: Wheat: Import and export parity prices 800 Wholesale price at Addis Ababa ($/MT) 700 Price (USD/MT) Import parity (Addis Ababa) 600 Export parity (FOB Djibouti) 500 400 300 200 100 0
  • 16.
    Maize: Import &export parity price 700 Fig. 10: Maize: Import and export parity price 600 500 Wholesale price at Addis Ababa ($/MT) Price ($/MT) 400 Import parity (Addis Ababa) Export parity (FOB Djibouti) 300 200 100 0 Nov-02 Nov-09 May-99 May-06 Mar-98 Mar-05 Mar-12 Sep-01 Sep-08 Feb-01 Dec-99 Jul-00 Apr-02 Dec-06 Jul-07 Feb-08 Apr-09 Aug-97 Oct-98 Jun-03 Aug-04 Oct-05 Jun-10 Aug-11 Jan-97 Jan-04 Jan-11
  • 17.
    3. Causes offood price inflation in Ethiopia Why high food price inflation in Ethiopia? – Little consensus on the relative importance of factors: Increase in domestic demand, expansionary monetary policy, a shift from food aid to cash transfers, high investments in infrastructure; – Overall inflation in Ethiopia partly associated with agriculture production and food supply situation in the global economy; – Increase in international commodity prices including oil; mal- functioning of wholesale markets; rapid increase in money supply; inflationary expectations; institutional weakness to manage abnormal price movement; – Economic growth  increasing demand, urbanisation, changing consumption pattern; – Hoarding  speculation by traders/millers/retailers/farmers
  • 18.
    Impacts on thepoor • Large negative impacts on poor net consumers of food, because food is a large part of household budget (Eg., food account for > 60% HH exp. ). • Potentially positive impact on net producers of food, if farmers have access to agricultural inputs and markets.
  • 19.
    4. Government responses •During 2008 food price crisis, the GoE initiated a subsidized urban food supply programs, carried out open market sales, suspended local procurement by the World Food Programme (WFP); removal of taxes on food items, banning cereal export, • In January 2011, the government imposed price caps on basic commodes and lifted in the June 2011 (for most commodities but not all); • Outcome(s): subsidized food supply stabilized market prices of cereals but of price cap is not very clear.
  • 20.
    5. Concluding remarks Observationsfrom trends: • Ethiopia has registered considerable economic growth in the last nine years; • In Ethiopia, food prices remained high compared to many countries; • Excessive price volatility; • Dominance of some of markets over others (e.g., Addis Ababa)
  • 21.
    5. Concluding remarks •Suggested policy choices: - Short term: • Prudent macroeconomic policy • Understanding market structure and behavior (wholesale market); • Protecting the most vulnerable through the expansion of social protection programs (PSNP, and others). - Medium term: • Rising domestic agricultural production/supply and productivity; • Stimulating private investment in agriculture; • Improving competitiveness of agricultural markets

Editor's Notes

  • #4 It is well recognised that ensuring access to adequate food is beyond simple food security. It has great implication for as low level of infant (adult) mortality, low level of malnutrition; good health status, strong and active citizen and this will help that country to grow faster as it has capable citizens that can produce effectively and efficiently.
  • #5 FAO Food Price Index (FFPI) averaged 214 points in April 2012, down 1.4% from March. The decline was largely driven by falls in sugar and dairy prices followed by cereals which more than offset strong gains in oils and a slight rise in meat prices. The FFPI moved up steadily in the first quarter of 2012 and while it fell in April, it still remained above the December 2011 level, which was the lowest in over a year.The FAO Cereal PriceIndex averaged 224 points in April, down 2% from March. Maize quotations declined most, by 2.5 percent, reflecting good production prospects. Wheat prices fell slightly, by just over 1 percent, while rice values were also down marginally. Compared to April last year, the index was down 16 percent.
  • #8 Cereal production and marketing are the means of livelihood for millions of households in Ethiopia. It is the single largest sub-sector within Ethiopia’s agriculture, far exceeding all others in terms of its share in rural employment, agricultural land use, calorie intake, and contribution to national income. Over the past half century, cereals production and marketing has influenced agricultural policy thinking of all three political regimes in Ethiopia.
  • #17 As figure 15 indicate, domestic price of maize remained cheaper since food price increase in 2007. In 2008 it spiked and lay above IPP (get more expensive. This tells private sector has an icnetive to import maize. However, it was not possible due to foreign exchange shortage.