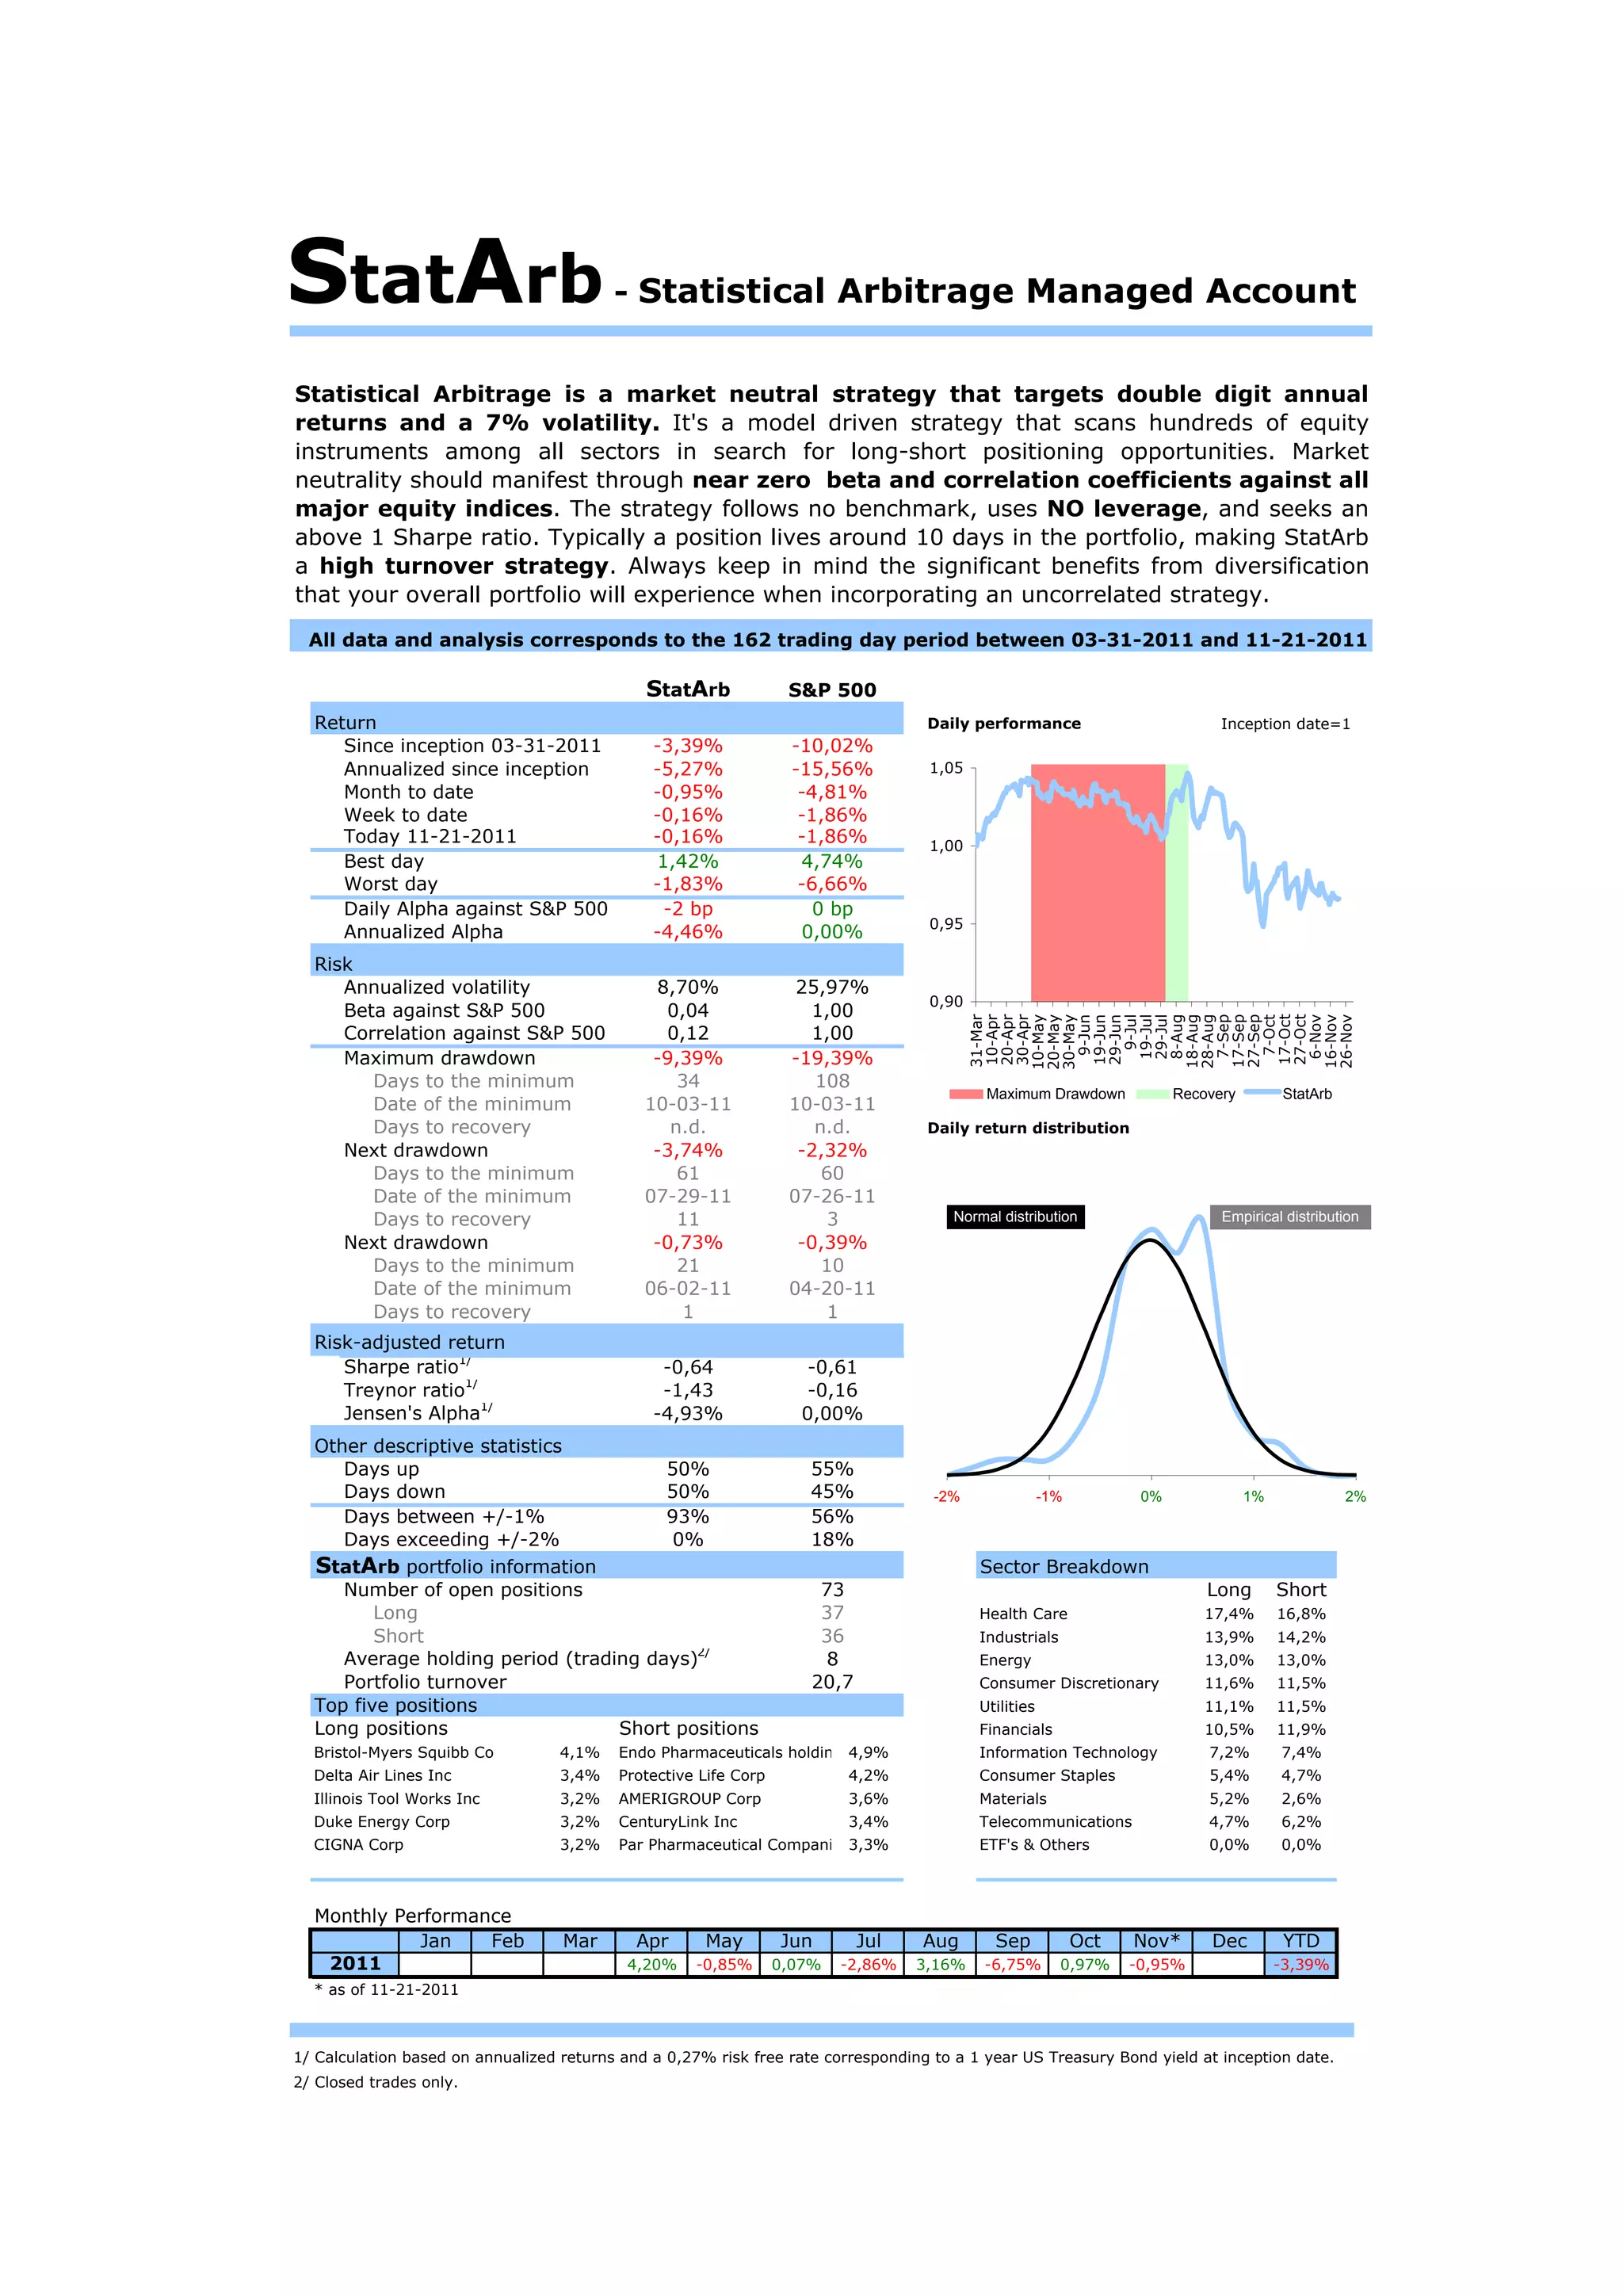
StatArb                                   - Statistical Arbitrage Managed Account


Statistical Arbitrage is a market neutral strategy that targets double digit annual
returns and a 7% volatility. It's a model driven strategy that scans hundreds of equity
instruments among all sectors in search for long-short positioning opportunities. Market
neutrality should manifest through near zero beta and correlation coefficients against all
major equity indices. The strategy follows no benchmark, uses NO leverage, and seeks an
above 1 Sharpe ratio. Typically a position lives around 10 days in the portfolio, making StatArb
a high turnover strategy. Always keep in mind the significant benefits from diversification
that your overall portfolio will experience when incorporating an uncorrelated strategy.
  All data and analysis corresponds to the 162 trading day period between 03-31-2011 and 11-21-2011

                                              StatArb             S&P 500
  Return                                                                           Daily performance                          Inception date=1
     Since inception 03-31-2011                -3,39%              -10,02%
     Annualized since inception                -5,27%              -15,56%         1,05
     Month to date                             -0,95%               -4,81%
     Week to date                              -0,16%               -1,86%
     Today 11-21-2011                          -0,16%               -1,86%         1,00
     Best day                                  1,42%                4,74%
     Worst day                                 -1,83%               -6,66%
     Daily Alpha against S&P 500                -2 bp                 0 bp
                                                                                   0,95
     Annualized Alpha                          -4,46%               0,00%
  Risk
     Annualized volatility                     8,70%               25,97%
                                                                                   0,90
     Beta against S&P 500                       0,04                1,00


                                                                                             9-Jul
                                                                                            19-Jul
                                                                                            29-Jul
                                                                                          31-Mar
                                                                                          10-Apr
                                                                                          20-Apr
                                                                                          30-Apr
                                                                                          10-May
                                                                                          20-May
                                                                                          30-May


                                                                                          16-Nov
                                                                                          26-Nov
                                                                                            9-Jun
                                                                                          19-Jun
                                                                                          29-Jun


                                                                                            8-Aug
                                                                                          18-Aug
                                                                                          28-Aug
                                                                                            7-Sep
                                                                                          17-Sep
                                                                                          27-Sep
                                                                                            7-Oct
                                                                                           17-Oct
                                                                                           27-Oct
                                                                                            6-Nov
     Correlation against S&P 500                0,12                1,00
     Maximum drawdown                          -9,39%             -19,39%
        Days to the minimum                       34                 108
                                                                                           Maximum Drawdown             Recovery         StatArb
        Date of the minimum                   10-03-11            10-03-11
        Days to recovery                         n.d.                n.d.          Daily return distribution
     Next drawdown                             -3,74%              -2,32%
        Days to the minimum                       61                  60
        Date of the minimum                   07-29-11            07-26-11
        Days to recovery                          11                   3              Normal distribution                     Empirical distribution
     Next drawdown                             -0,73%              -0,39%
        Days to the minimum                       21                  10
        Date of the minimum                   06-02-11            04-20-11
        Days to recovery                           1                   1
  Risk-adjusted return
     Sharpe ratio1/                             -0,64                -0,61
     Treynor ratio1/                            -1,43                -0,16
     Jensen's Alpha1/                          -4,93%               0,00%
  Other descriptive statistics
     Days up                           50%                          55%
     Days down                         50%                          45%             -2%               -1%          0%              1%              2%
     Days between +/-1%                93%                          56%
     Days exceeding +/-2%               0%                          18%
  StatArb portfolio information                                                           Sector Breakdown
     Number of open positions                                         73                                                    Long        Short
         Long                                                         37                  Health Care                       17,4%       16,8%
         Short                                                        36                  Industrials                       13,9%       14,2%
     Average holding period (trading days)2/                           8                  Energy                            13,0%       13,0%
     Portfolio turnover                                              20,7                 Consumer Discretionary            11,6%       11,5%
  Top five positions                                                                      Utilities                         11,1%       11,5%
  Long positions                  Short positions                                         Financials                        10,5%       11,9%
  Bristol-Myers Squibb Co          4,1%   Endo Pharmaceuticals holdin    4,9%             Information Technology            7,2%        7,4%
  Delta Air Lines Inc              3,4%   Protective Life Corp           4,2%             Consumer Staples                  5,4%        4,7%
  Illinois Tool Works Inc          3,2%   AMERIGROUP Corp                3,6%             Materials                         5,2%        2,6%
  Duke Energy Corp                 3,2%   CenturyLink Inc                3,4%             Telecommunications                4,7%        6,2%
  CIGNA Corp                       3,2%   Par Pharmaceutical Compani     3,3%             ETF's & Others                    0,0%        0,0%


  Monthly Performance
            Jan    Feb             Mar       Apr      May        Jun        Jul   Aug       Sep             Oct   Nov*       Dec         YTD
   2011                                    4,20%    -0,85%       0,07%   -2,86%   3,16%   -6,75%        0,97%     -0,95%                -3,39%
  * as of 11-21-2011


1/ Calculation based on annualized returns and a 0,27% risk free rate corresponding to a 1 year US Treasury Bond yield at inception date.
2/ Closed trades only.

Stat Arb Factsheet November 21 2011

  • 1.
    StatArb - Statistical Arbitrage Managed Account Statistical Arbitrage is a market neutral strategy that targets double digit annual returns and a 7% volatility. It's a model driven strategy that scans hundreds of equity instruments among all sectors in search for long-short positioning opportunities. Market neutrality should manifest through near zero beta and correlation coefficients against all major equity indices. The strategy follows no benchmark, uses NO leverage, and seeks an above 1 Sharpe ratio. Typically a position lives around 10 days in the portfolio, making StatArb a high turnover strategy. Always keep in mind the significant benefits from diversification that your overall portfolio will experience when incorporating an uncorrelated strategy. All data and analysis corresponds to the 162 trading day period between 03-31-2011 and 11-21-2011 StatArb S&P 500 Return Daily performance Inception date=1 Since inception 03-31-2011 -3,39% -10,02% Annualized since inception -5,27% -15,56% 1,05 Month to date -0,95% -4,81% Week to date -0,16% -1,86% Today 11-21-2011 -0,16% -1,86% 1,00 Best day 1,42% 4,74% Worst day -1,83% -6,66% Daily Alpha against S&P 500 -2 bp 0 bp 0,95 Annualized Alpha -4,46% 0,00% Risk Annualized volatility 8,70% 25,97% 0,90 Beta against S&P 500 0,04 1,00 9-Jul 19-Jul 29-Jul 31-Mar 10-Apr 20-Apr 30-Apr 10-May 20-May 30-May 16-Nov 26-Nov 9-Jun 19-Jun 29-Jun 8-Aug 18-Aug 28-Aug 7-Sep 17-Sep 27-Sep 7-Oct 17-Oct 27-Oct 6-Nov Correlation against S&P 500 0,12 1,00 Maximum drawdown -9,39% -19,39% Days to the minimum 34 108 Maximum Drawdown Recovery StatArb Date of the minimum 10-03-11 10-03-11 Days to recovery n.d. n.d. Daily return distribution Next drawdown -3,74% -2,32% Days to the minimum 61 60 Date of the minimum 07-29-11 07-26-11 Days to recovery 11 3 Normal distribution Empirical distribution Next drawdown -0,73% -0,39% Days to the minimum 21 10 Date of the minimum 06-02-11 04-20-11 Days to recovery 1 1 Risk-adjusted return Sharpe ratio1/ -0,64 -0,61 Treynor ratio1/ -1,43 -0,16 Jensen's Alpha1/ -4,93% 0,00% Other descriptive statistics Days up 50% 55% Days down 50% 45% -2% -1% 0% 1% 2% Days between +/-1% 93% 56% Days exceeding +/-2% 0% 18% StatArb portfolio information Sector Breakdown Number of open positions 73 Long Short Long 37 Health Care 17,4% 16,8% Short 36 Industrials 13,9% 14,2% Average holding period (trading days)2/ 8 Energy 13,0% 13,0% Portfolio turnover 20,7 Consumer Discretionary 11,6% 11,5% Top five positions Utilities 11,1% 11,5% Long positions Short positions Financials 10,5% 11,9% Bristol-Myers Squibb Co 4,1% Endo Pharmaceuticals holdin 4,9% Information Technology 7,2% 7,4% Delta Air Lines Inc 3,4% Protective Life Corp 4,2% Consumer Staples 5,4% 4,7% Illinois Tool Works Inc 3,2% AMERIGROUP Corp 3,6% Materials 5,2% 2,6% Duke Energy Corp 3,2% CenturyLink Inc 3,4% Telecommunications 4,7% 6,2% CIGNA Corp 3,2% Par Pharmaceutical Compani 3,3% ETF's & Others 0,0% 0,0% Monthly Performance Jan Feb Mar Apr May Jun Jul Aug Sep Oct Nov* Dec YTD 2011 4,20% -0,85% 0,07% -2,86% 3,16% -6,75% 0,97% -0,95% -3,39% * as of 11-21-2011 1/ Calculation based on annualized returns and a 0,27% risk free rate corresponding to a 1 year US Treasury Bond yield at inception date. 2/ Closed trades only.