Download as PDF, PPTX
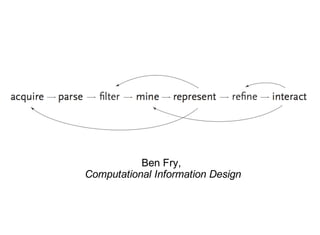
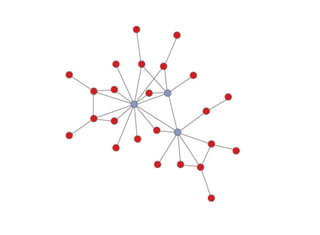
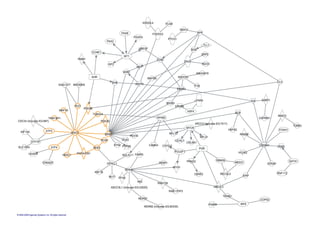
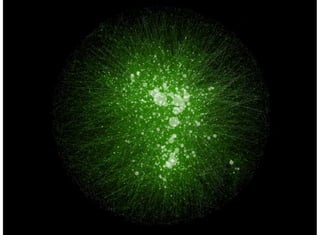

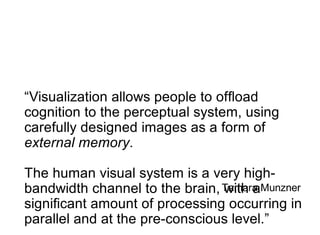


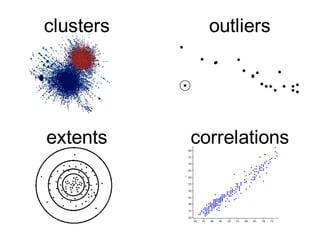


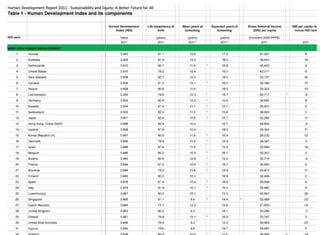
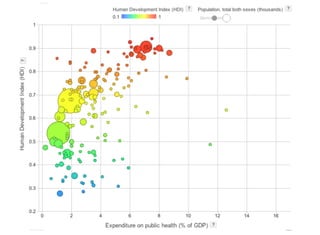
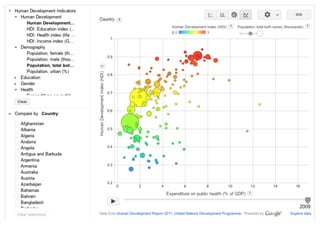

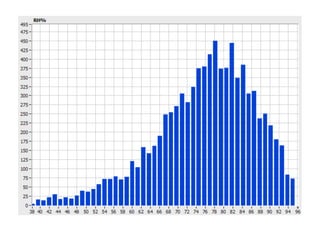
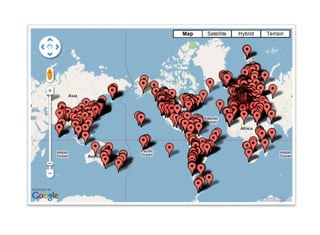
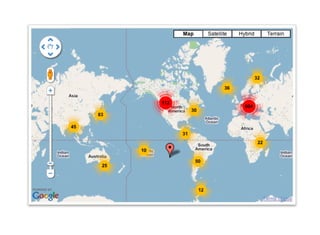

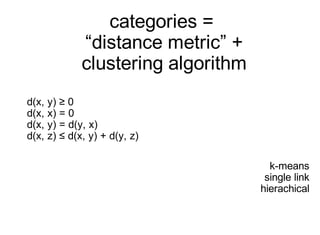
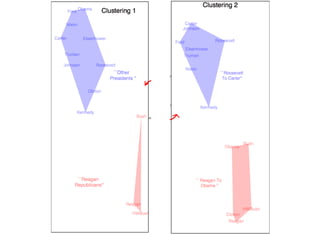

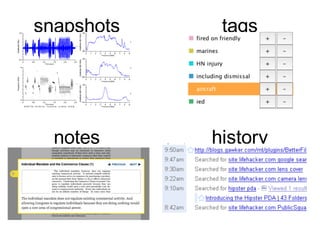


The document discusses big data visualization and its role in enhancing human perception and cognition through carefully designed images. It highlights the importance of filtering and summarizing data, utilizing clustering algorithms to present complex information. The Overview Project and its association with prominent figures like Ben Fry and Tamara Munzner emphasize the need for effective visualization tools in understanding and interacting with big data.