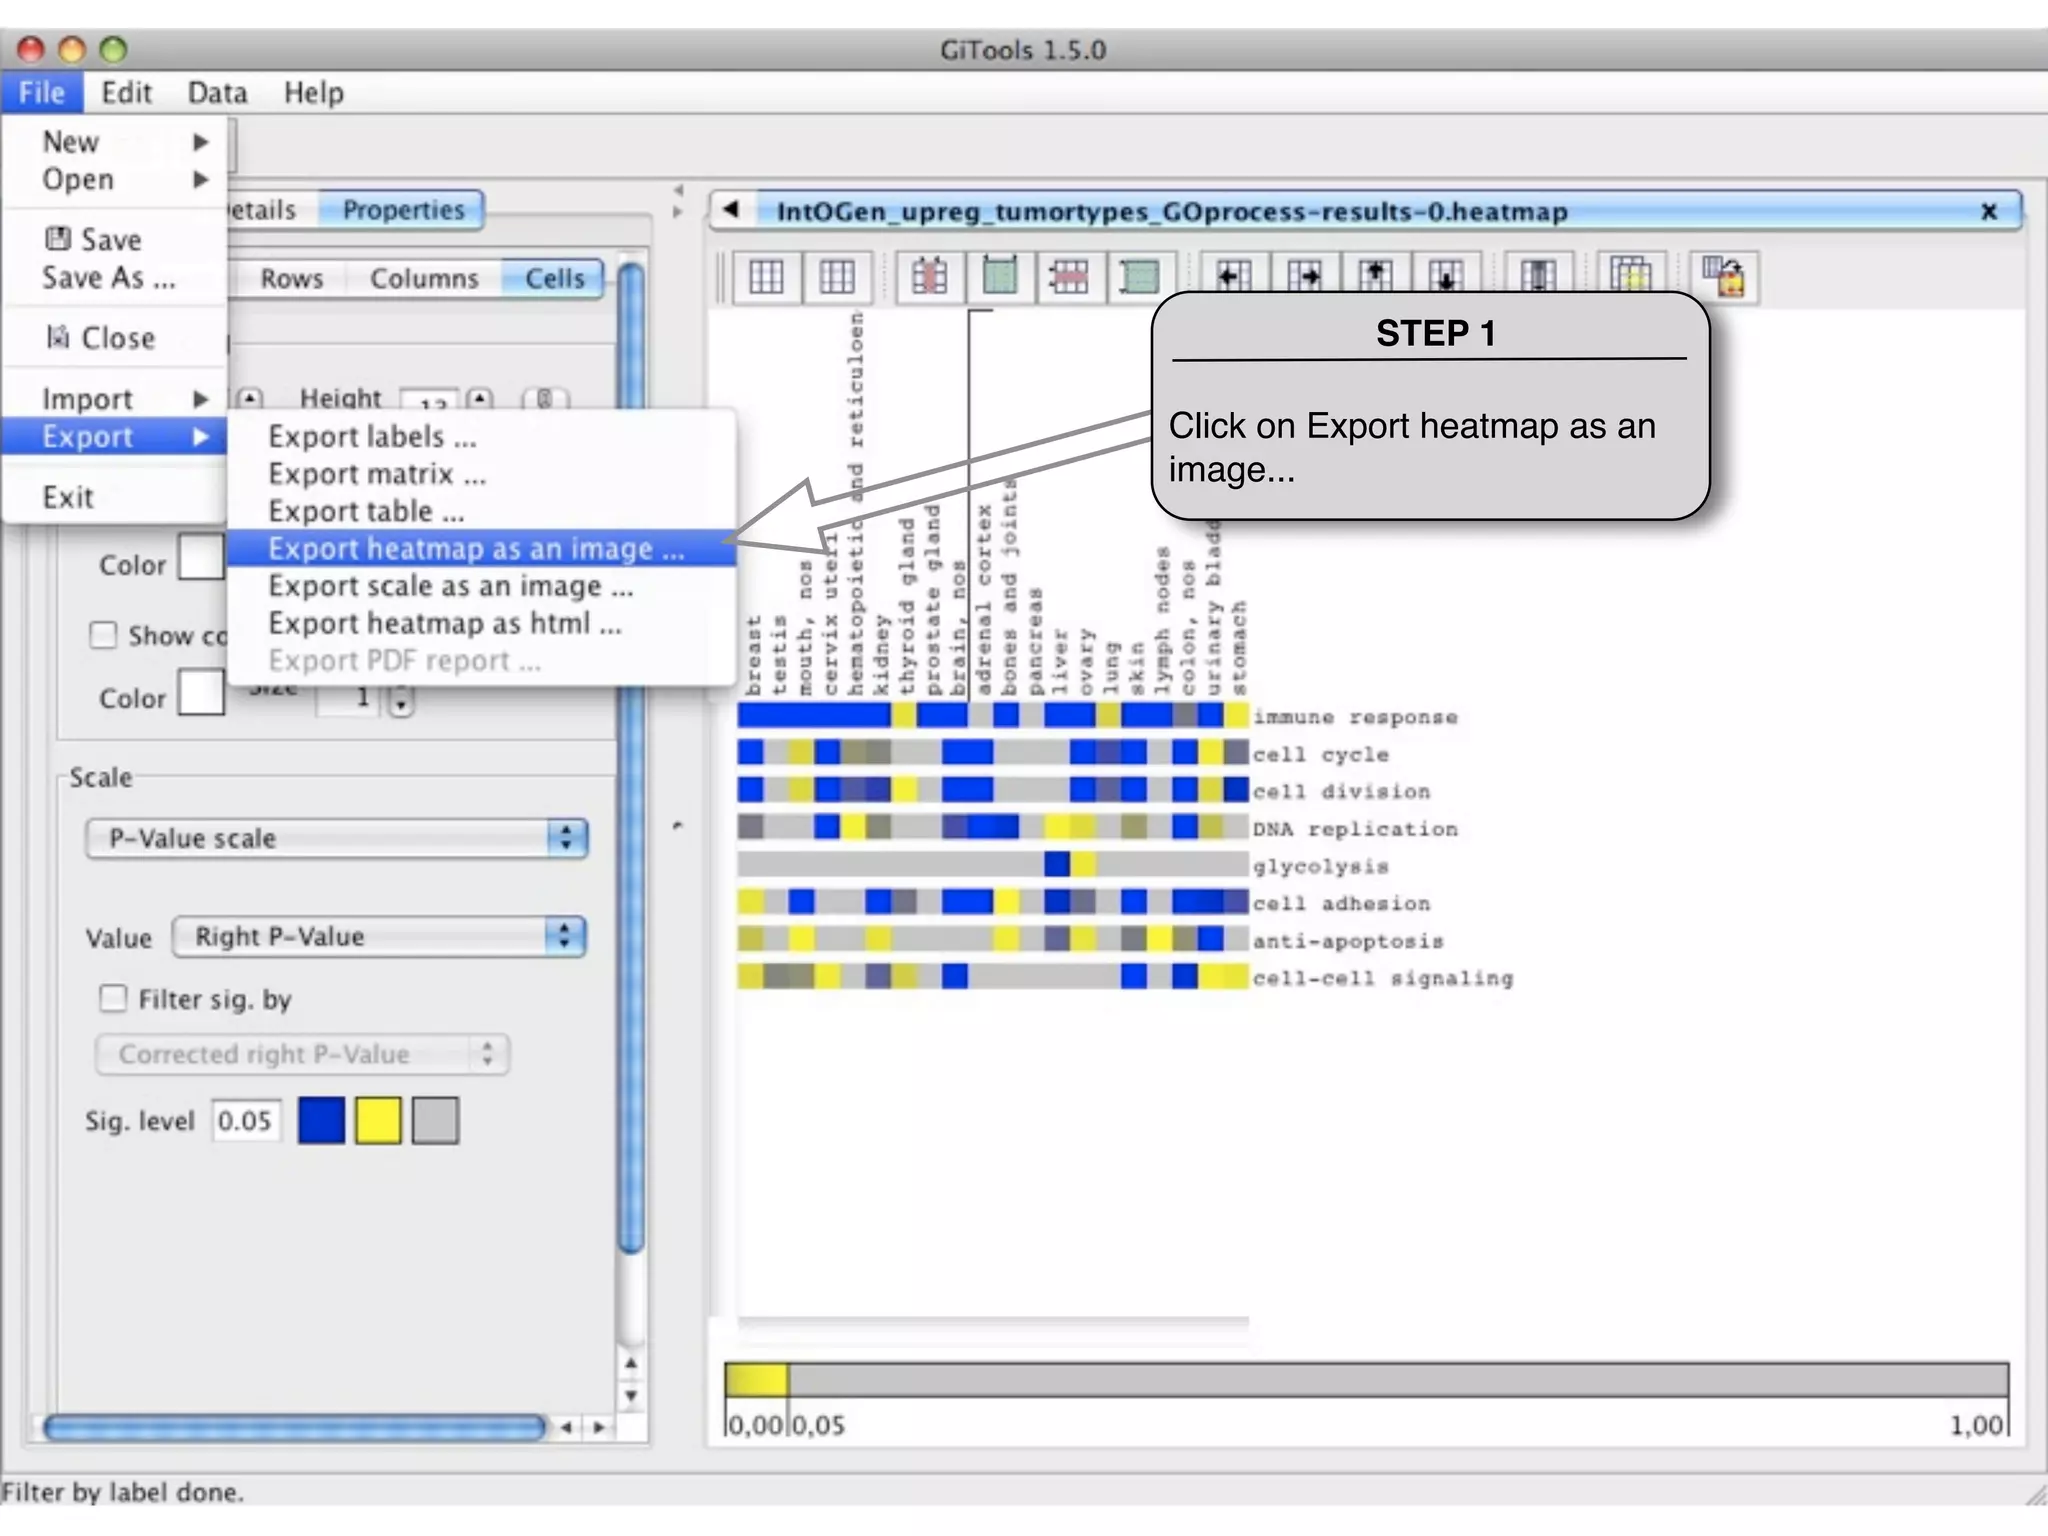
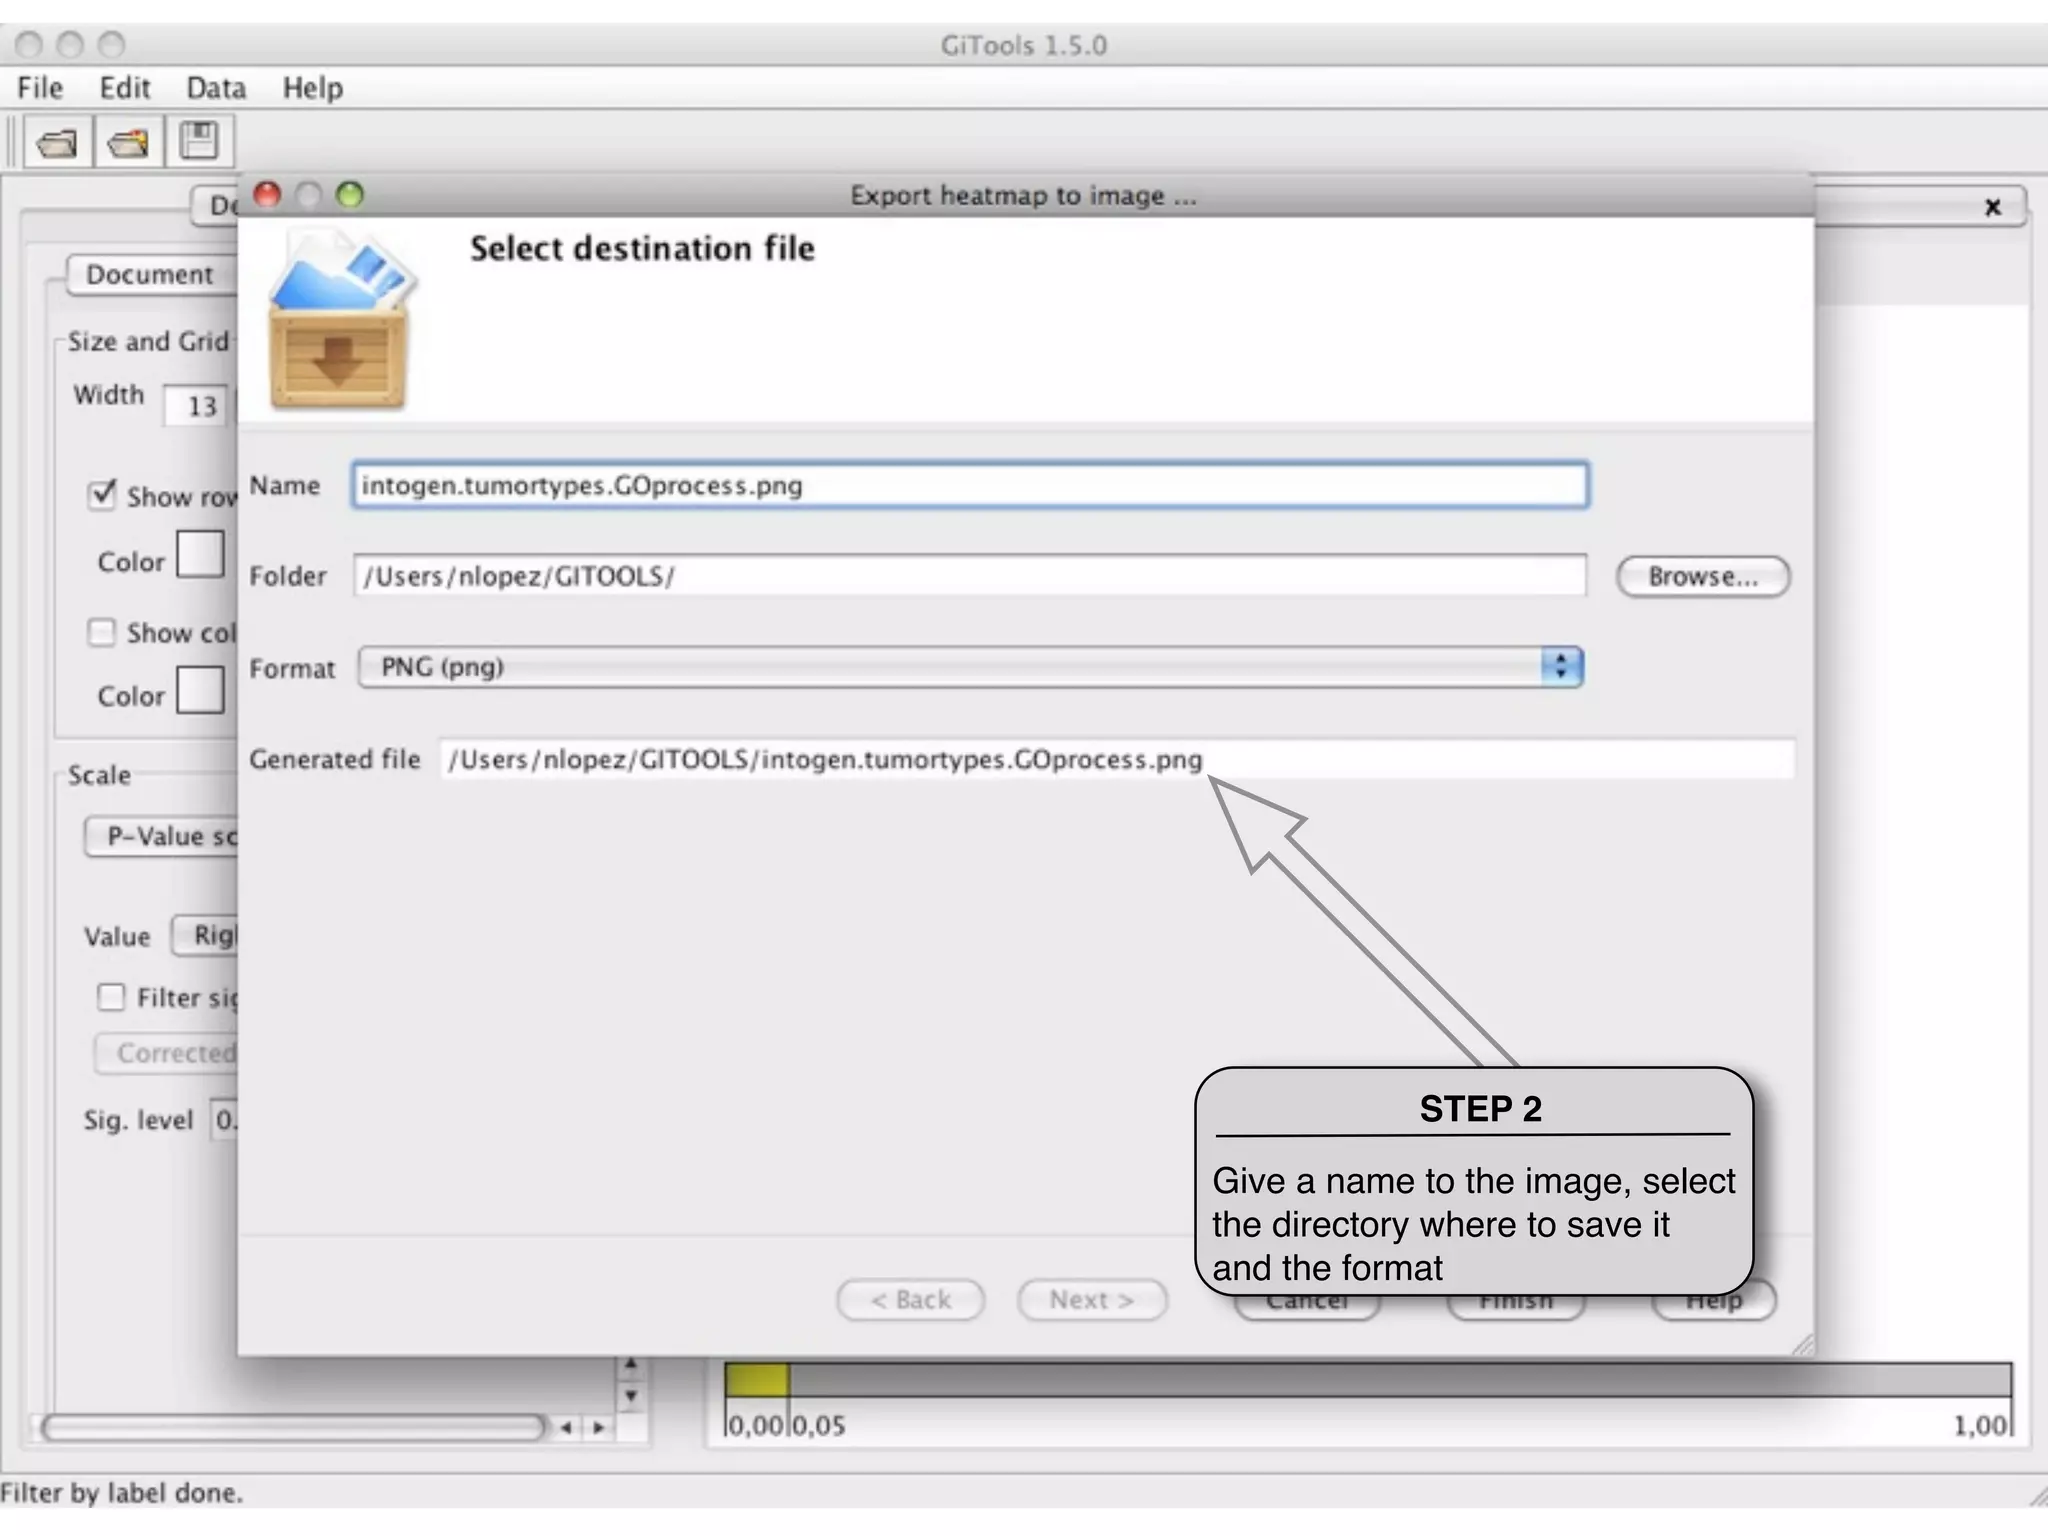
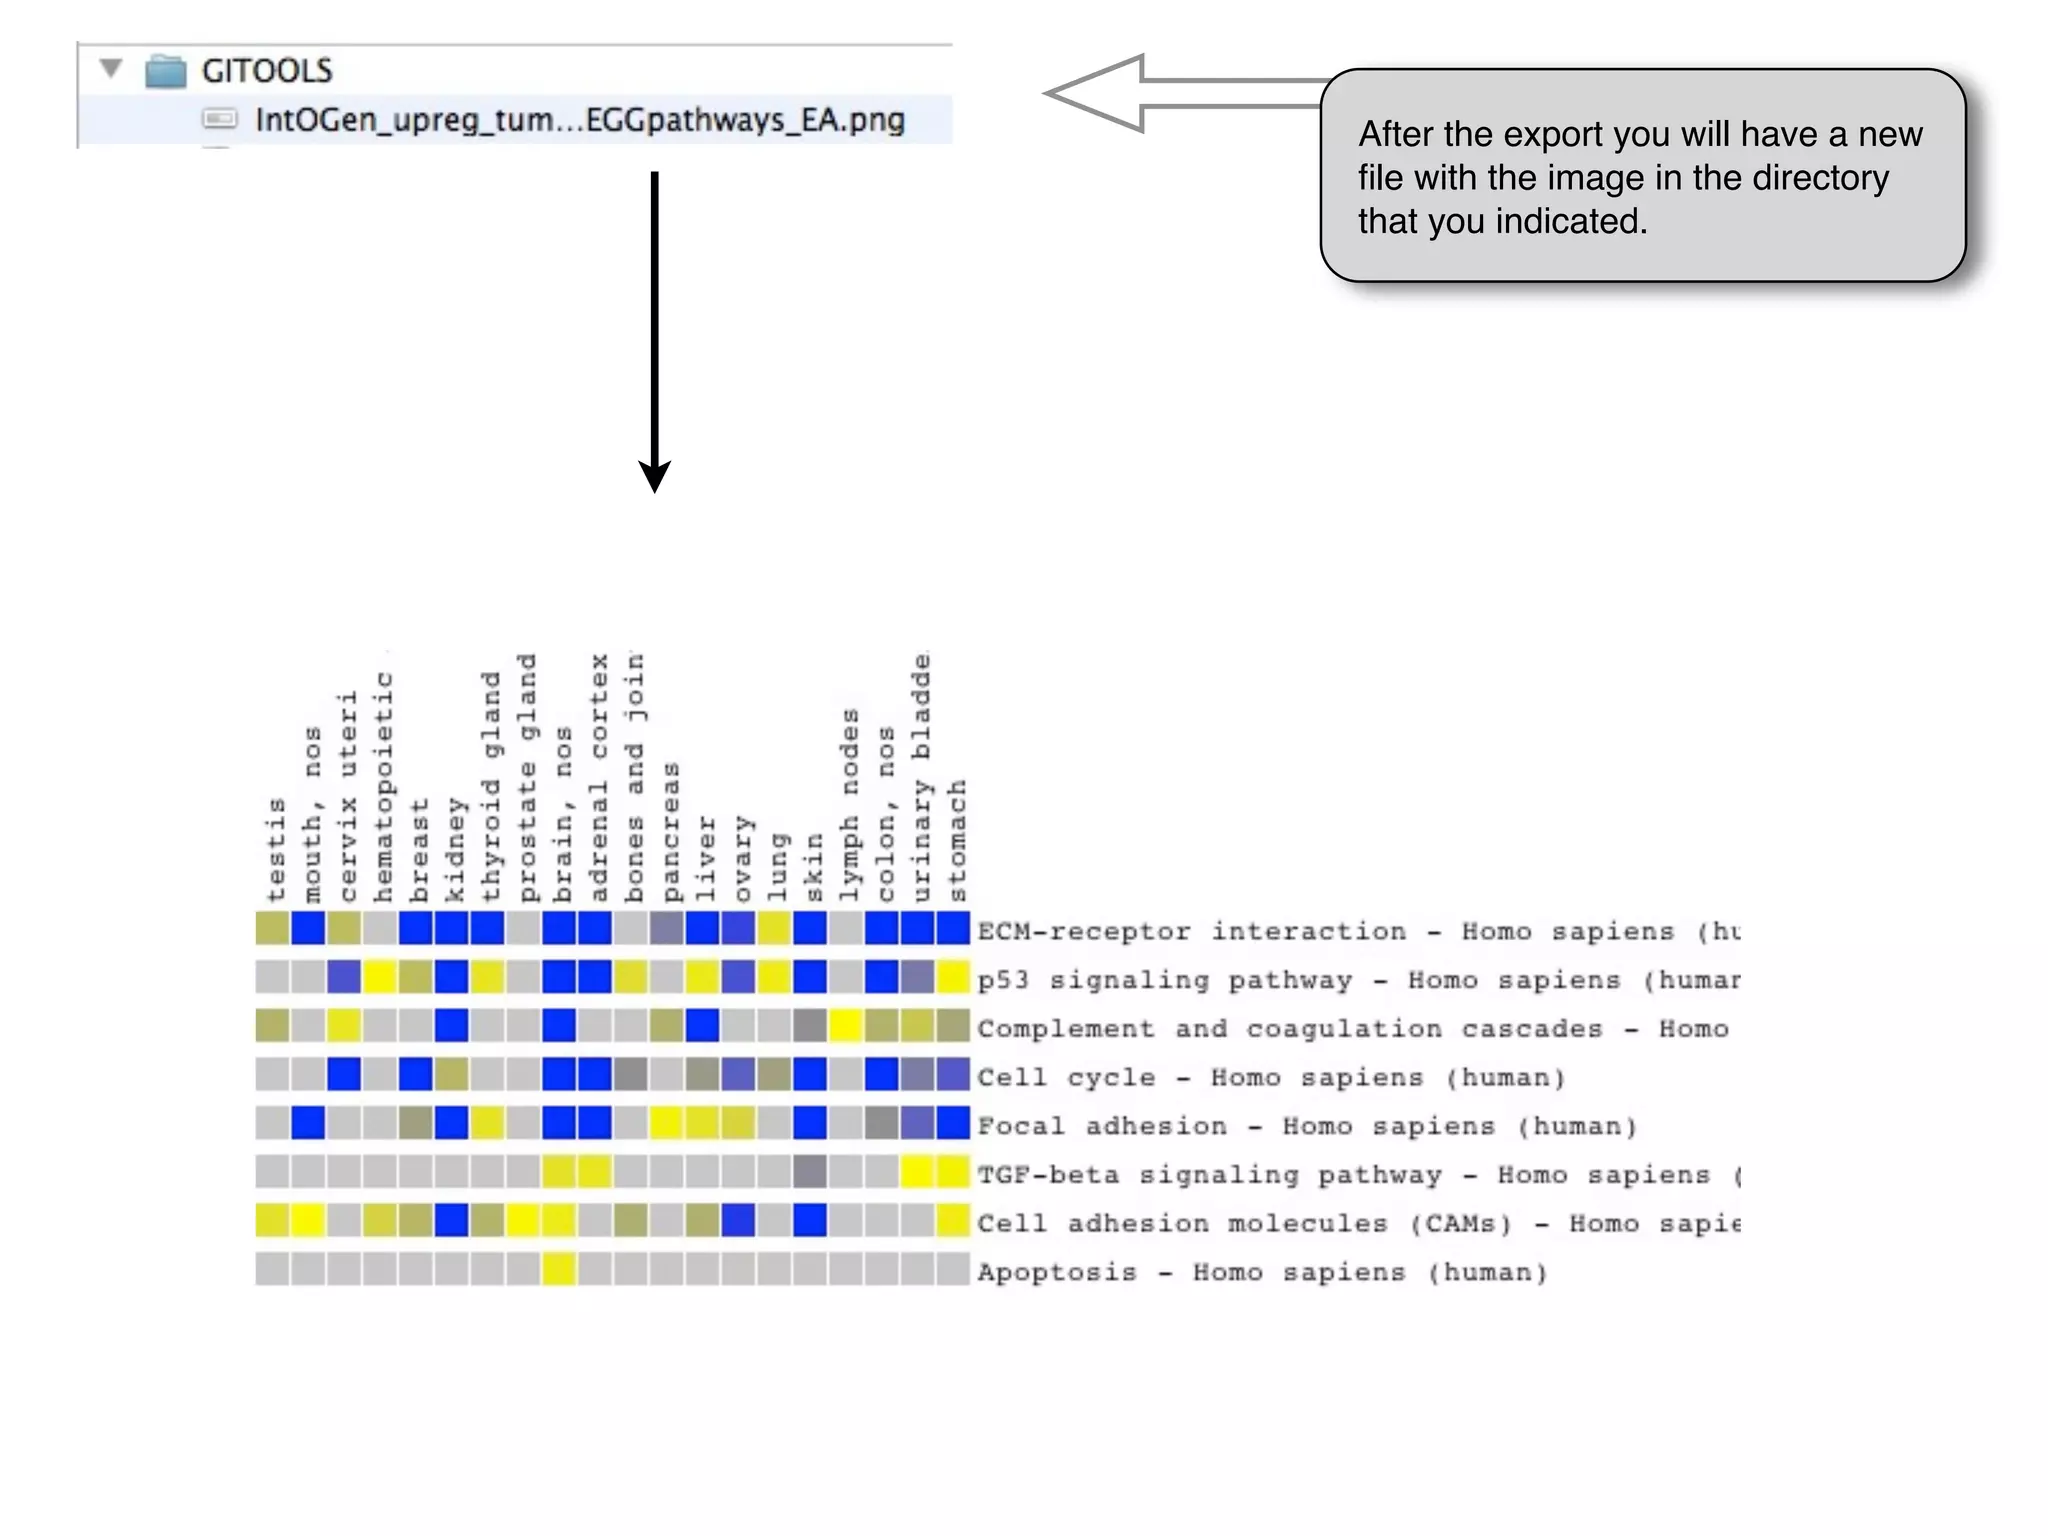
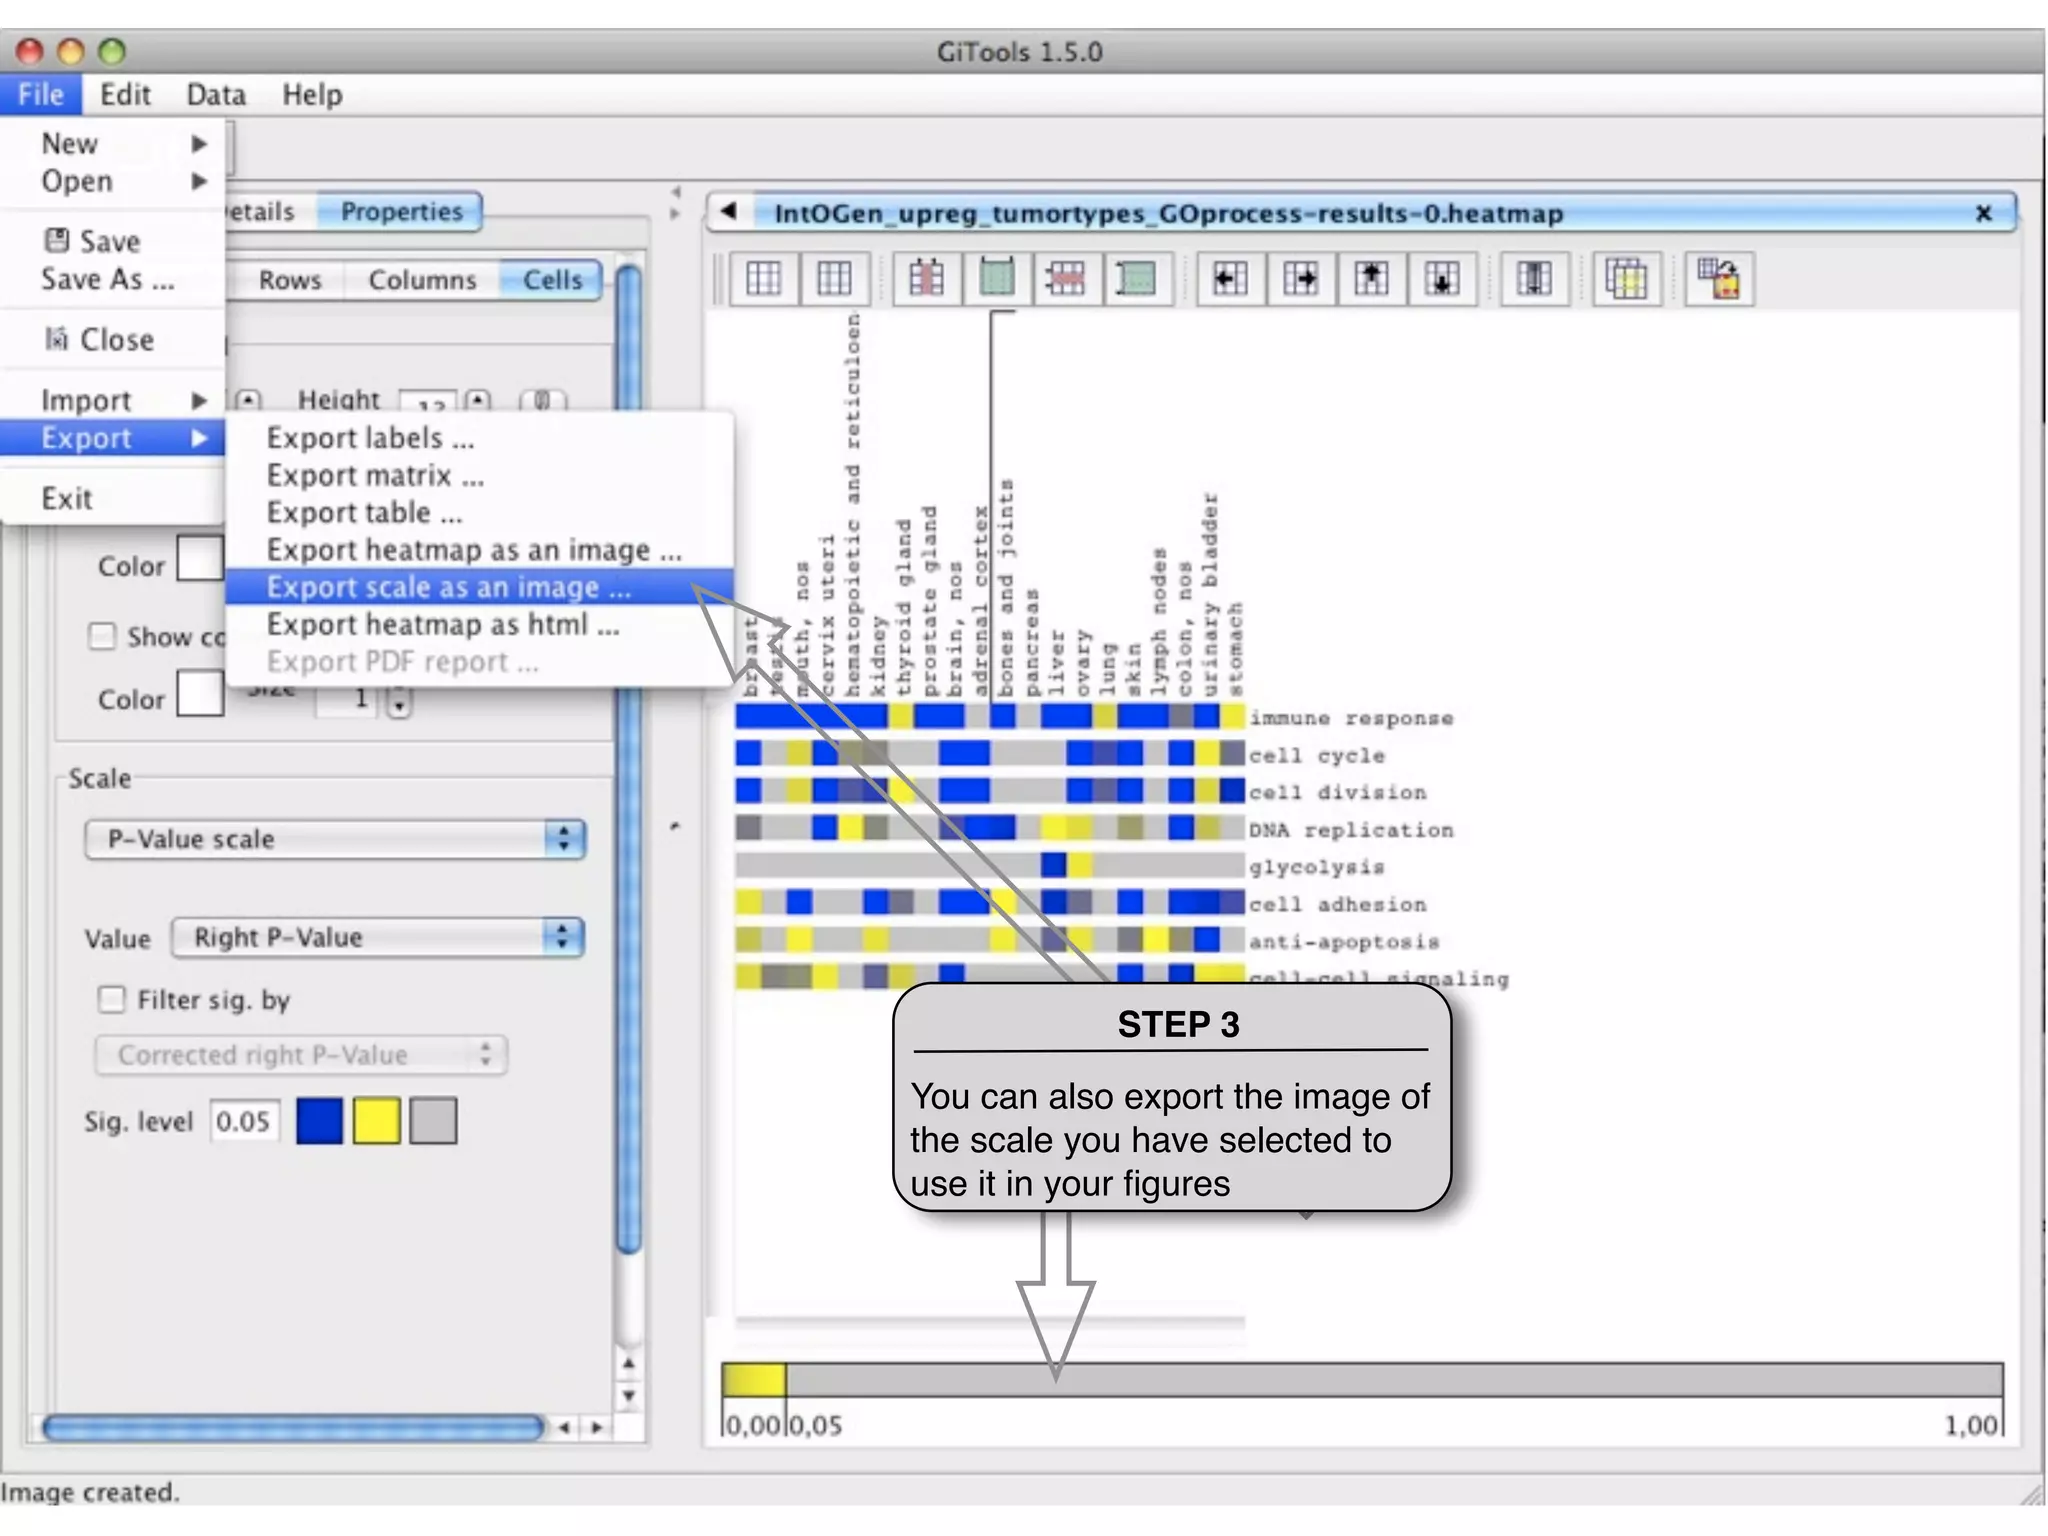
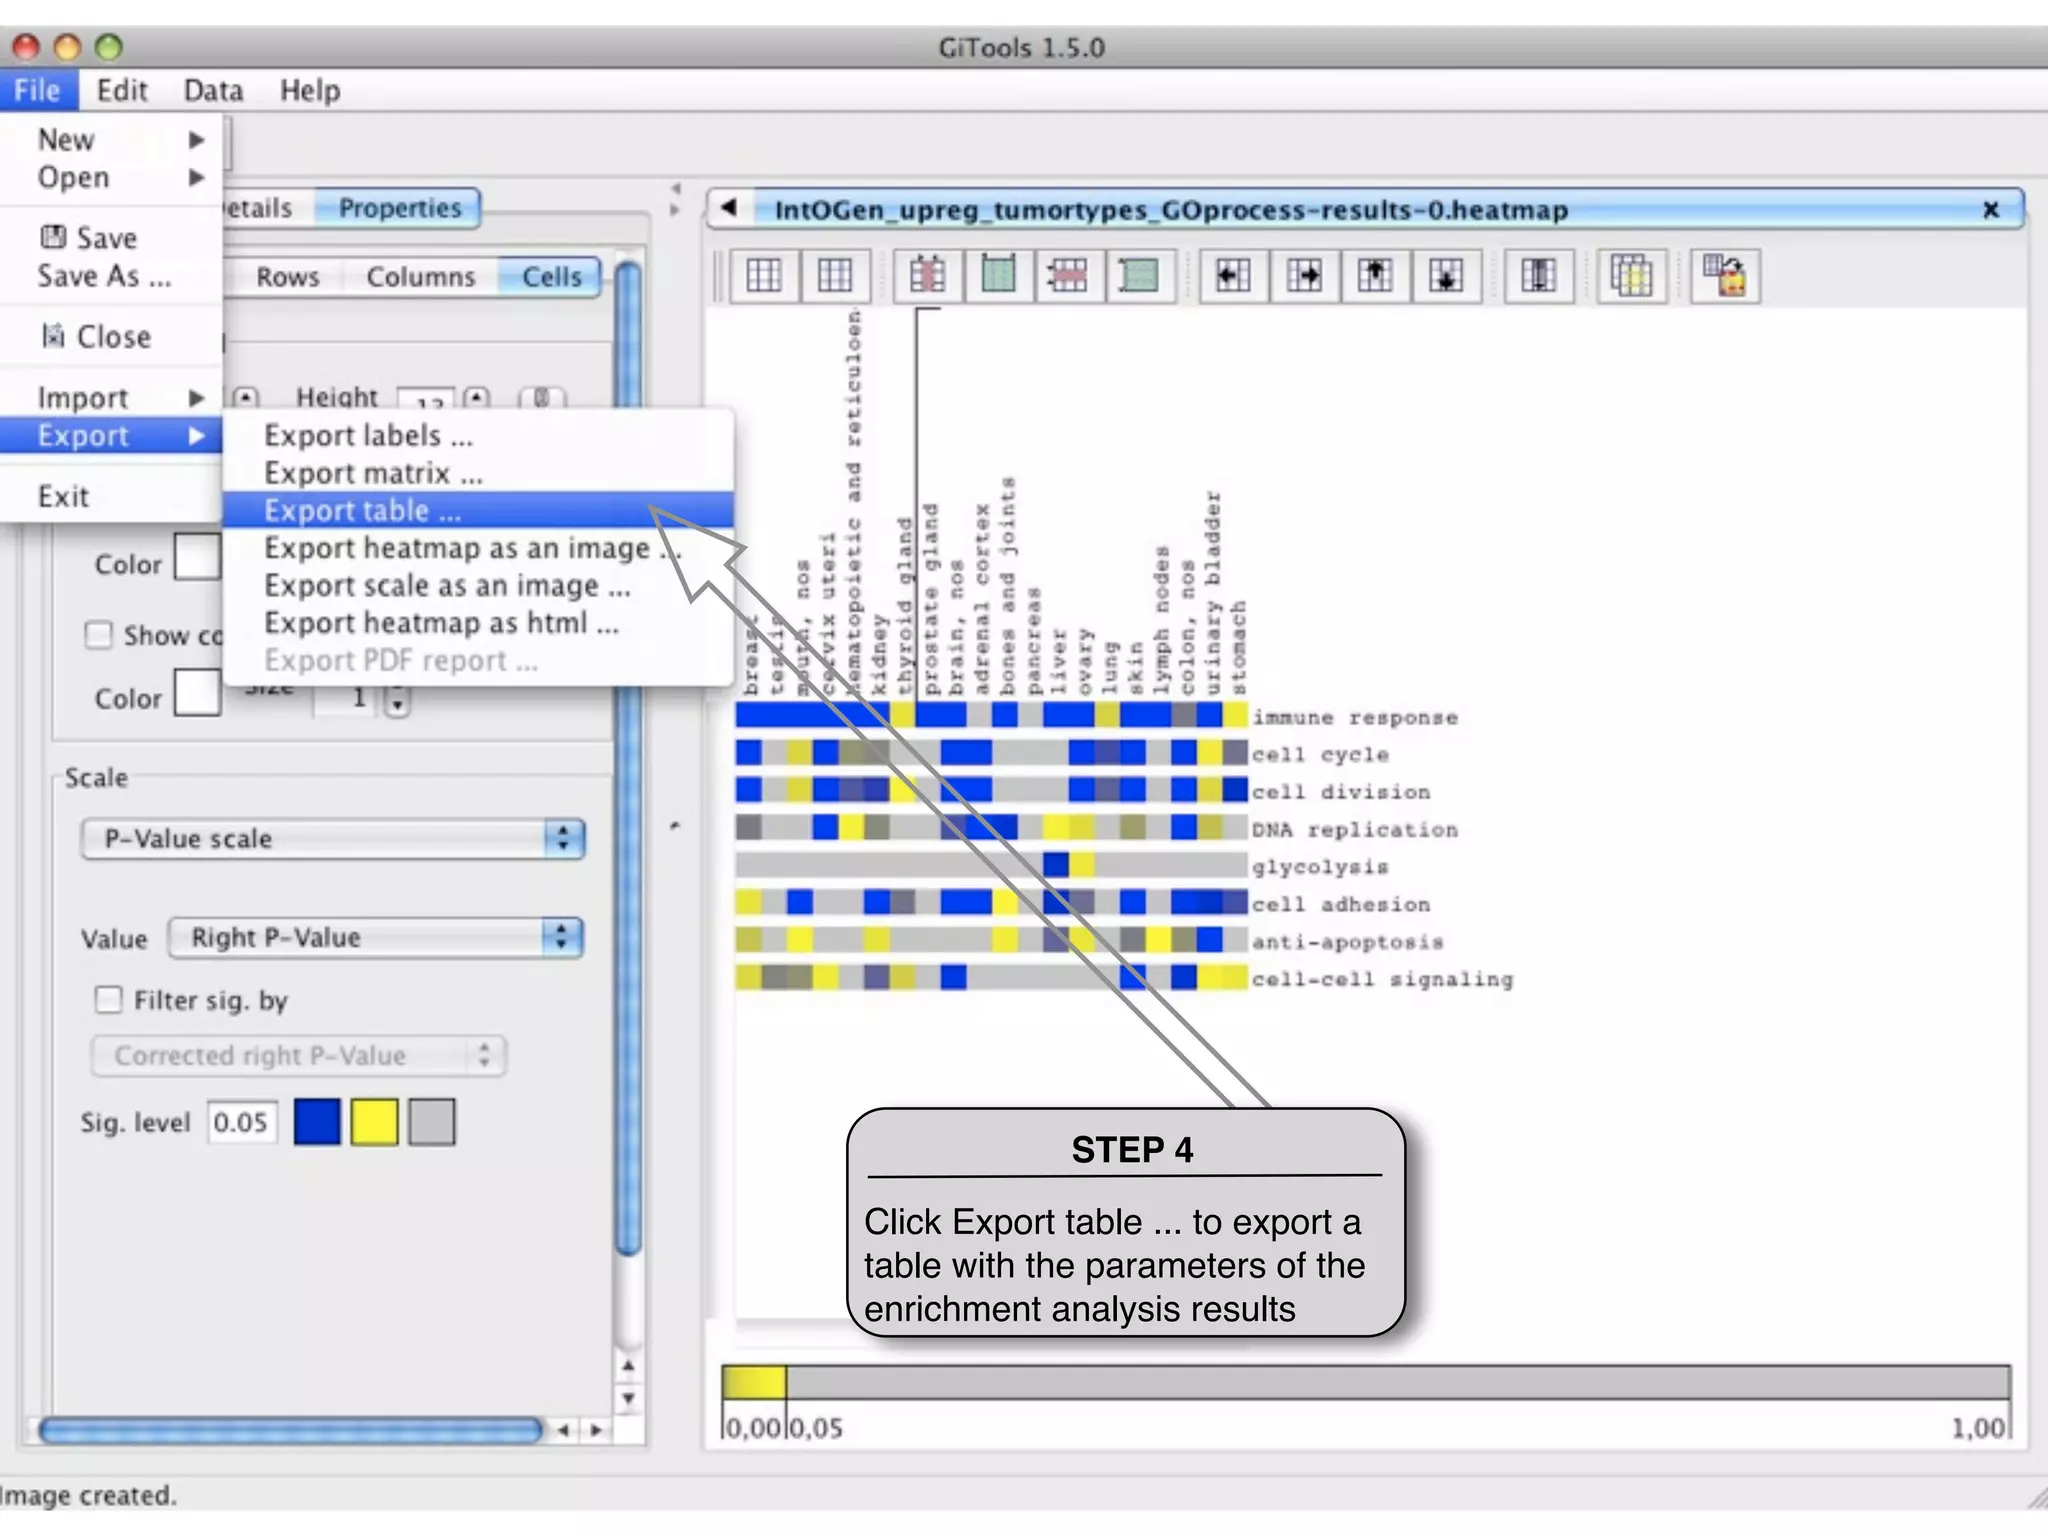
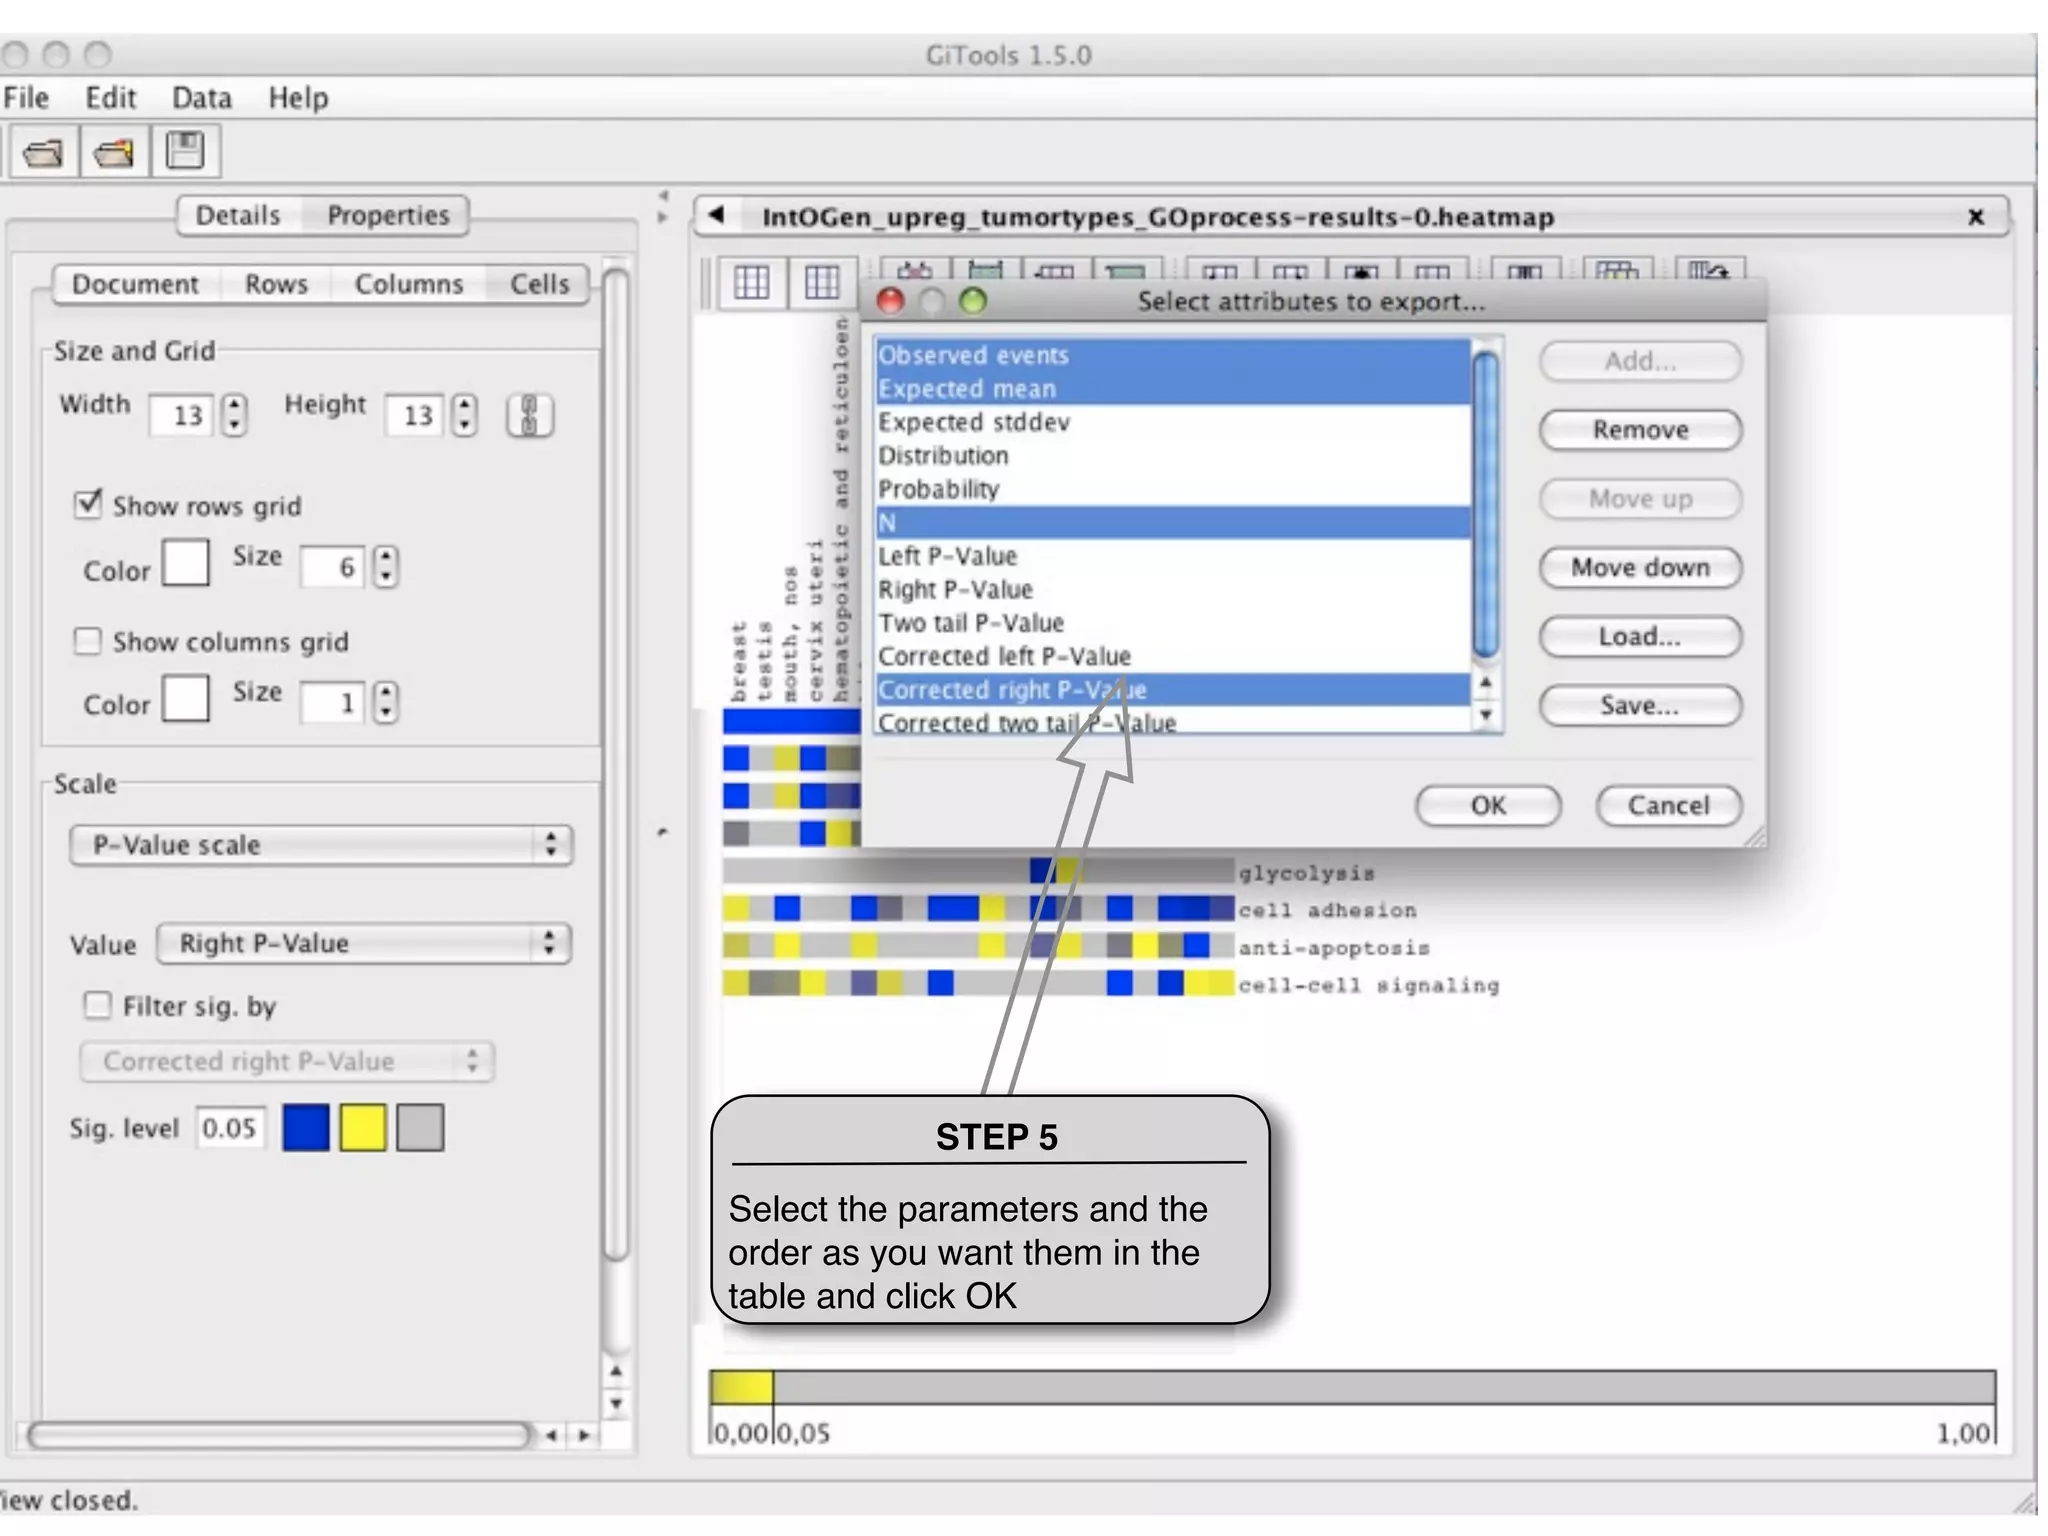
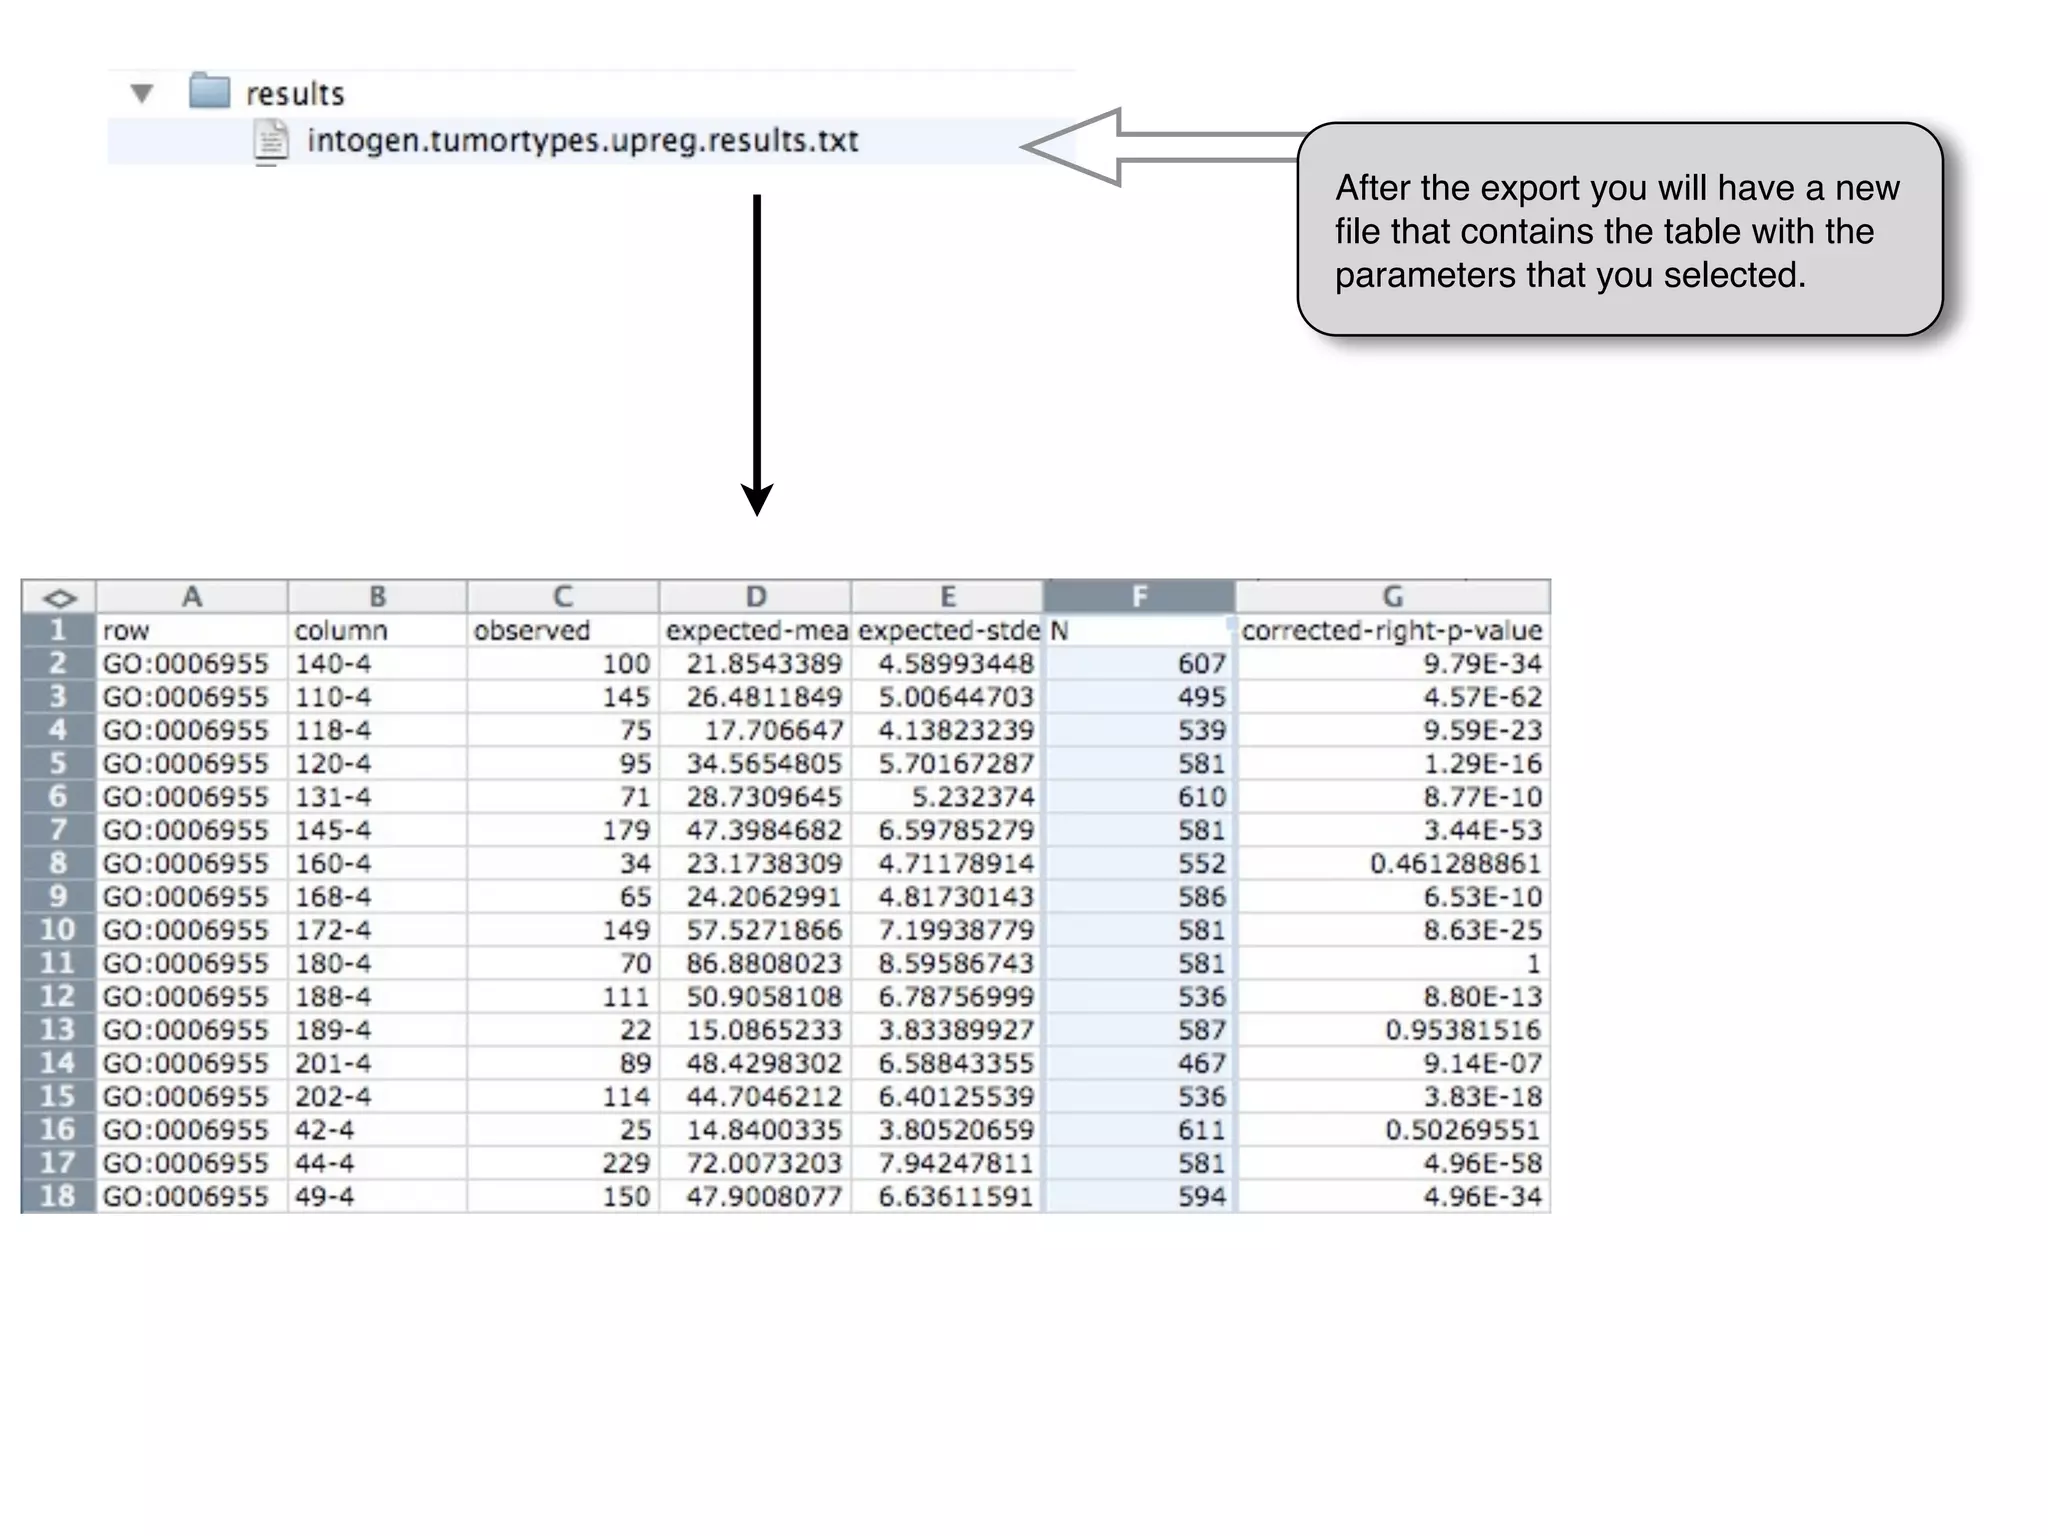
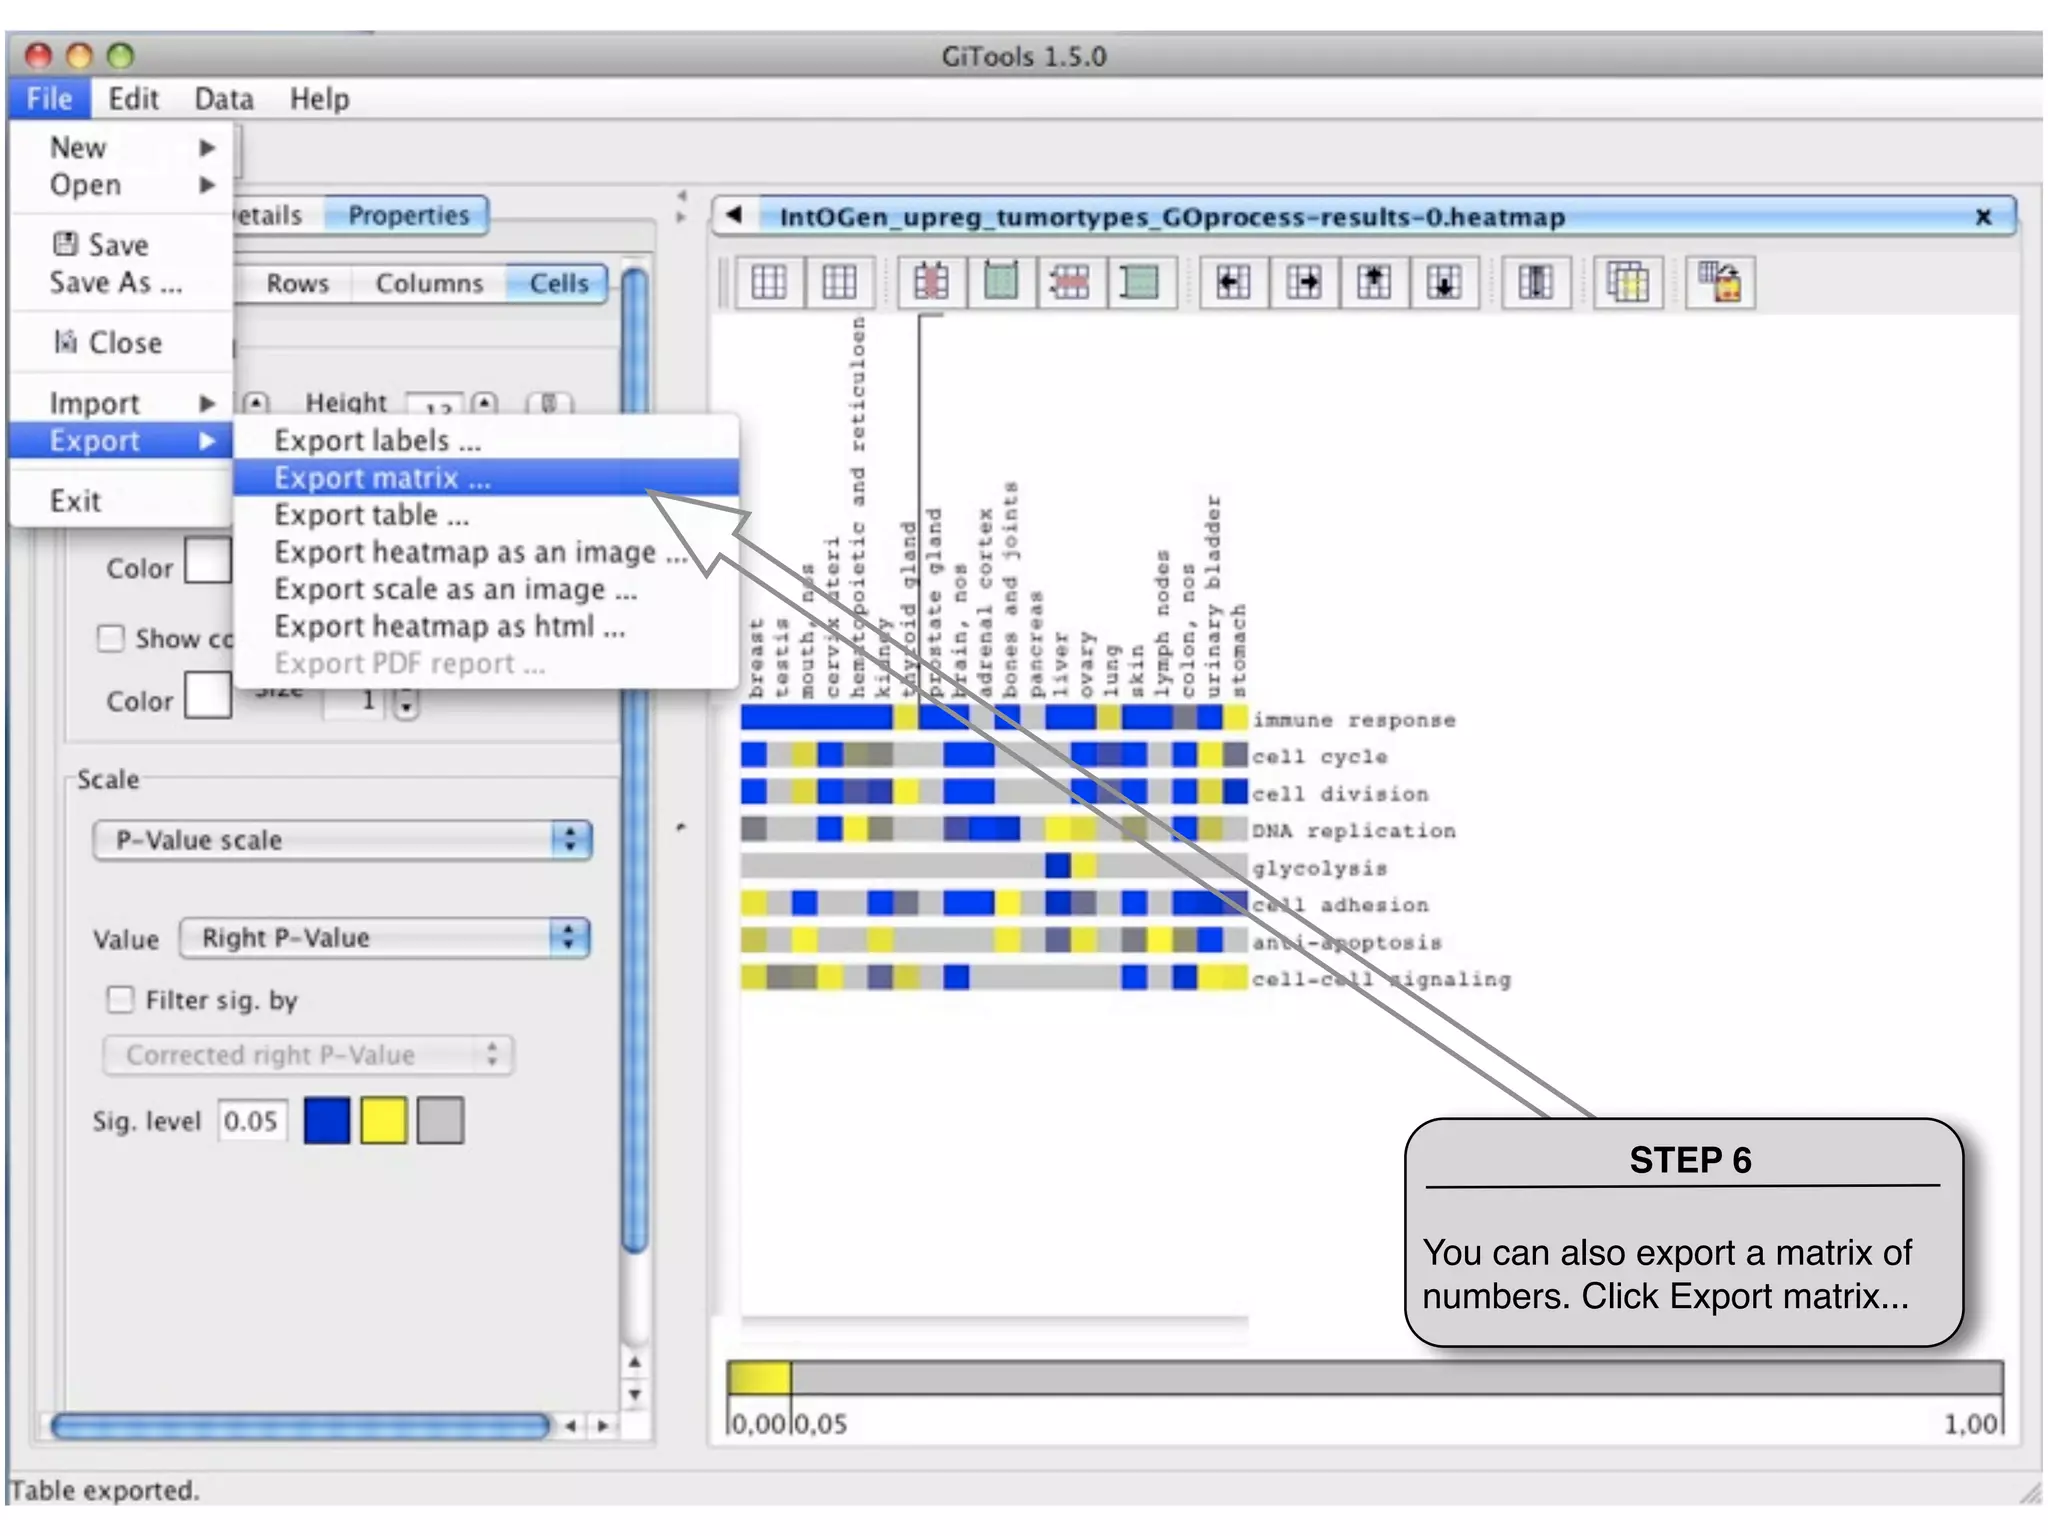
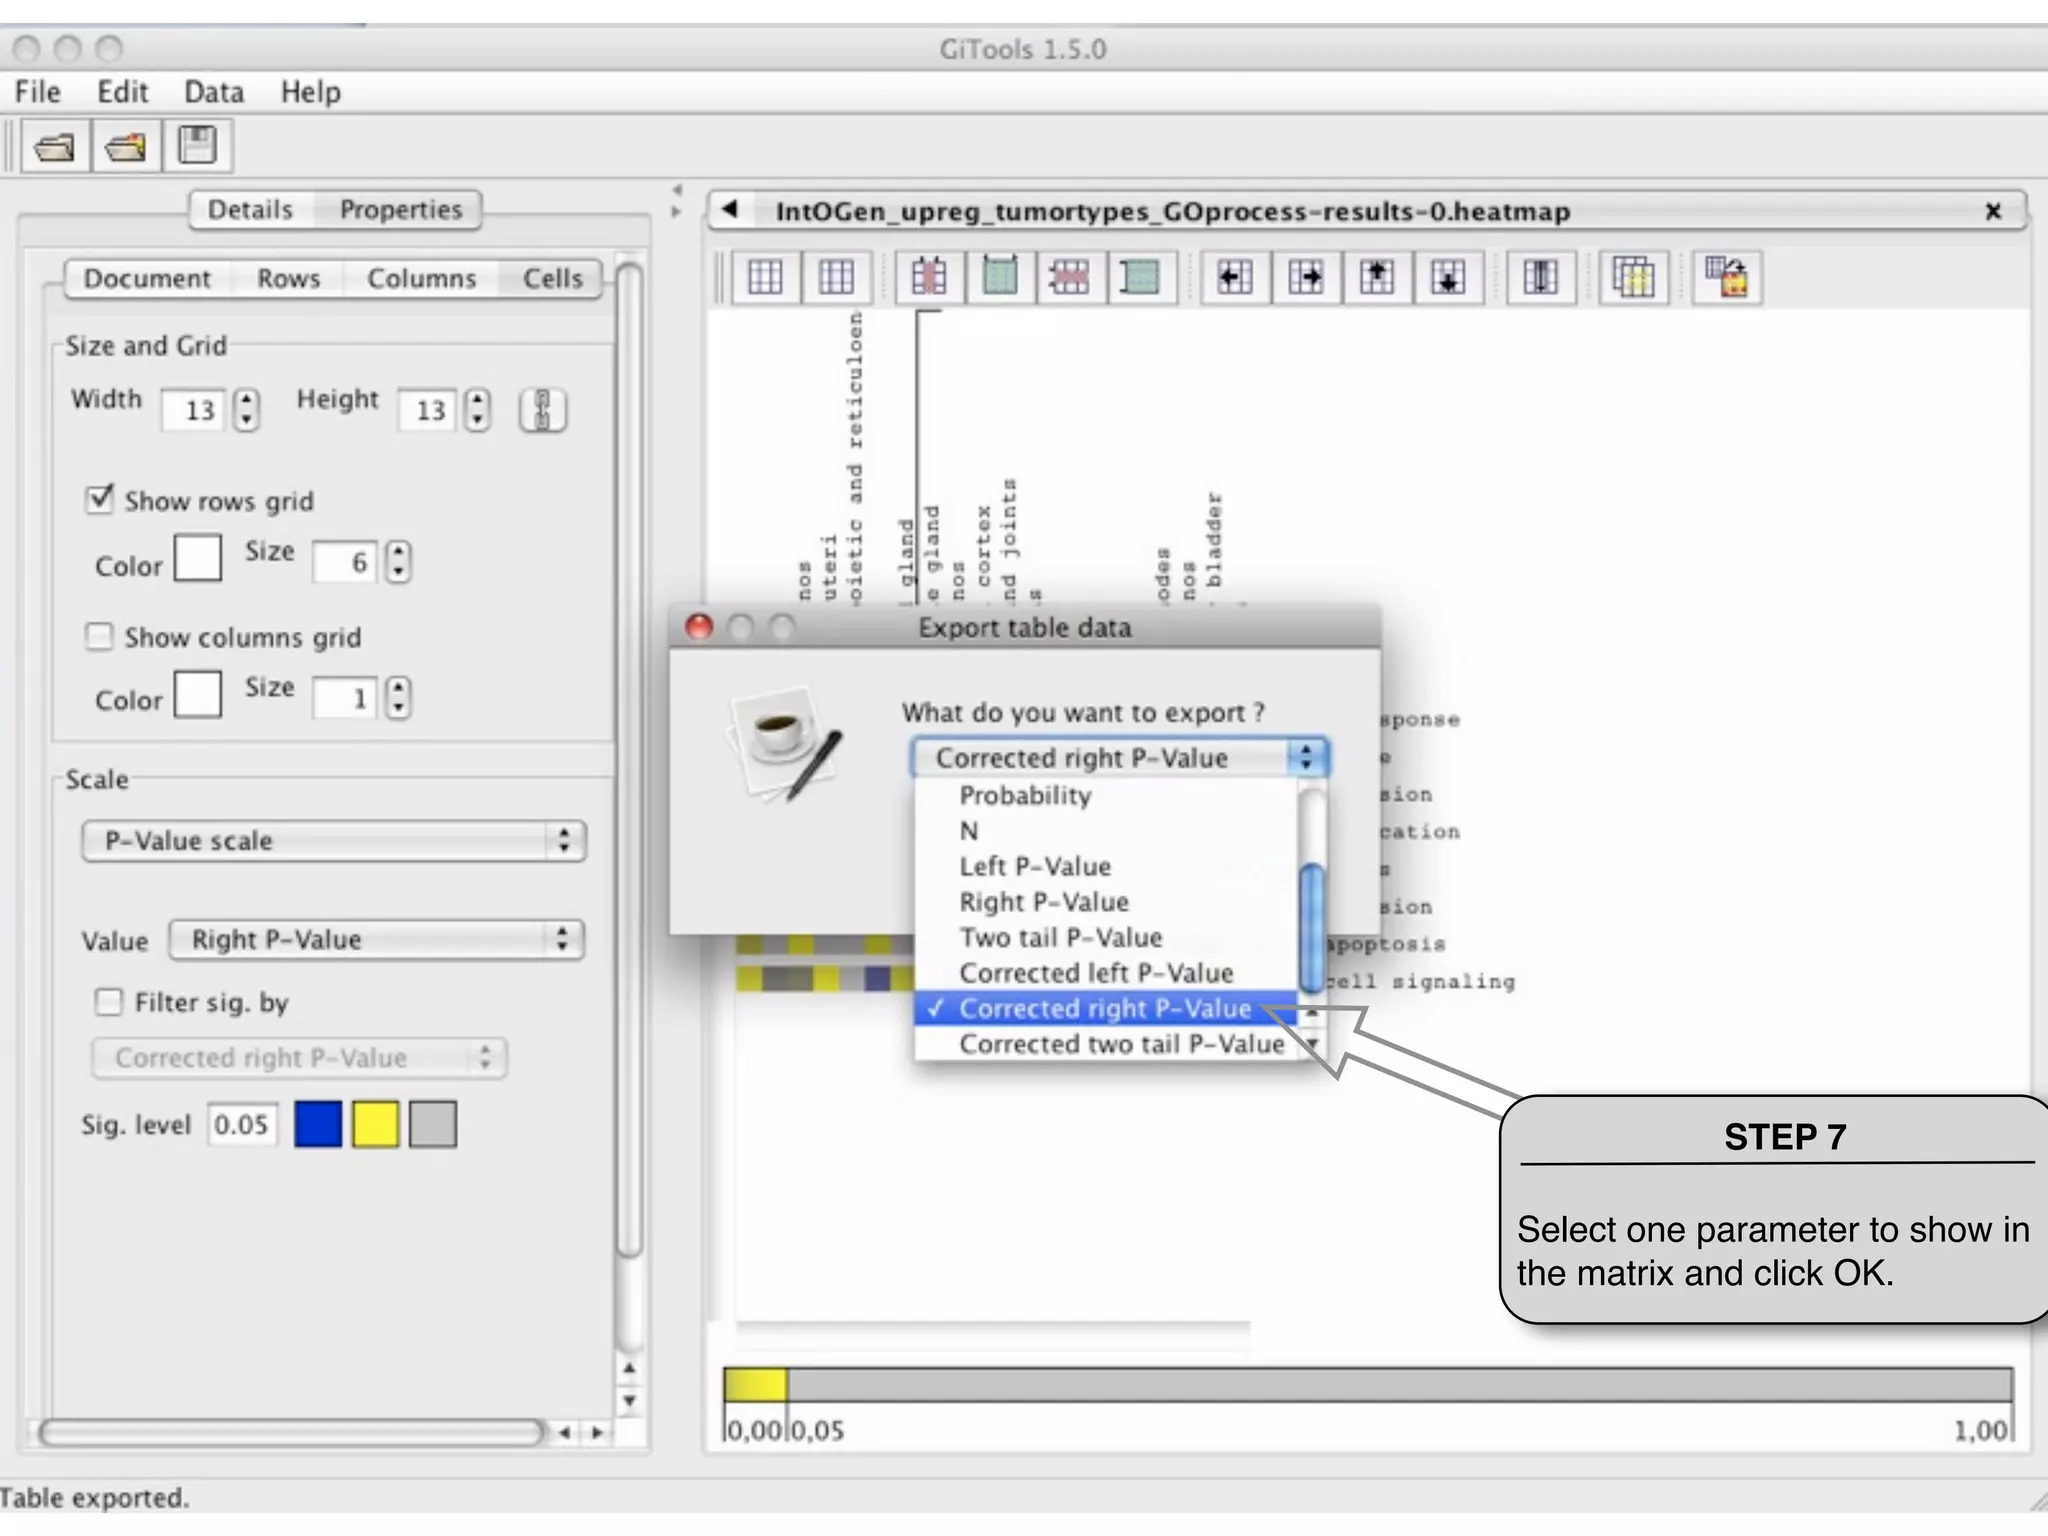
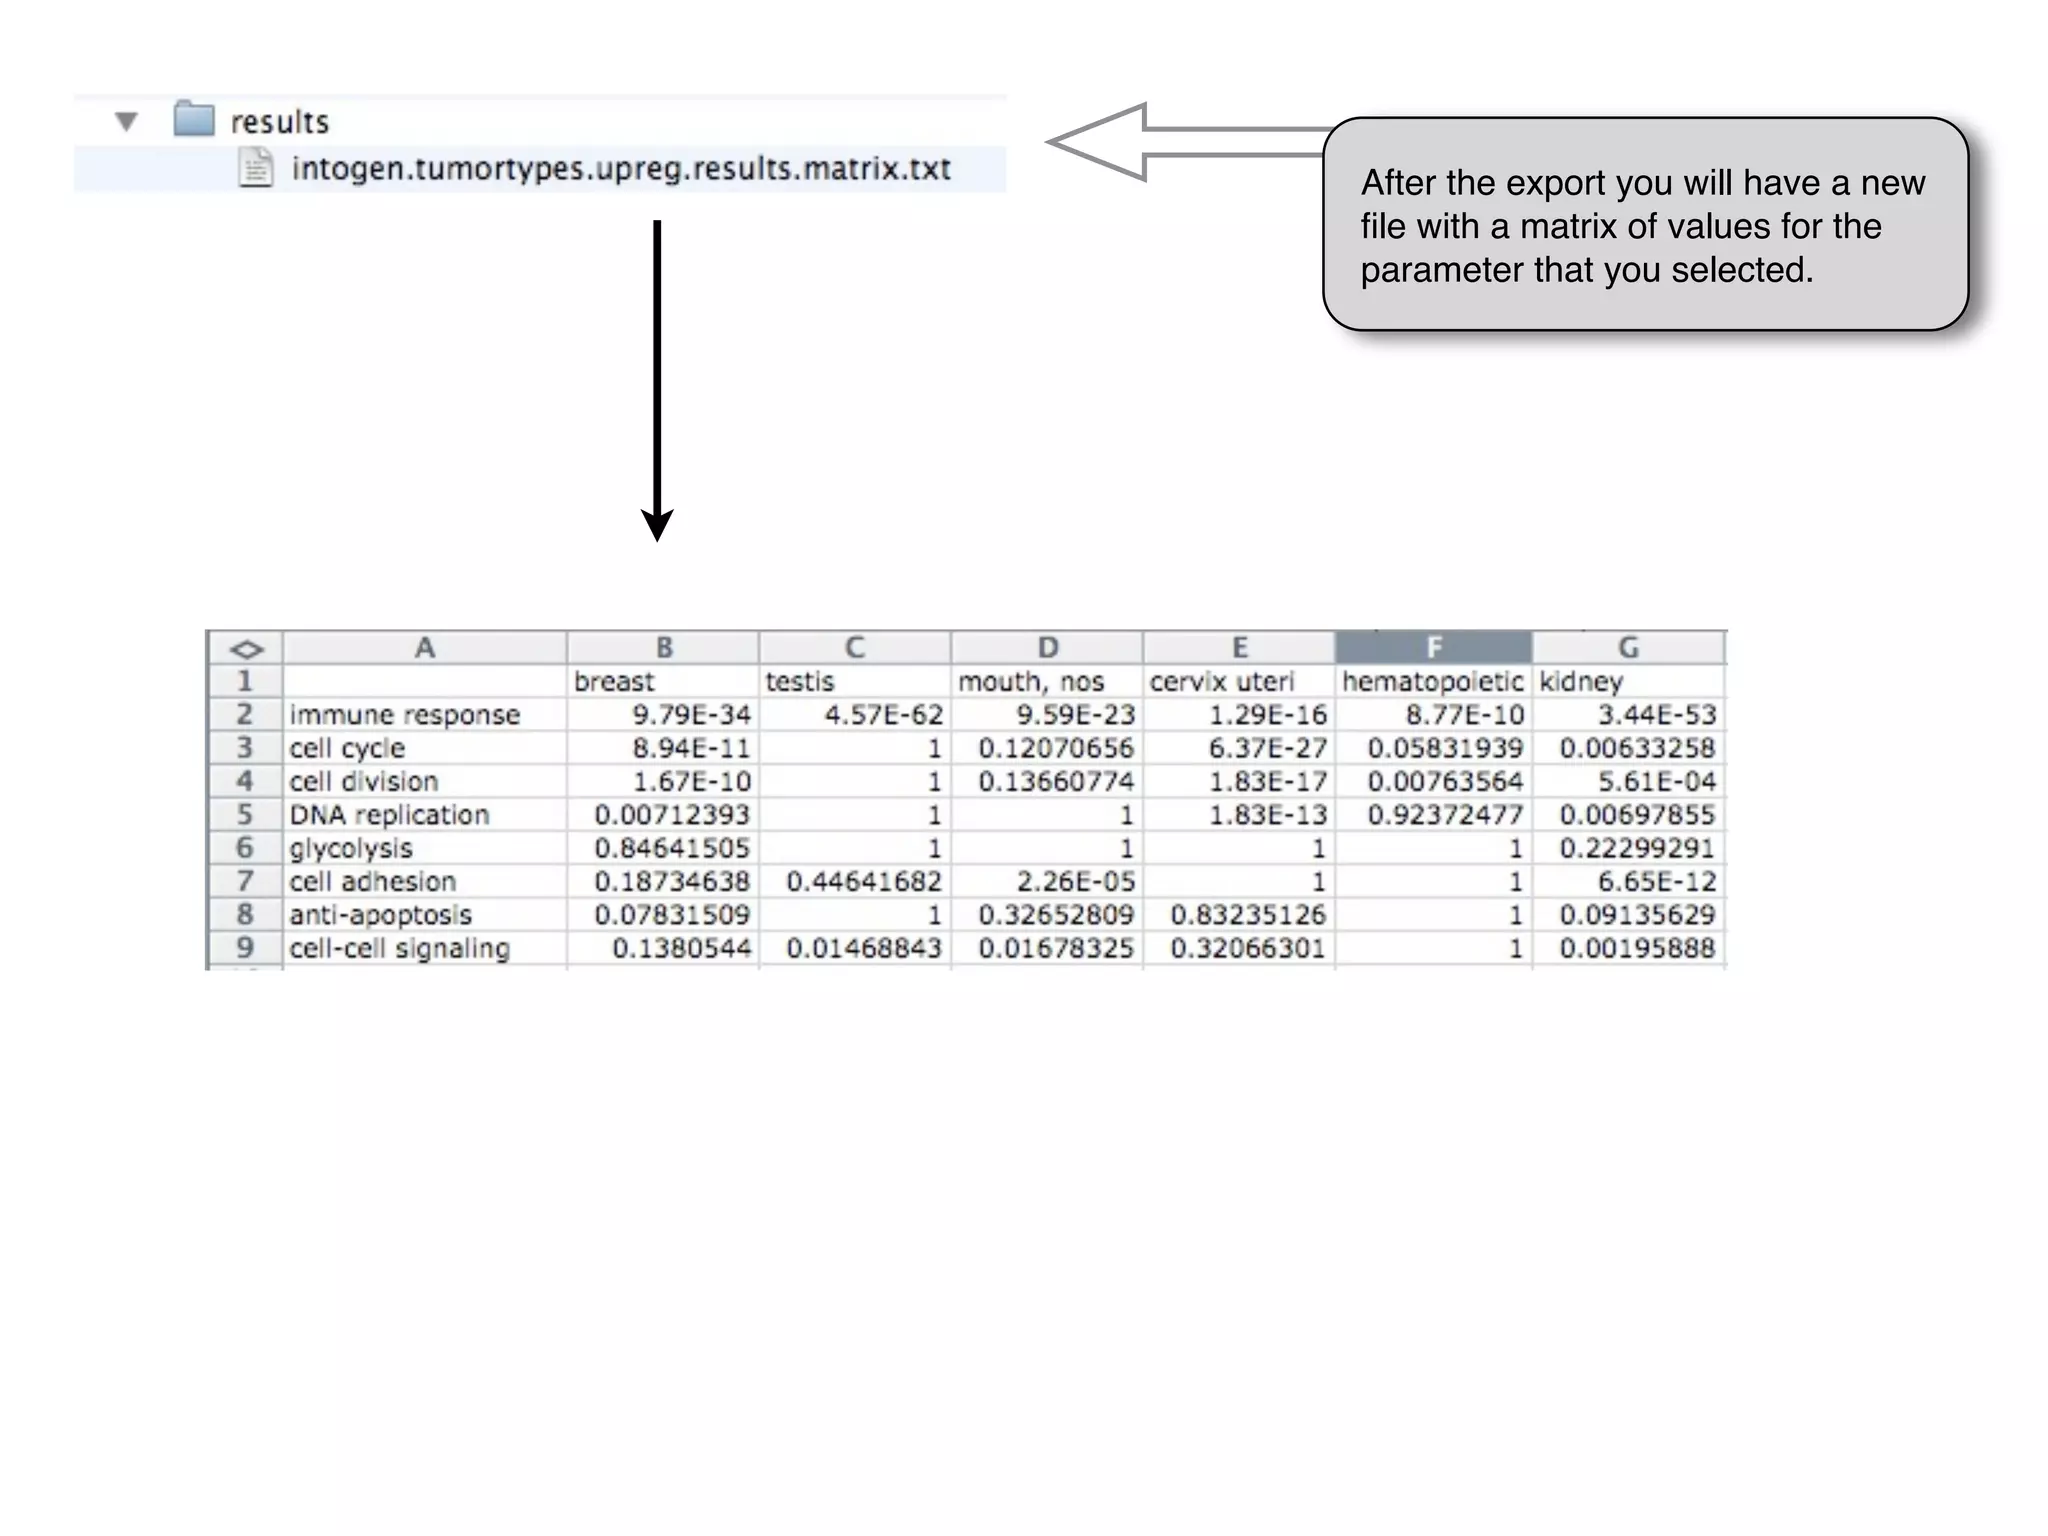
This document provides steps to export the results of an enrichment analysis as an image heatmap, table, or matrix from the Gitools analysis platform. It describes exporting the heatmap image in various formats, exporting a table with selected analysis parameters and their order, and exporting a matrix file with values for a selected parameter. The exports create new files that contain visualizations or data from the enrichment analysis for further use.
In ArcGIS, a data model describes the thematic layers used in the applications (for example, hamburger stands, roads, and counties); their spatial representation (for example, point, line, or polygon); their attributes; their integrity rules and relationships (for example, counties must nest within states).
Bambu Communication Group - full-service advertising agency that combines the skills of experienced professionals and efficient management.
Bambu Communication Group provide:
Integrated PR / ADV Campaign
Branding
Design
PR
ATL / Media
Marketing research
Copywriting
Branding and PR in the Internet
BTL / Event Management
7, Degtyarivska Str., Kyiv, 04050
Mob: +380 (96) 771-00-94
Tel/Fax: +380 (44) 287-88-42
E-mail: lada@petukhova.com
bambu.com.ua
petukhova.com
petukhova-pr.hiblogger.net
petukhova.vizitnica.net
InfoCision Chief of Staff Steve Brubaker shared this presentation about data analytics and business intelligence during a session at the 2010 ATA Convention & Expo
Presentation to the workflow track of ISoLA 2010, Crete. Includes explanation of the SADI plug-in to Taverna, and how the SHARE client automatically constructs and semantic web service workflow to answer specific sparql queries.
Encouraging Curriculum Change in the NetherlandsLuc Sluijsmans
In the contribution we will discuss the challenges of schools and teachers in taking up local curriculum development activities and the challenges of educational partners at various system levels (such as policy-makers, support agencies, test developers, textbook developers, pre- and in-service education, and inspectorate) to encourage schools and teachers to address curriculum change. Moreover, we will propose a mutual adaptation approach as the best fit. This approach would consist of public curriculum debates, attention to curriculum capacity building of teachers and school leaders, balanced curriculum autonomy and guidance, and balanced curriculum dynamics and stability, all of which will lead to common responsibility for curriculum change.
Evaluating Hypotheses using SPARQL-DL as an abstract workflow language to cho...Mark Wilkinson
Some of the recent work we've been doing with SADI and SHARE, using SHARE as a mechanism for dynamically converting OWL Classes into workflows in a data-dependent manner; OWL, in this case, is acting as an abstract workflow model. The slides in the middle are the usual SADI/SHARE explanation; the slides at the end show how we're using these dynamically generated workflows to "personalize" medical information on the Web for a particular patient's profile.
How SADI & SHARE help restore the Scientific Method to in silico scienceMark Wilkinson
This is my presentation to the Bio Open Source Convention (BOSC) in Boston, July 2010. I start with a brief status-update on the BioMoby project and then launch into a series of demonstrations of it's successor - SADI + SHARE. Rather than discussing how SADI/SHARE work, I focus the discussion on what role I think these technologies can play in bringing the traditional "scientific method" back into in silico biology.
The BioMoby Semantic Annotation ExperimentMark Wilkinson
My presentation to the Canadian Semantic Web Workshop, Kelowna BC, June 2009.
The slideshow describes a portion of Dr. Benjamin Good's PhD thesis work in which he examines the quality of annotation done through an open tagging process when the tags are constrained by a controlled vocabulary. The target for annotations were a set of BioMoby Semantic Web Services.
A Skills Approach Excel 2016 Chapter 8 Exploring Advanced D.docxdaniahendric
A Skills Approach: Excel 2016 Chapter 8: Exploring Advanced Data Analysis
1 | Page Skill Review 8.1 Last Updated 4/4/18
Skill Review 8.1
In this project, you will analyze sales data using consolidation, subtotals, outlines, conditional formatting,
advanced filters, PivotTables, and PivotCharts.
Skills needed to complete this project:
• Using Consolidate to Create Subtotals
• Sorting Data on Multiple Criteria
• Adding Subtotals
• Creating an Outline
• Creating New Conditional Formatting Rules
• Filtering and Sorting Using Cell Attributes
• Managing Conditional Formatting Rules
• Using Advanced Filter
• Refreshing Data in a PivotTable
• Adding a Calculated Field to a PivotTable
• Changing the Look of a PivotTable
• Filtering PivotTable Data
• Filtering Data in a PivotChart
• Changing the Look of a PivotChart
This image appears when a project instruction has changed to accommodate an update to
Microsoft Office 365. If the instruction does not match your version of Office, try using the alternate instruction
instead.
1. Open the start file EX2016-SkillReview-8-1. The file will be renamed automatically to include your name.
Change the project file name if directed to do so by your instructor, and save it.
2. If the workbook opens in Protected View, click the Enable Editing button in the Message Bar at the top
of the workbook so you can modify the workbook.
3. Use consolidate to create a summary of the sales data by region. The summary will be located on the
Analysis worksheet.
a. Go to the Analysis worksheet, and select cell A2.
b. On the Data tab, in the Data Tools group, click the Consolidate button.
c. Verify that Sum is selected in the Function box.
d. If there are any references in the All references box, click each and then click the [Delete] button to
remove them.
e. Click in the Reference box, and then click the Sales Data worksheet tab. Click and drag to select cells
C3:E67.
f. Click both the Top row and Left column check boxes.
g. Click OK.
h. On the Analysis worksheet, delete cells B2:B10, allowing the other cells to shift left.
Step 1
Download
start file
A Skills Approach: Excel 2016 Chapter 8: Exploring Advanced Data Analysis
2 | Page Skill Review 8.1 Last Updated 4/4/18
4. Sort the sales data alphabetically by region and then by last name.
a. Go to the Sales Data worksheet, and click any cell in the data set.
b. On the Data tab, in the Sort & Filter group, click the Sort button.
c. In the Sort dialog, expand the Sort by list, and select Region.
d. Click the Add Level button.
e. Expand the Then by list, and select Last Name.
f. Click OK.
5. Add subtotals to the data to calculate the total commission earned for each sales associate.
a. On the Data tab, in the Outline group, click the Subtotal button.
b. Expand the At each change in list, and select Last Name.
c. Verify that Sum is selected in the Use function box.
d. Verify th ...
Pictures are often used in presentations as they can convey a large amount of information more quickly than the written word. You can also give a more professional look to your presentation by adding a company logo. Also, you may want to use Impress to create a presentation consisting only of pictures, such as a slideshow of holiday snapshots to share with friends.
Inserting Pictures.
Creating lines and shapes.
Working with 3D objects.
Formatting objects and lines.
Working with graphics styles.
From this power point you can get the details about Advanced Filter, Use of Macros with Advanced Filter, Data Validation, Creation of data validation Drop-Down List, Handling of External Data, Goal Seek, What-if analysis,
Working with Tables in MS Word Presentation.pdfFaiyazAhmad88
Working with tables in Microsoft Word allows you to organize and present information in a structured format. Whether you're creating a report, a resume, or a newsletter, tables can help you effectively display data. Here's how to work with tables in MS Word:
Inserting a Table:
Click on the "Insert" tab in the ribbon.
Click on the "Table" button.
Choose the number of rows and columns for your table by hovering over the grid until you reach the desired size, then click to insert.
Formatting Tables:
Click inside the table to activate the "Table Tools" contextual tab in the ribbon.
Use options like "Design" and "Layout" to change the appearance and structure of the table.
You can adjust properties like borders, shading, and alignment to make the table visually appealing.
Entering Data:
Click inside any cell of the table to start entering data.
You can type directly into the cells or paste content from other sources.
Resizing and Adjusting Columns and Rows:
Hover over the border of a column or row until the cursor changes to a double-sided arrow.
Click and drag to resize the column or row.
To adjust the width of all columns evenly, select the entire table, then click and drag the column borders.
Merging and Splitting Cells:
To merge cells, select the cells you want to merge, then right-click and choose "Merge Cells" from the context menu.
To split a merged cell, click inside it, then go to the "Layout" tab, click "Merge Cells," and select "Split Cells" from the dropdown.
Sorting Data:
Click inside the table.
Go to the "Layout" tab in the ribbon.
Click on the "Sort" button.
Choose the sorting options (e.g., sort by column, ascending or descending order).
Adding or Deleting Rows and Columns:
Right-click on a row or column.
Choose "Insert" or "Delete" from the context menu to add or remove rows or columns as needed.
Moving a Table:
Click on the table to select it.
Hover the mouse over the table border until the pointer changes to a four-headed arrow.
Click and drag the table to move it to a new location within the document.
Working with tables in Microsoft Word provides a flexible way to organize and present data, enhancing the visual appeal and readability of your documents.
Collect 50 or more paired quantitative data items. You may use a met.pdfivylinvaydak64229
Collect 50 or more paired quantitative data items. You may use a method similar to the Module 1
discussion to collect and enter data into StatCrunch. You will enter the explanatory variable (x-
value) in column var1. Then, enter the response variable (y-value) in column var2.
a.) Using StatCrunch, compute the sample linear correlation coefficient, R. The Technology
Step-by-Step box at the end of Section 4.1 (page 194) explains how to do so. Do not forget the
video explanation in the Module Notes, if you need it.
b.) Using StatCrunch, find the least-squares regression line equation and plot the scatter diagram,
along with the line. Page 207 (Technology Step-by-Step box) explains how to determine such a
linear equation using StatCrunch. Please note: In order to plot the scatter diagram along with the
line, before clicking Calculate in step 3 of page 207, scroll down to Graphs and make sure Fitted
line plot is selected. Then click Calculate. Then click the right-arrow at the very bottom right
hand side of the results page for the scatter diagram and regression line plot. For an example of
the steps taken and what to expect, click here.
c.) Paste your scatter diagram (with the regression line drawn) and StatCrunch results in the
discussion (by clicking on Options and then Copy. Use Ctrl V to paste it into the discussions).
Try not to use the same data set that another student in the class has used, so your results will be
unique. Make sure your data set is large enough (50 items).
d.) Then, answer the following two questions:
What type of correlation do you observe between the two variables? For ideas, see Figure 4 on
page 181 (Section 4.1).
Would you recommend using this linear model to make predictions about the y-value for a given
x-value? Why or why not?
Solution
Technology Step-by-Step Using StatCrunch:
------------------------------------------------------
Section 1.3 Simple Random Sampling
...........................................................
1. Select Data, highlight Simulate Data, then highlight
Discrete Uniform.
2. Fill in the following window with the appropriate
values. To obtain a simple random sample for the
situation in Example 2, we would enter the values
shown in the figure. The reason we generate 10 rows
of data (instead of 5) is in case any of the random
numbers repeat. Select Simulate, and the random
numbers will appear in the spreadsheet. Note: You
could also select the single dynamic seed radio
button, if you like, to set the seed.
Section 2.1 Drawing Bar Graphs and Pie Charts
Frequency or Relative Frequency Distributions from Raw Data
.....................................................................................................
1. Enter the raw data into the spreadsheet. Name the column variable.
2. Select Stat, highlight Tables, and select Frequency.
3. Click on the variable you wish to summarize and click Calculate.
Bar Graphs from Summarized Data
...............................................................
This utility helps in compiling data from any format of Excel to your desired format of Excel.
One can manage data from scattered sheets from varied clients in varied formats to one standard template meant for specific purpose that includes templates for Excel Formats for Filing to GSTN and so on etc.
Encryption in Microsoft 365 - ExpertsLive Netherlands 2024Albert Hoitingh
In this session I delve into the encryption technology used in Microsoft 365 and Microsoft Purview. Including the concepts of Customer Key and Double Key Encryption.
Transcript: Selling digital books in 2024: Insights from industry leaders - T...BookNet Canada
The publishing industry has been selling digital audiobooks and ebooks for over a decade and has found its groove. What’s changed? What has stayed the same? Where do we go from here? Join a group of leading sales peers from across the industry for a conversation about the lessons learned since the popularization of digital books, best practices, digital book supply chain management, and more.
Link to video recording: https://bnctechforum.ca/sessions/selling-digital-books-in-2024-insights-from-industry-leaders/
Presented by BookNet Canada on May 28, 2024, with support from the Department of Canadian Heritage.
Generating a custom Ruby SDK for your web service or Rails API using Smithyg2nightmarescribd
Have you ever wanted a Ruby client API to communicate with your web service? Smithy is a protocol-agnostic language for defining services and SDKs. Smithy Ruby is an implementation of Smithy that generates a Ruby SDK using a Smithy model. In this talk, we will explore Smithy and Smithy Ruby to learn how to generate custom feature-rich SDKs that can communicate with any web service, such as a Rails JSON API.
UiPath Test Automation using UiPath Test Suite series, part 3DianaGray10
Welcome to UiPath Test Automation using UiPath Test Suite series part 3. In this session, we will cover desktop automation along with UI automation.
Topics covered:
UI automation Introduction,
UI automation Sample
Desktop automation flow
Pradeep Chinnala, Senior Consultant Automation Developer @WonderBotz and UiPath MVP
Deepak Rai, Automation Practice Lead, Boundaryless Group and UiPath MVP
Builder.ai Founder Sachin Dev Duggal's Strategic Approach to Create an Innova...Ramesh Iyer
In today's fast-changing business world, Companies that adapt and embrace new ideas often need help to keep up with the competition. However, fostering a culture of innovation takes much work. It takes vision, leadership and willingness to take risks in the right proportion. Sachin Dev Duggal, co-founder of Builder.ai, has perfected the art of this balance, creating a company culture where creativity and growth are nurtured at each stage.
Neuro-symbolic is not enough, we need neuro-*semantic*Frank van Harmelen
Neuro-symbolic (NeSy) AI is on the rise. However, simply machine learning on just any symbolic structure is not sufficient to really harvest the gains of NeSy. These will only be gained when the symbolic structures have an actual semantics. I give an operational definition of semantics as “predictable inference”.
All of this illustrated with link prediction over knowledge graphs, but the argument is general.
Smart TV Buyer Insights Survey 2024 by 91mobiles.pdf91mobiles
91mobiles recently conducted a Smart TV Buyer Insights Survey in which we asked over 3,000 respondents about the TV they own, aspects they look at on a new TV, and their TV buying preferences.
State of ICS and IoT Cyber Threat Landscape Report 2024 previewPrayukth K V
The IoT and OT threat landscape report has been prepared by the Threat Research Team at Sectrio using data from Sectrio, cyber threat intelligence farming facilities spread across over 85 cities around the world. In addition, Sectrio also runs AI-based advanced threat and payload engagement facilities that serve as sinks to attract and engage sophisticated threat actors, and newer malware including new variants and latent threats that are at an earlier stage of development.
The latest edition of the OT/ICS and IoT security Threat Landscape Report 2024 also covers:
State of global ICS asset and network exposure
Sectoral targets and attacks as well as the cost of ransom
Global APT activity, AI usage, actor and tactic profiles, and implications
Rise in volumes of AI-powered cyberattacks
Major cyber events in 2024
Malware and malicious payload trends
Cyberattack types and targets
Vulnerability exploit attempts on CVEs
Attacks on counties – USA
Expansion of bot farms – how, where, and why
In-depth analysis of the cyber threat landscape across North America, South America, Europe, APAC, and the Middle East
Why are attacks on smart factories rising?
Cyber risk predictions
Axis of attacks – Europe
Systemic attacks in the Middle East
Download the full report from here:
https://sectrio.com/resources/ot-threat-landscape-reports/sectrio-releases-ot-ics-and-iot-security-threat-landscape-report-2024/
Slack (or Teams) Automation for Bonterra Impact Management (fka Social Soluti...Jeffrey Haguewood
Sidekick Solutions uses Bonterra Impact Management (fka Social Solutions Apricot) and automation solutions to integrate data for business workflows.
We believe integration and automation are essential to user experience and the promise of efficient work through technology. Automation is the critical ingredient to realizing that full vision. We develop integration products and services for Bonterra Case Management software to support the deployment of automations for a variety of use cases.
This video focuses on the notifications, alerts, and approval requests using Slack for Bonterra Impact Management. The solutions covered in this webinar can also be deployed for Microsoft Teams.
Interested in deploying notification automations for Bonterra Impact Management? Contact us at sales@sidekicksolutionsllc.com to discuss next steps.
DevOps and Testing slides at DASA ConnectKari Kakkonen
My and Rik Marselis slides at 30.5.2024 DASA Connect conference. We discuss about what is testing, then what is agile testing and finally what is Testing in DevOps. Finally we had lovely workshop with the participants trying to find out different ways to think about quality and testing in different parts of the DevOps infinity loop.
GraphRAG is All You need? LLM & Knowledge GraphGuy Korland
Guy Korland, CEO and Co-founder of FalkorDB, will review two articles on the integration of language models with knowledge graphs.
1. Unifying Large Language Models and Knowledge Graphs: A Roadmap.
https://arxiv.org/abs/2306.08302
2. Microsoft Research's GraphRAG paper and a review paper on various uses of knowledge graphs:
https://www.microsoft.com/en-us/research/blog/graphrag-unlocking-llm-discovery-on-narrative-private-data/
Tutorial 1.6 - Export heatmap image and table results
1. Tutorial 1.6: Export heatmap image and table results
Export the results of the enrichment analysis as an image and as a table containing
the details of the statistic results