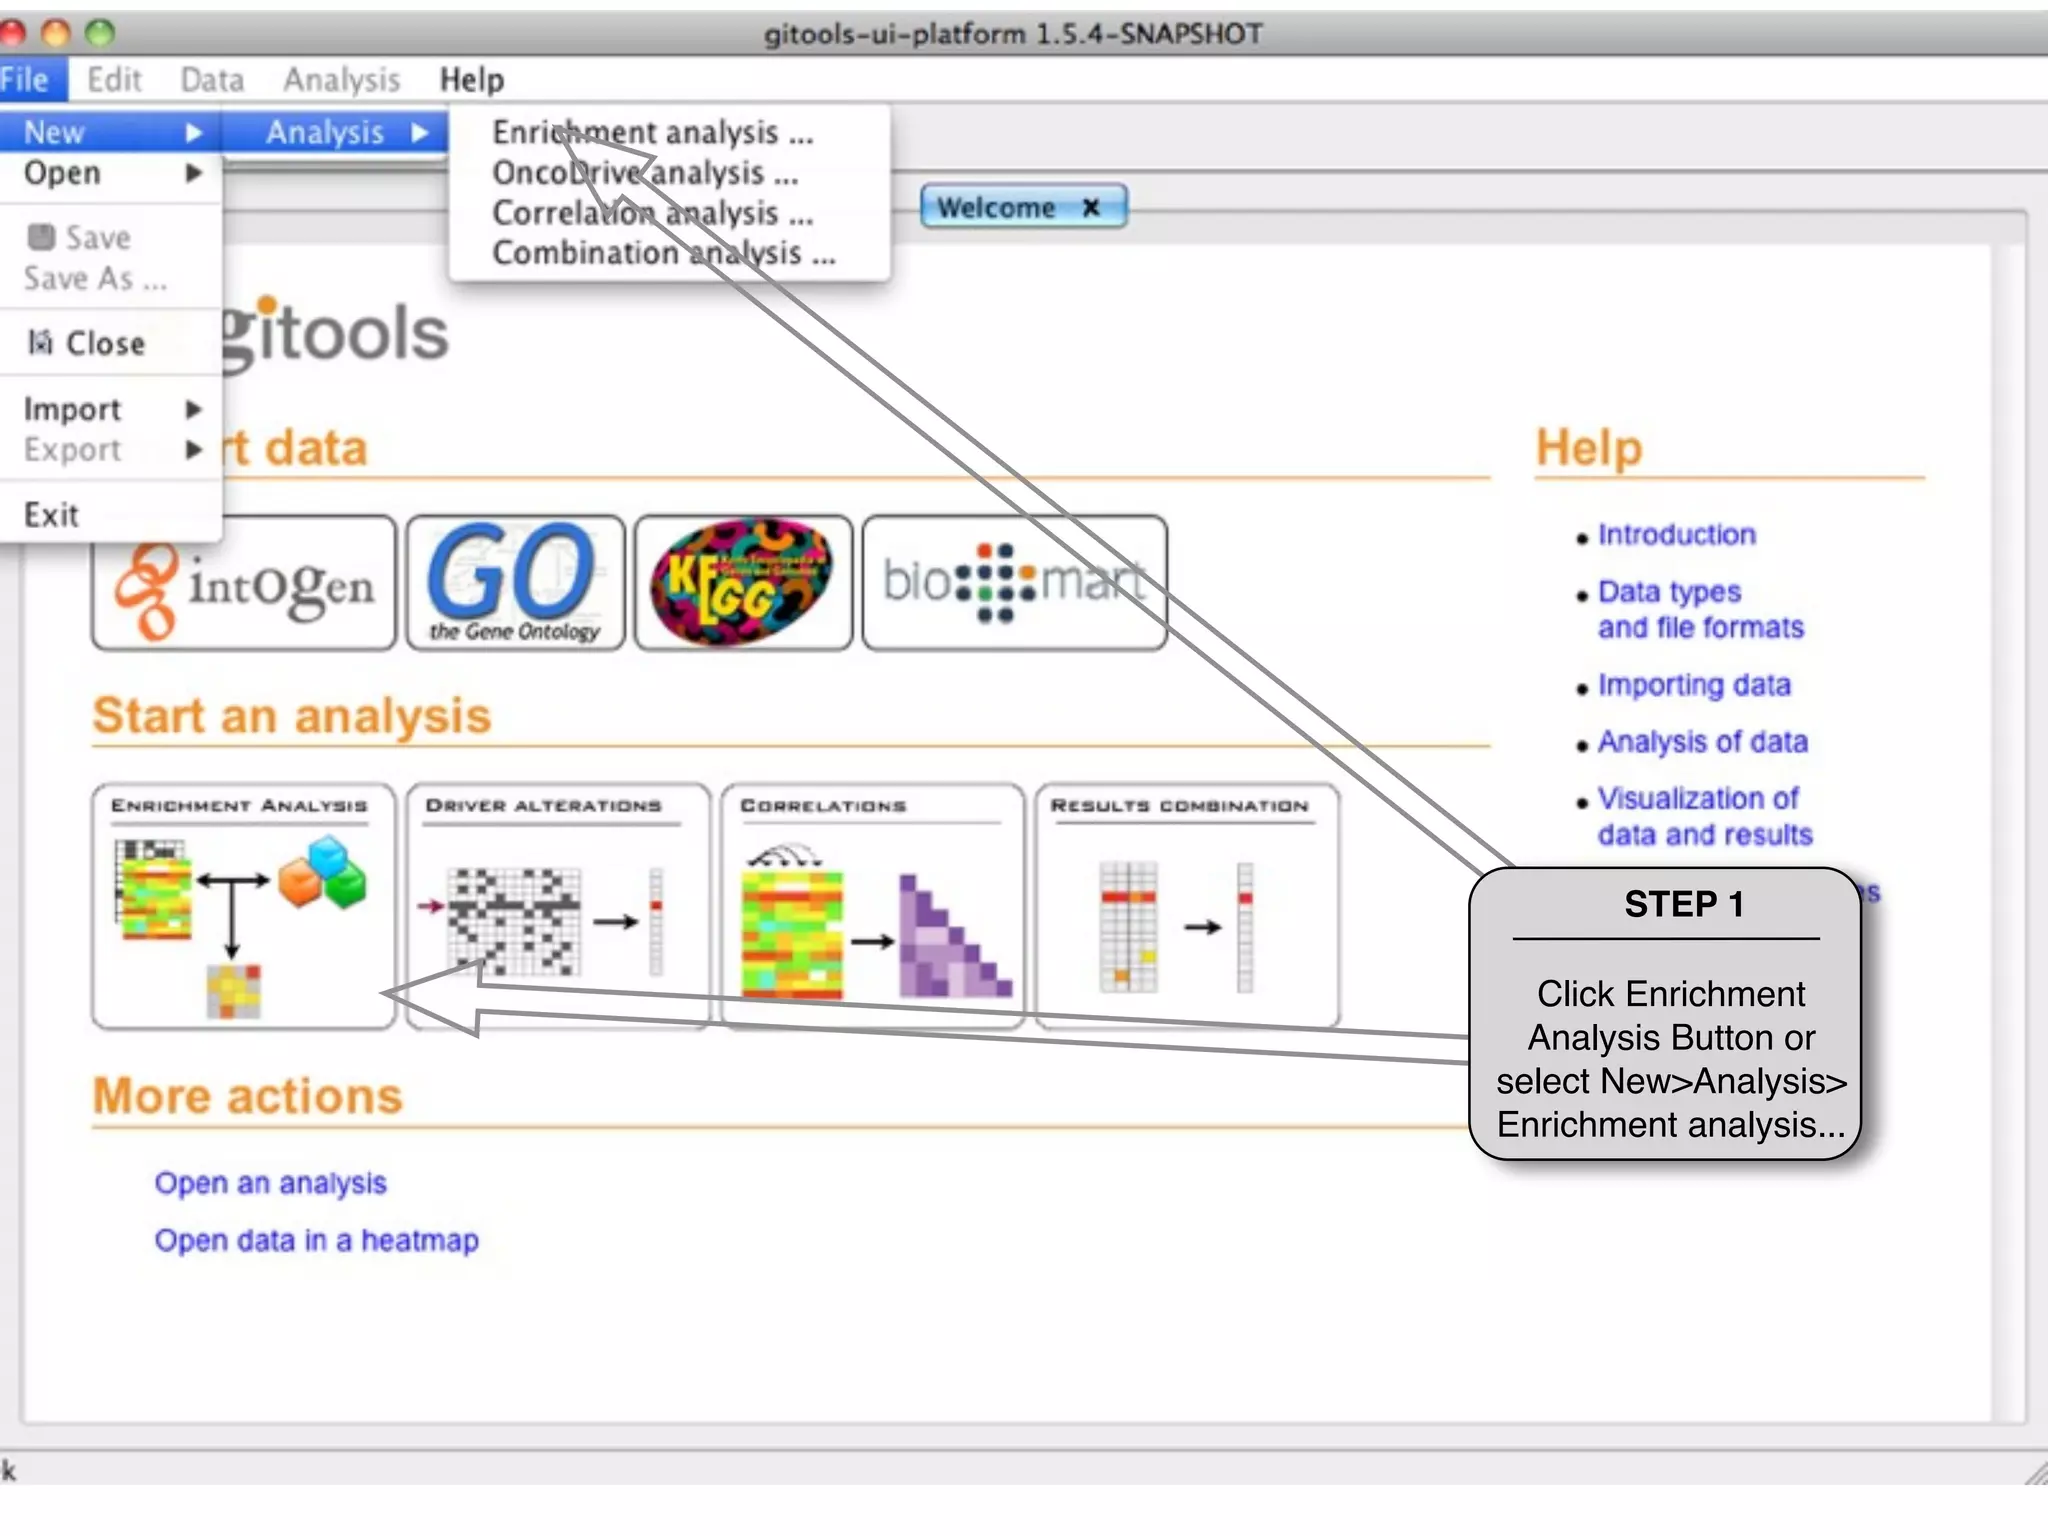
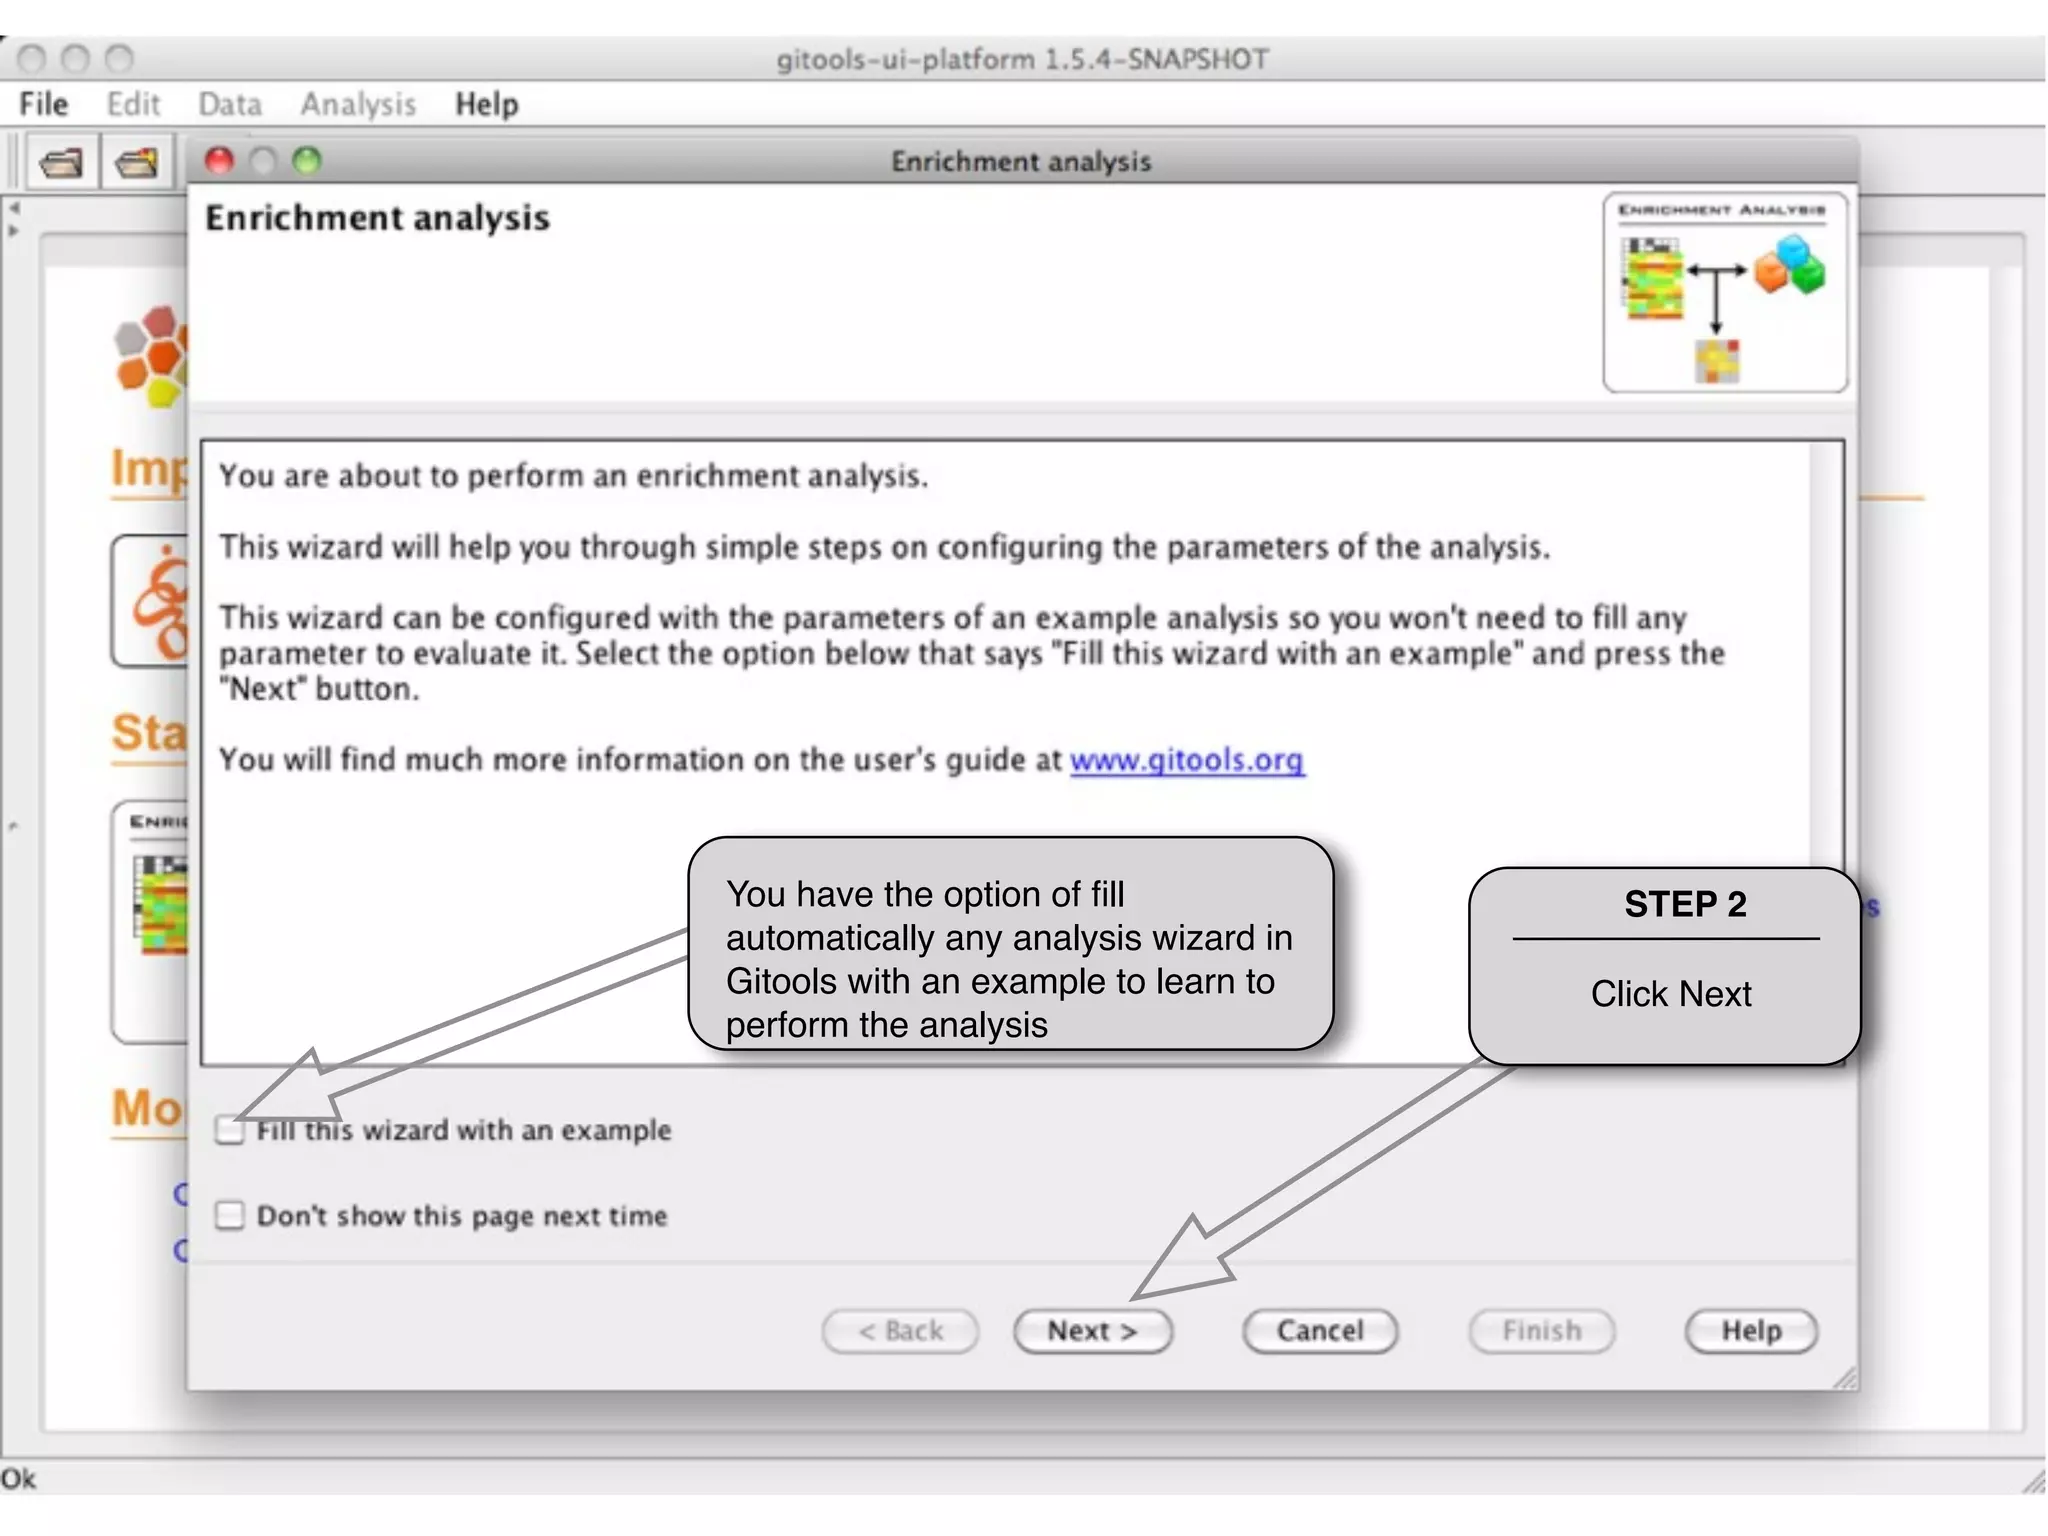
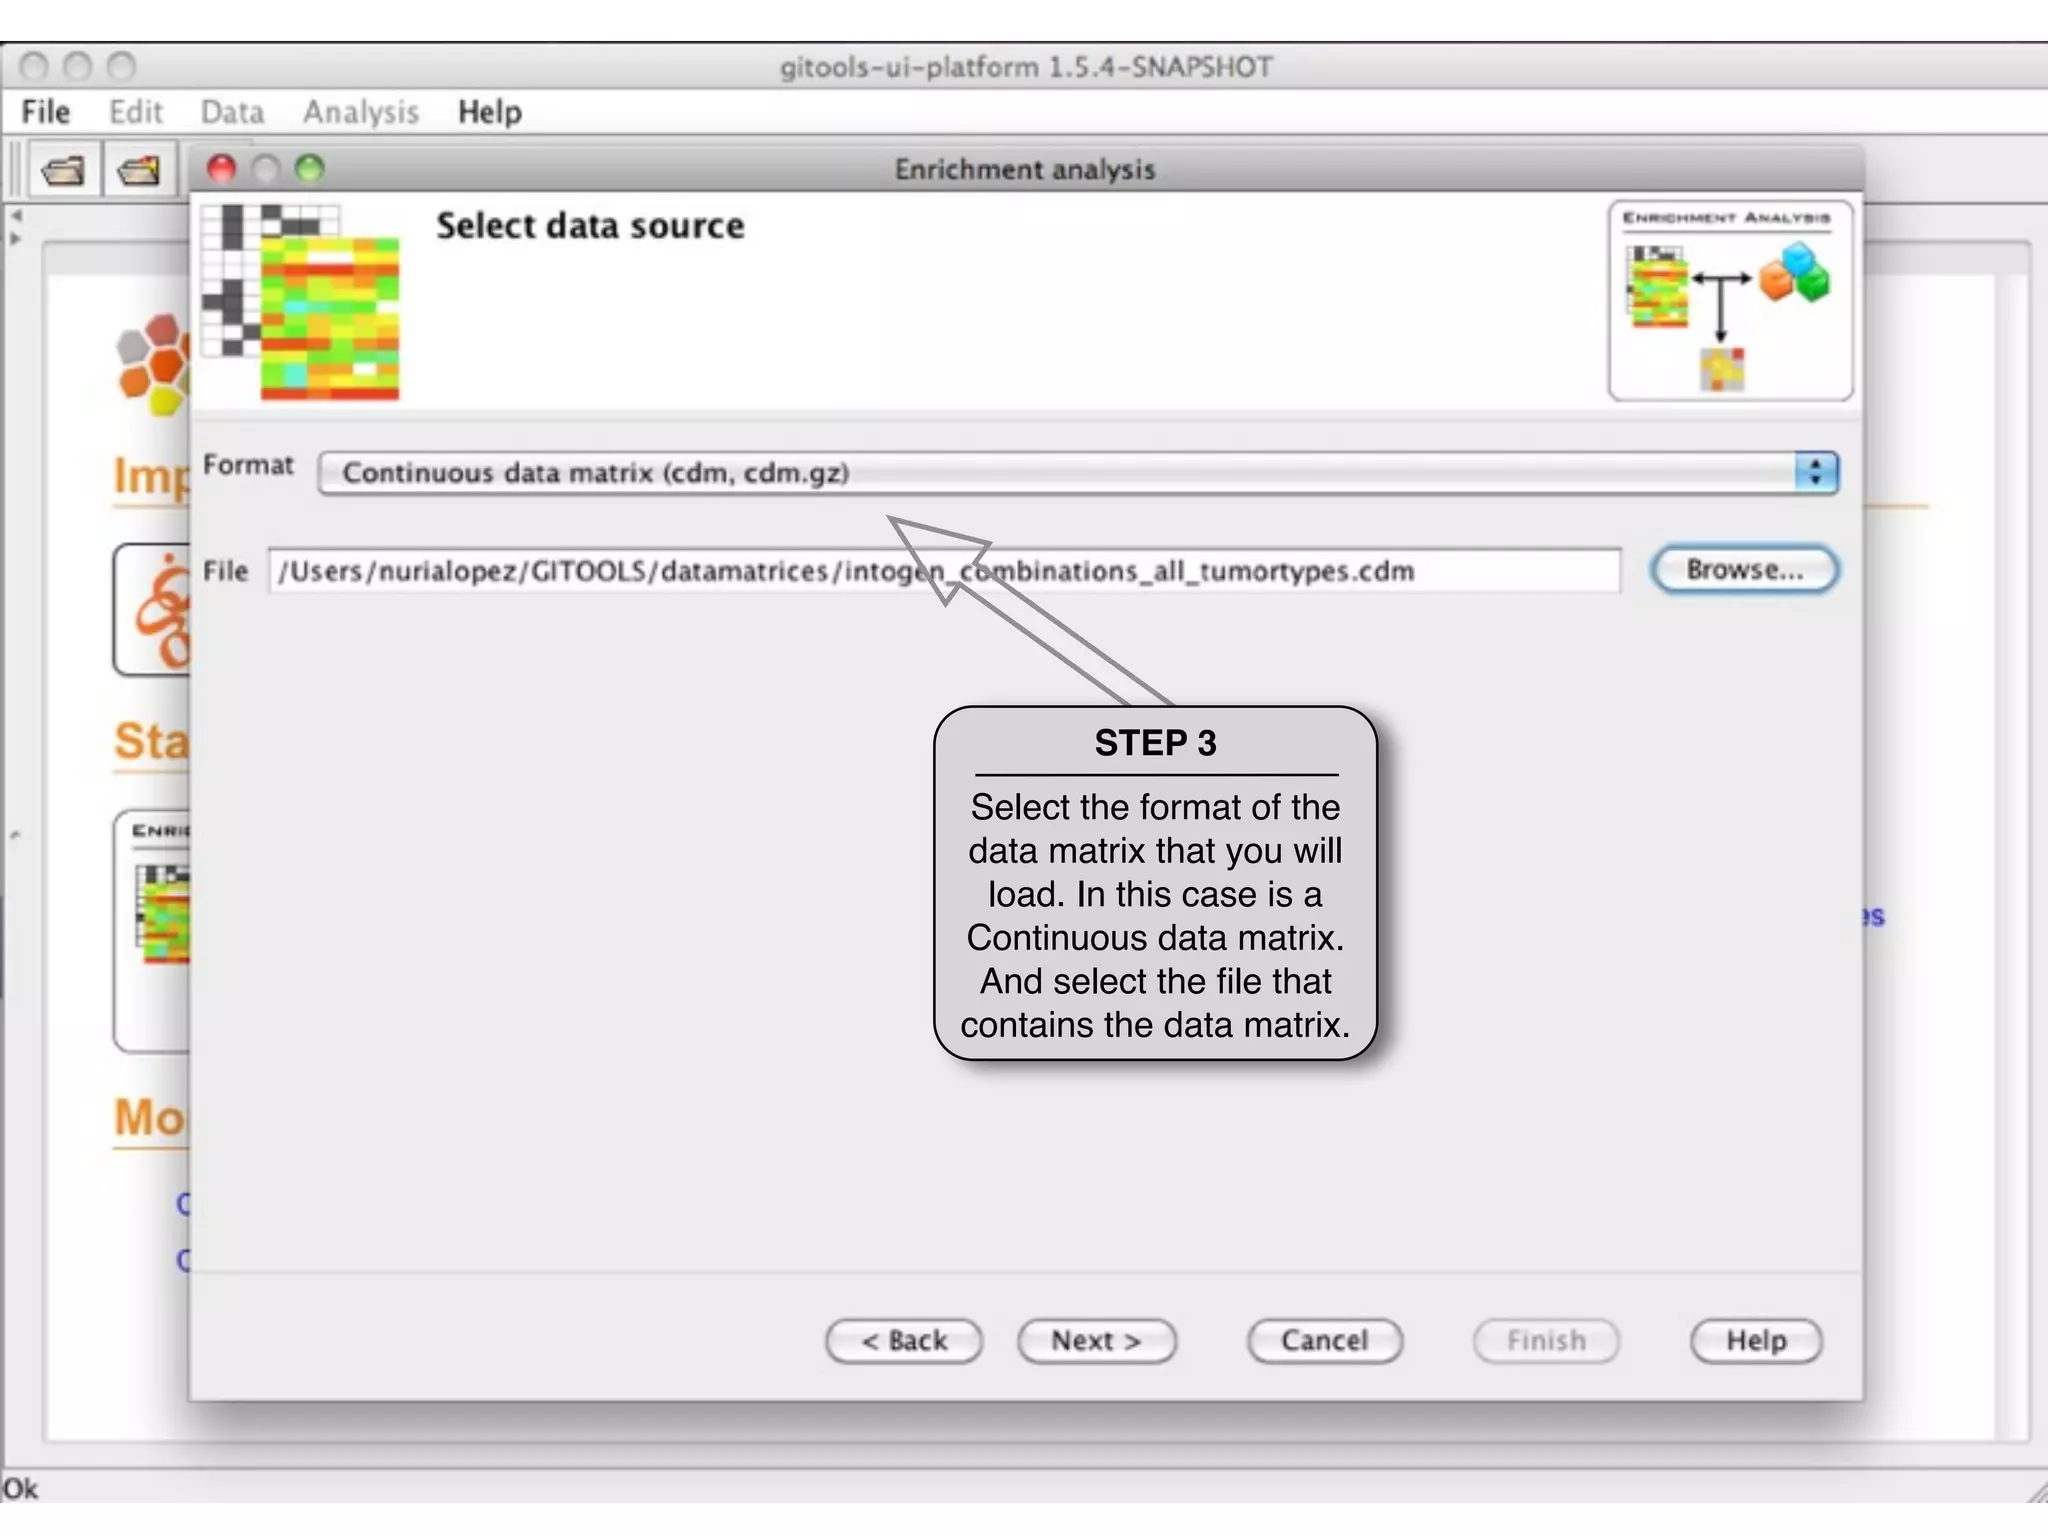
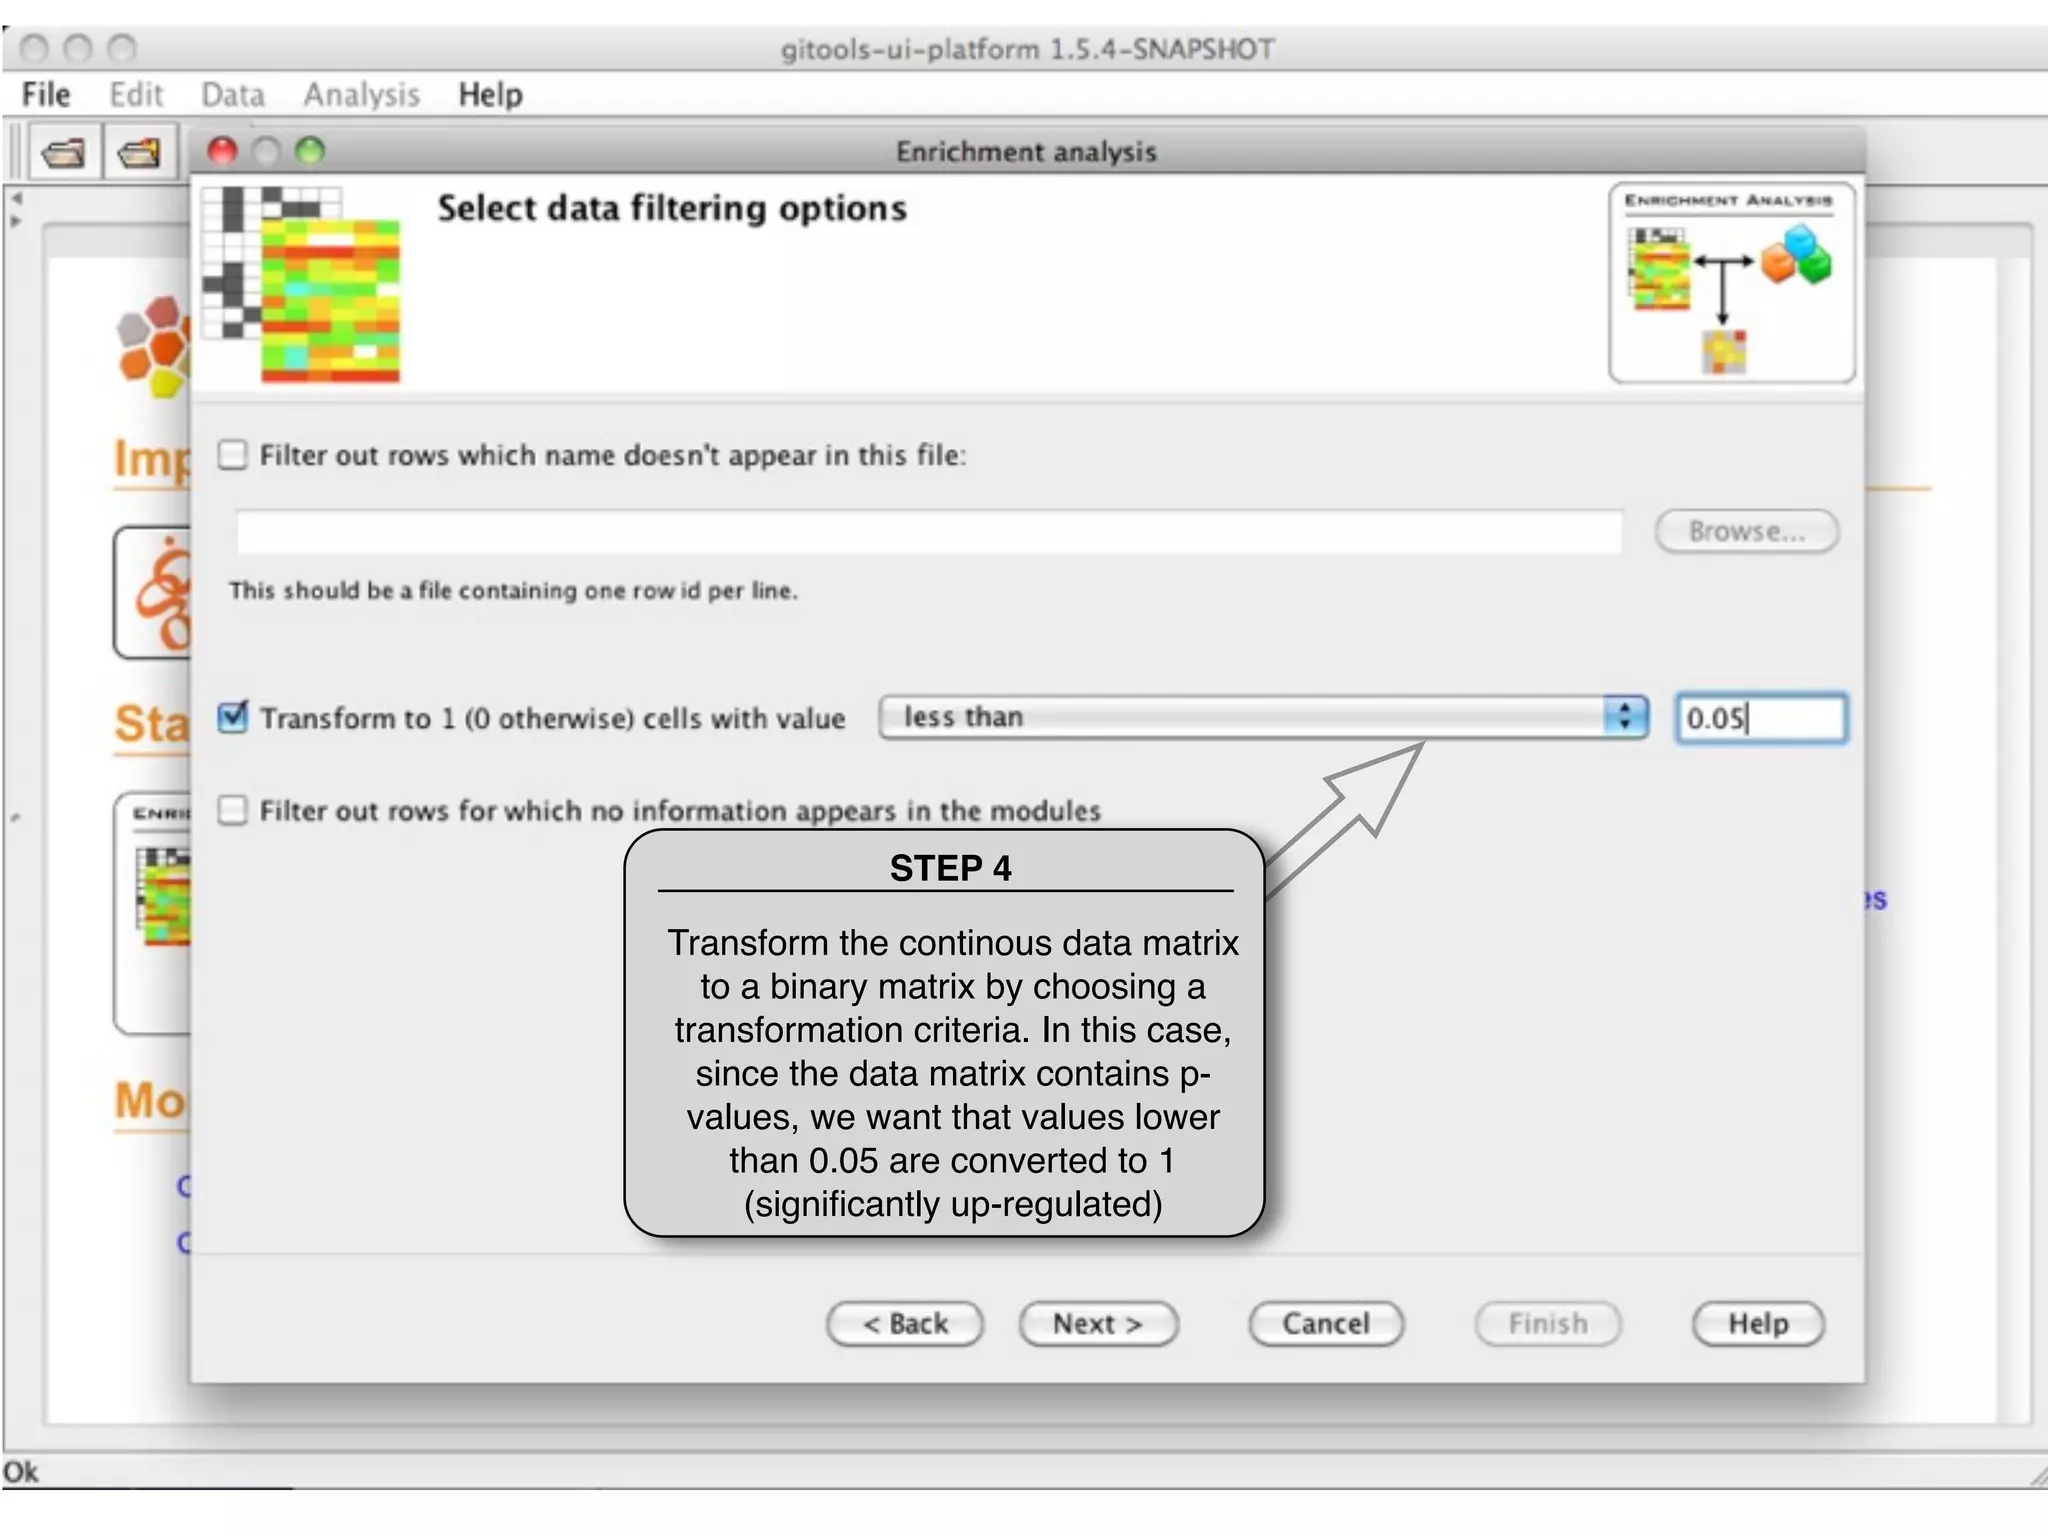
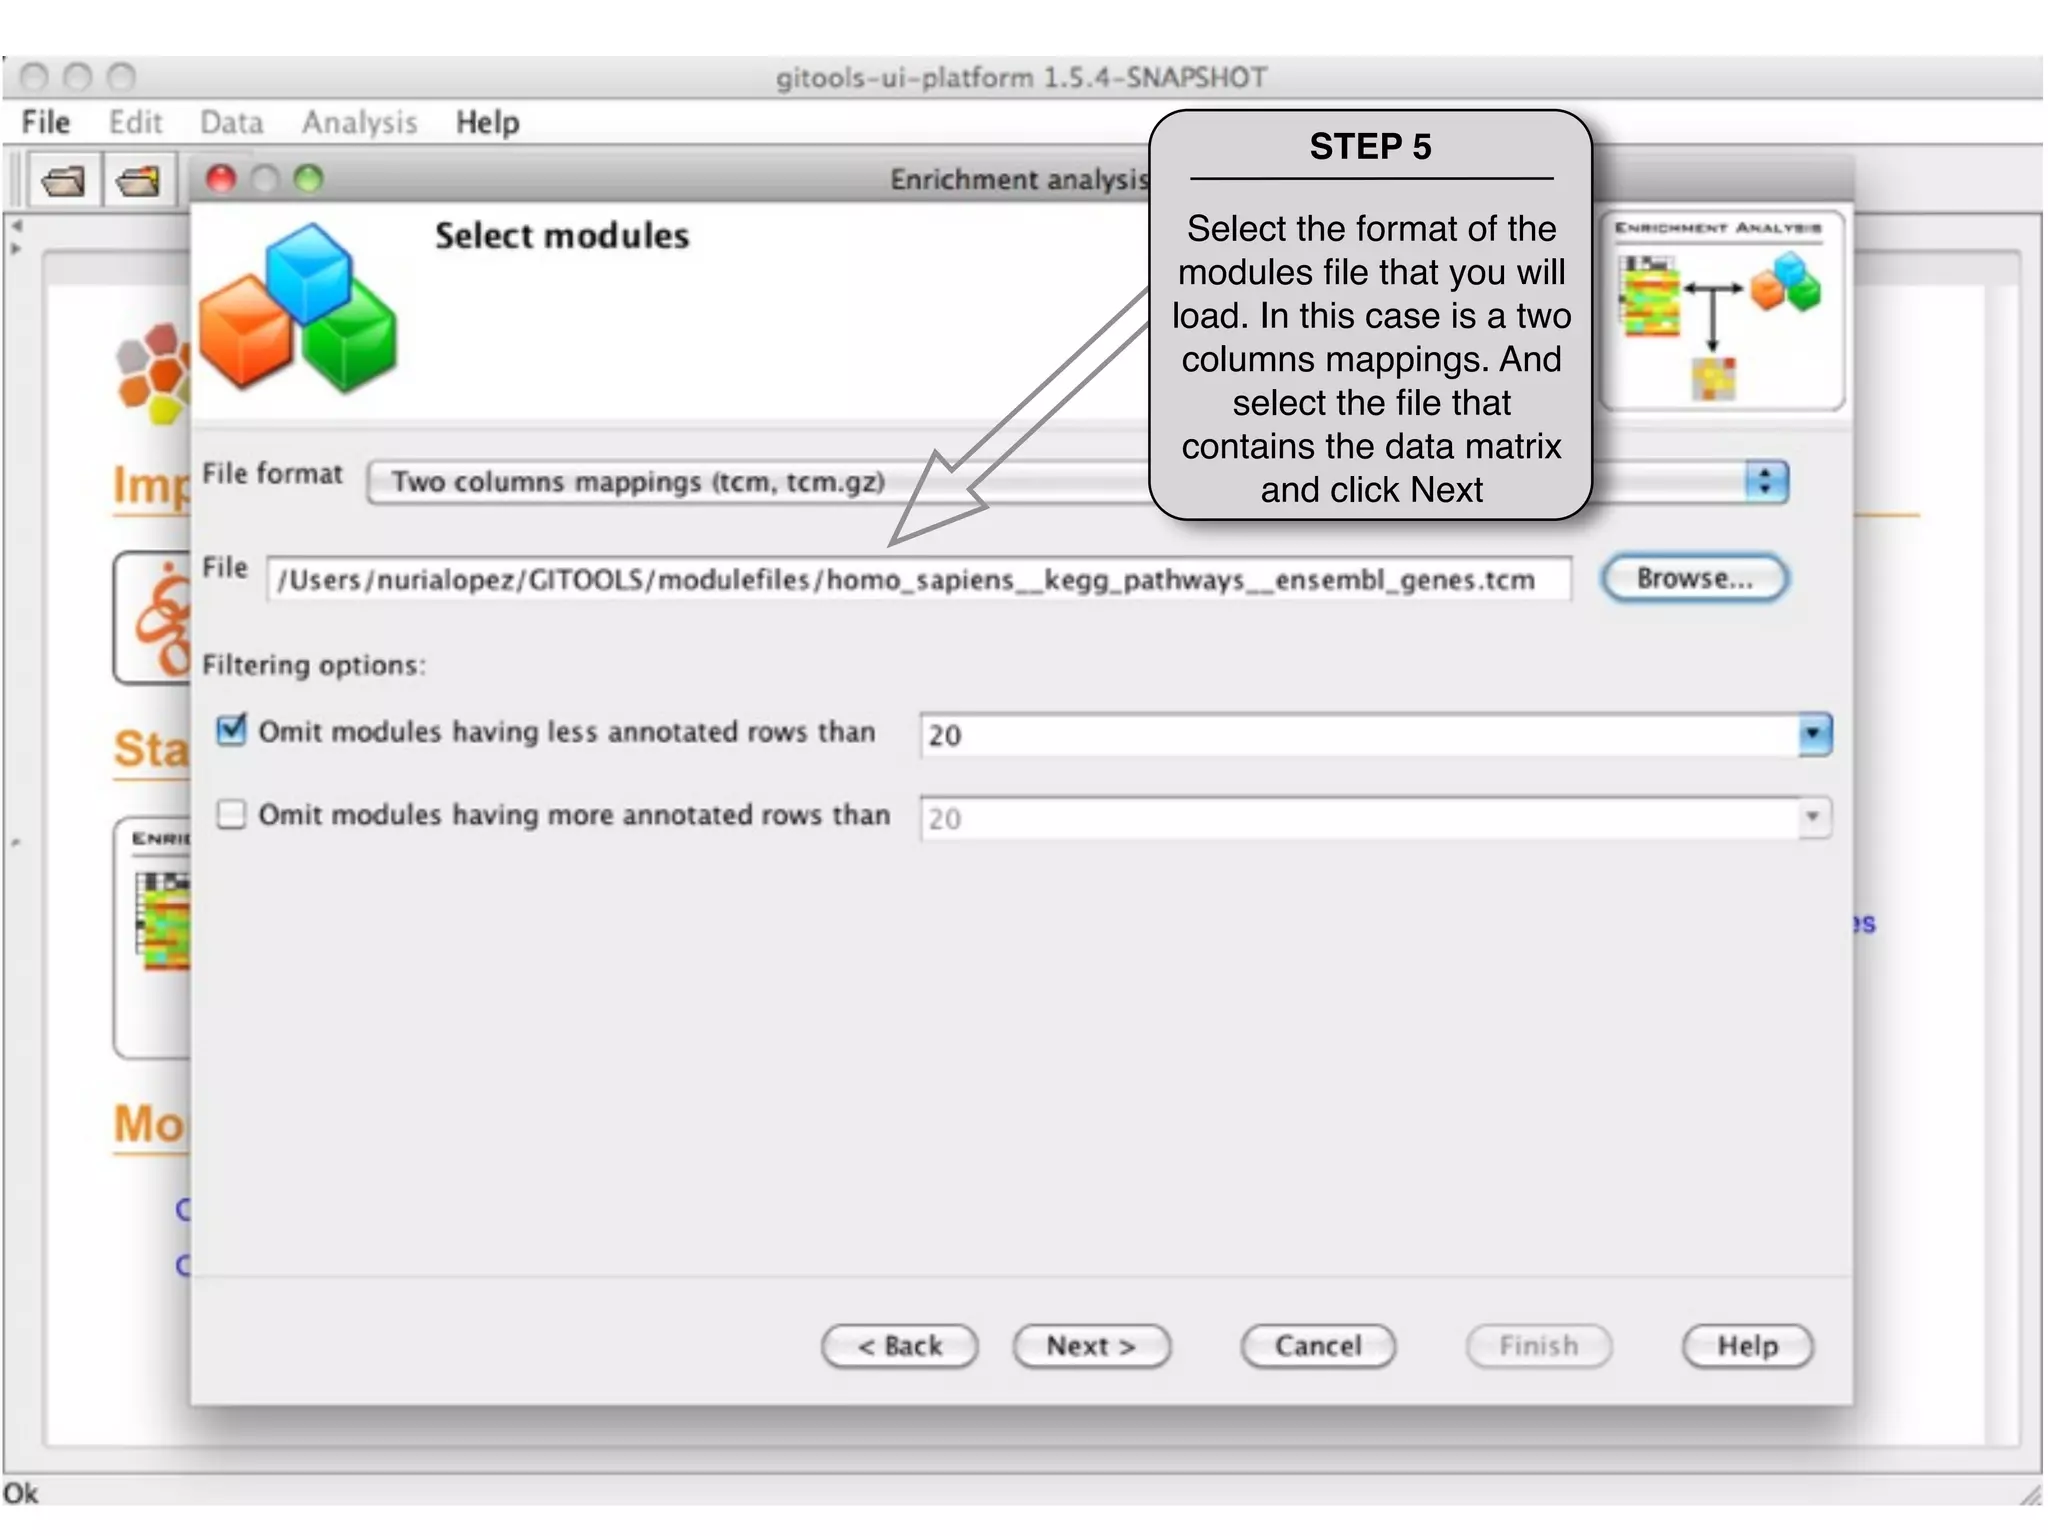
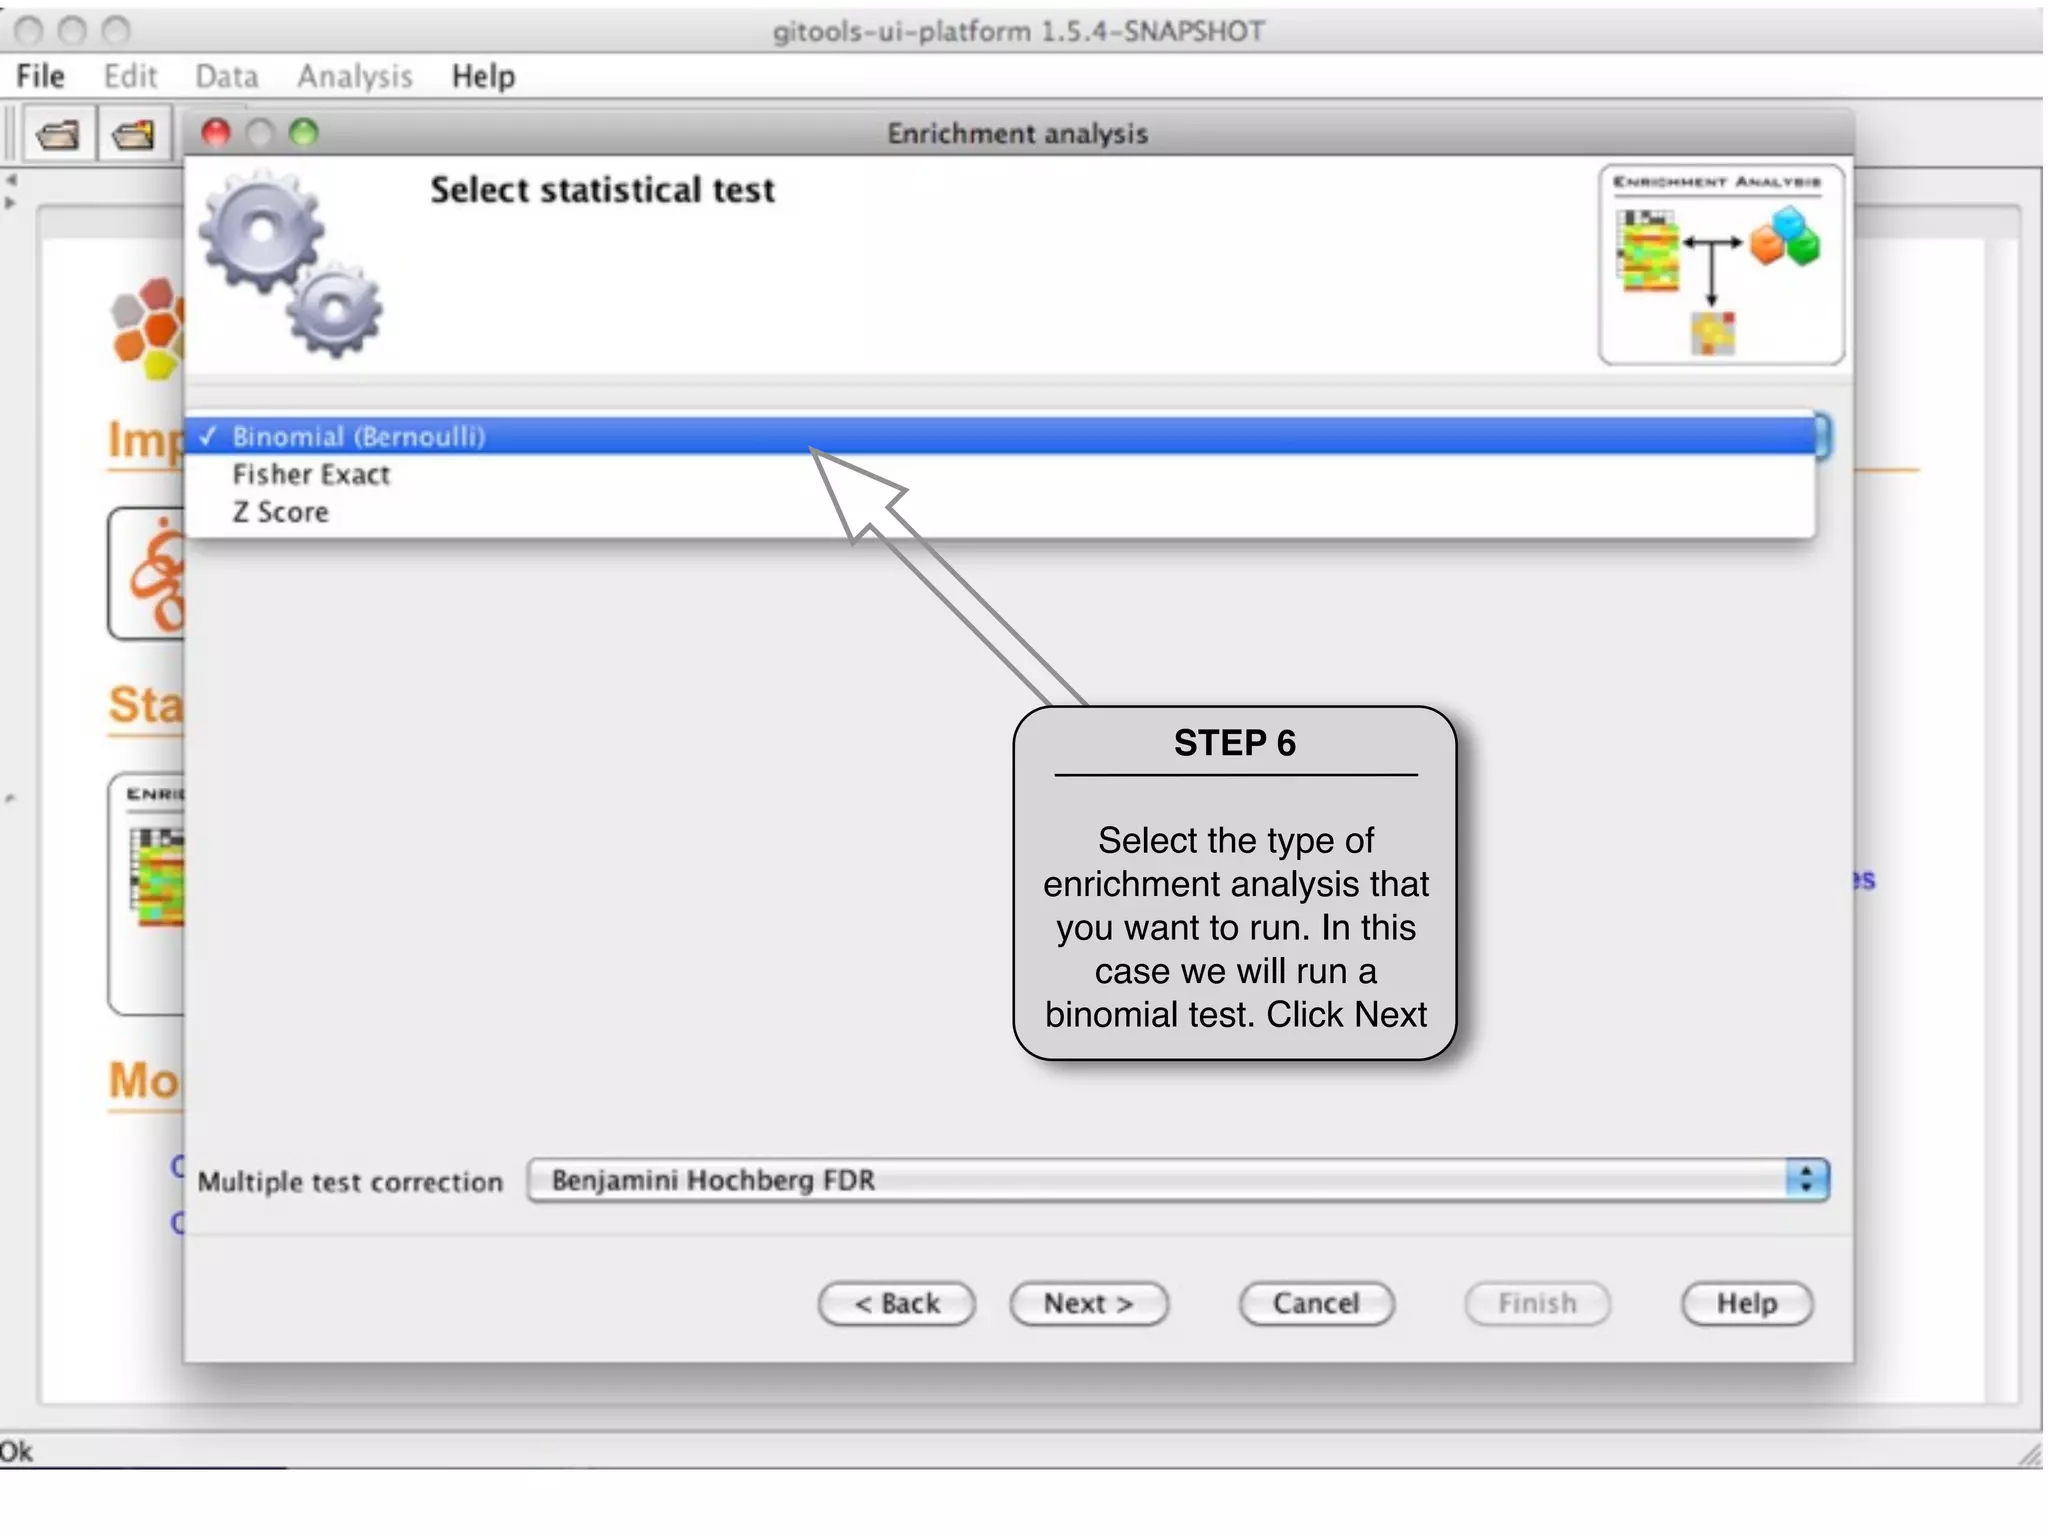
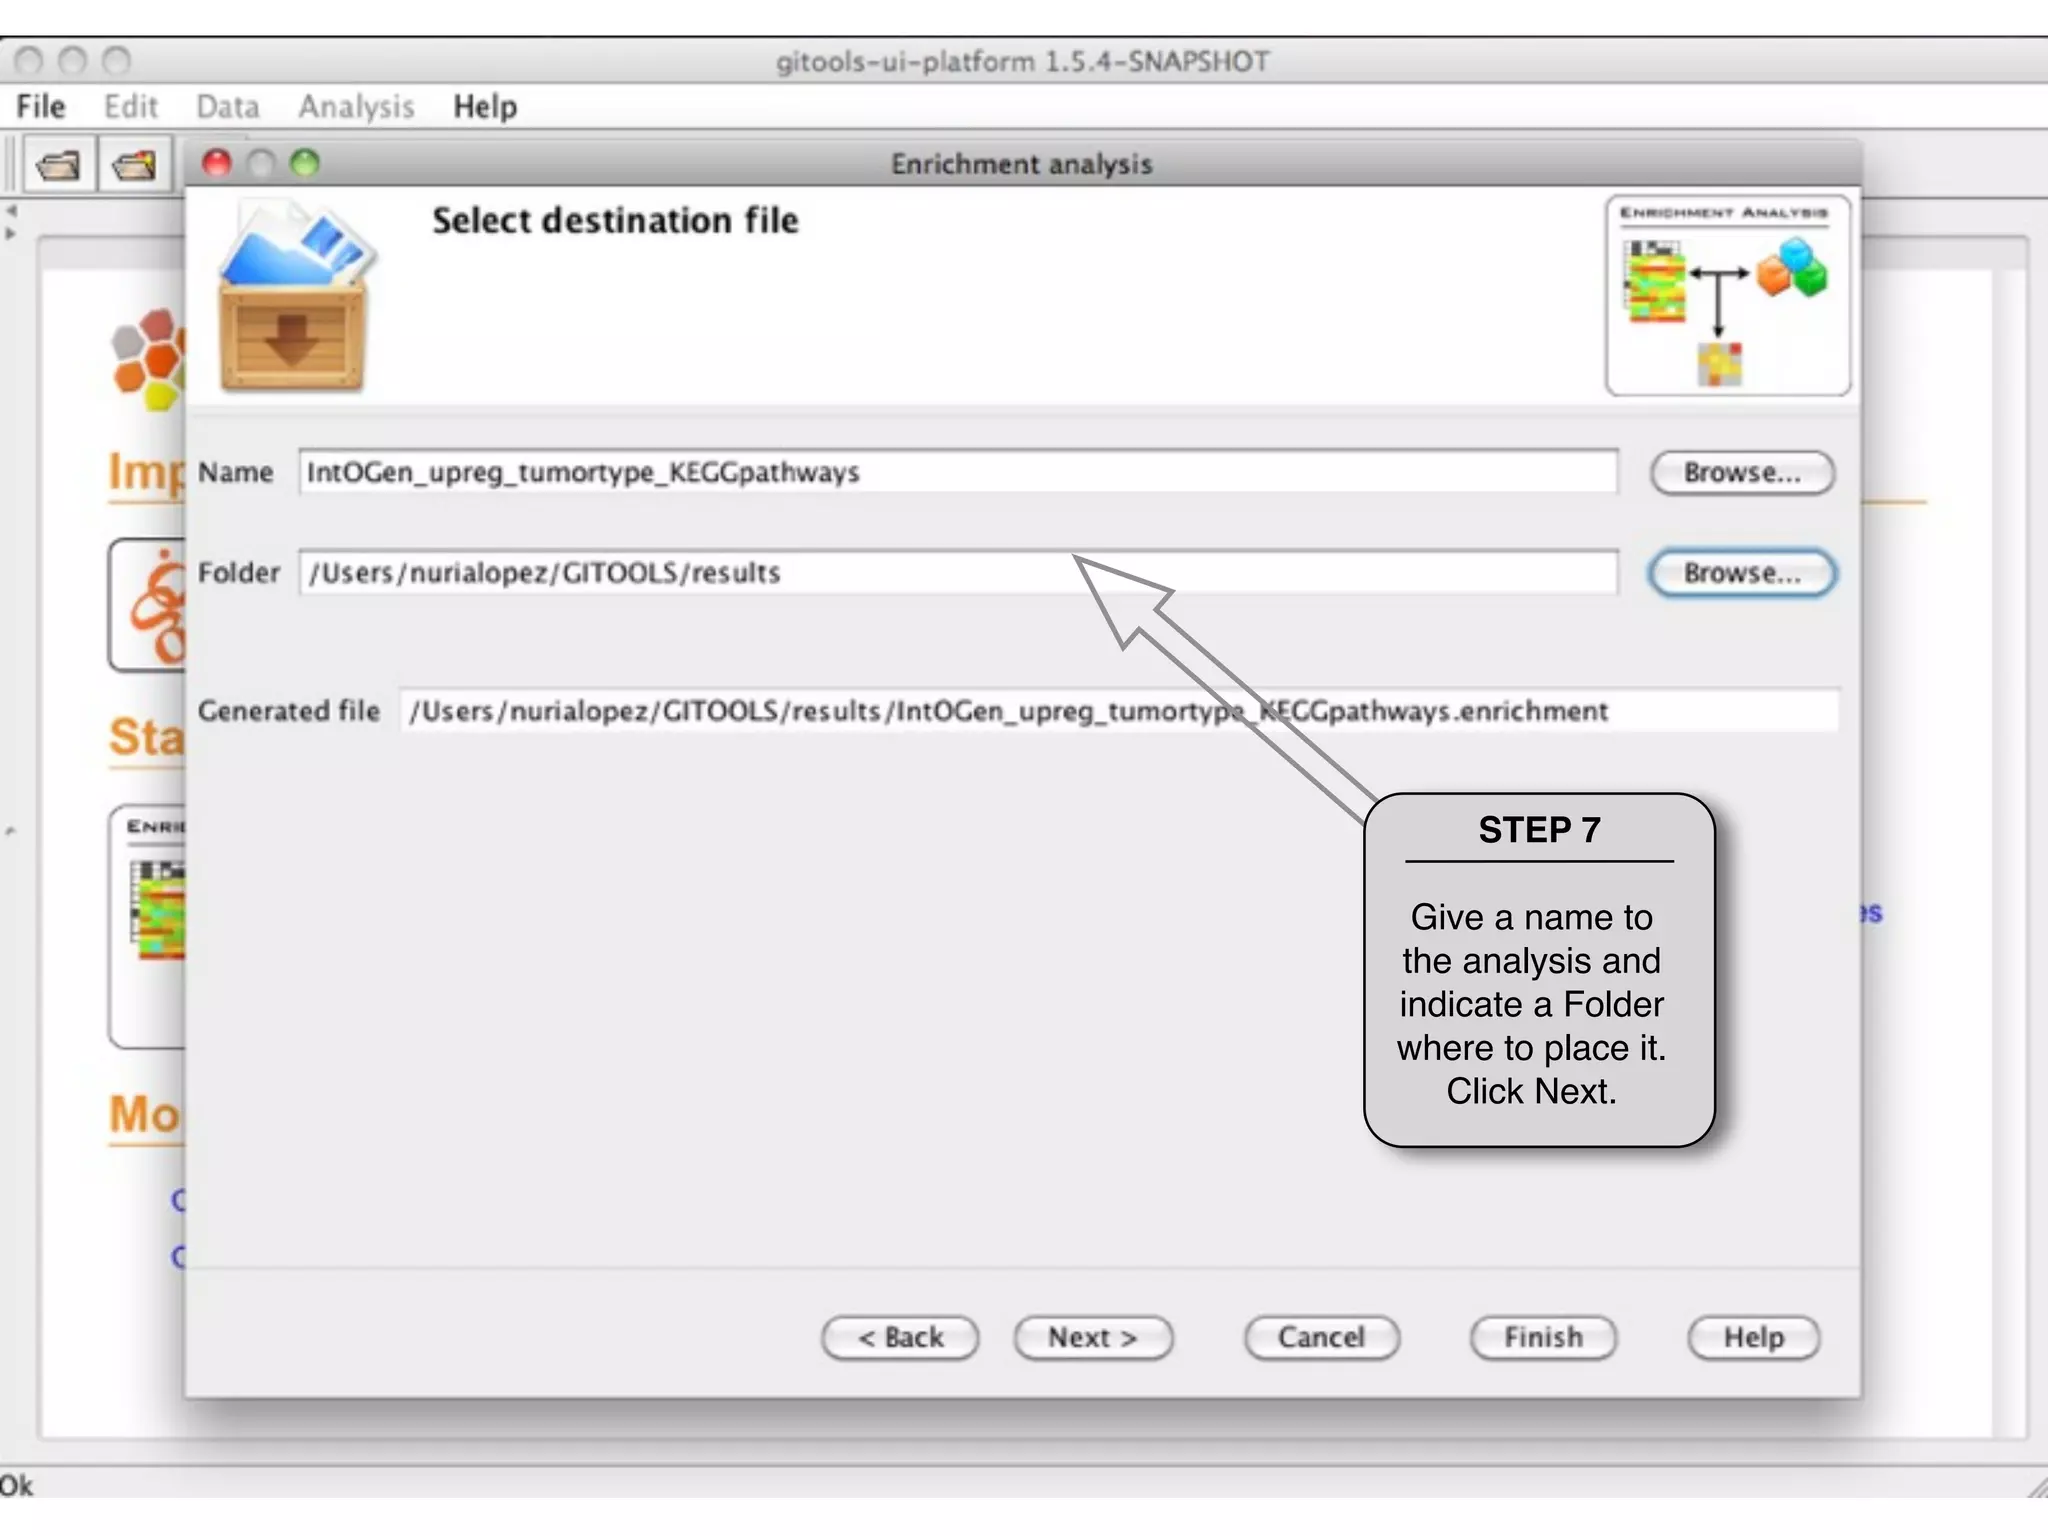
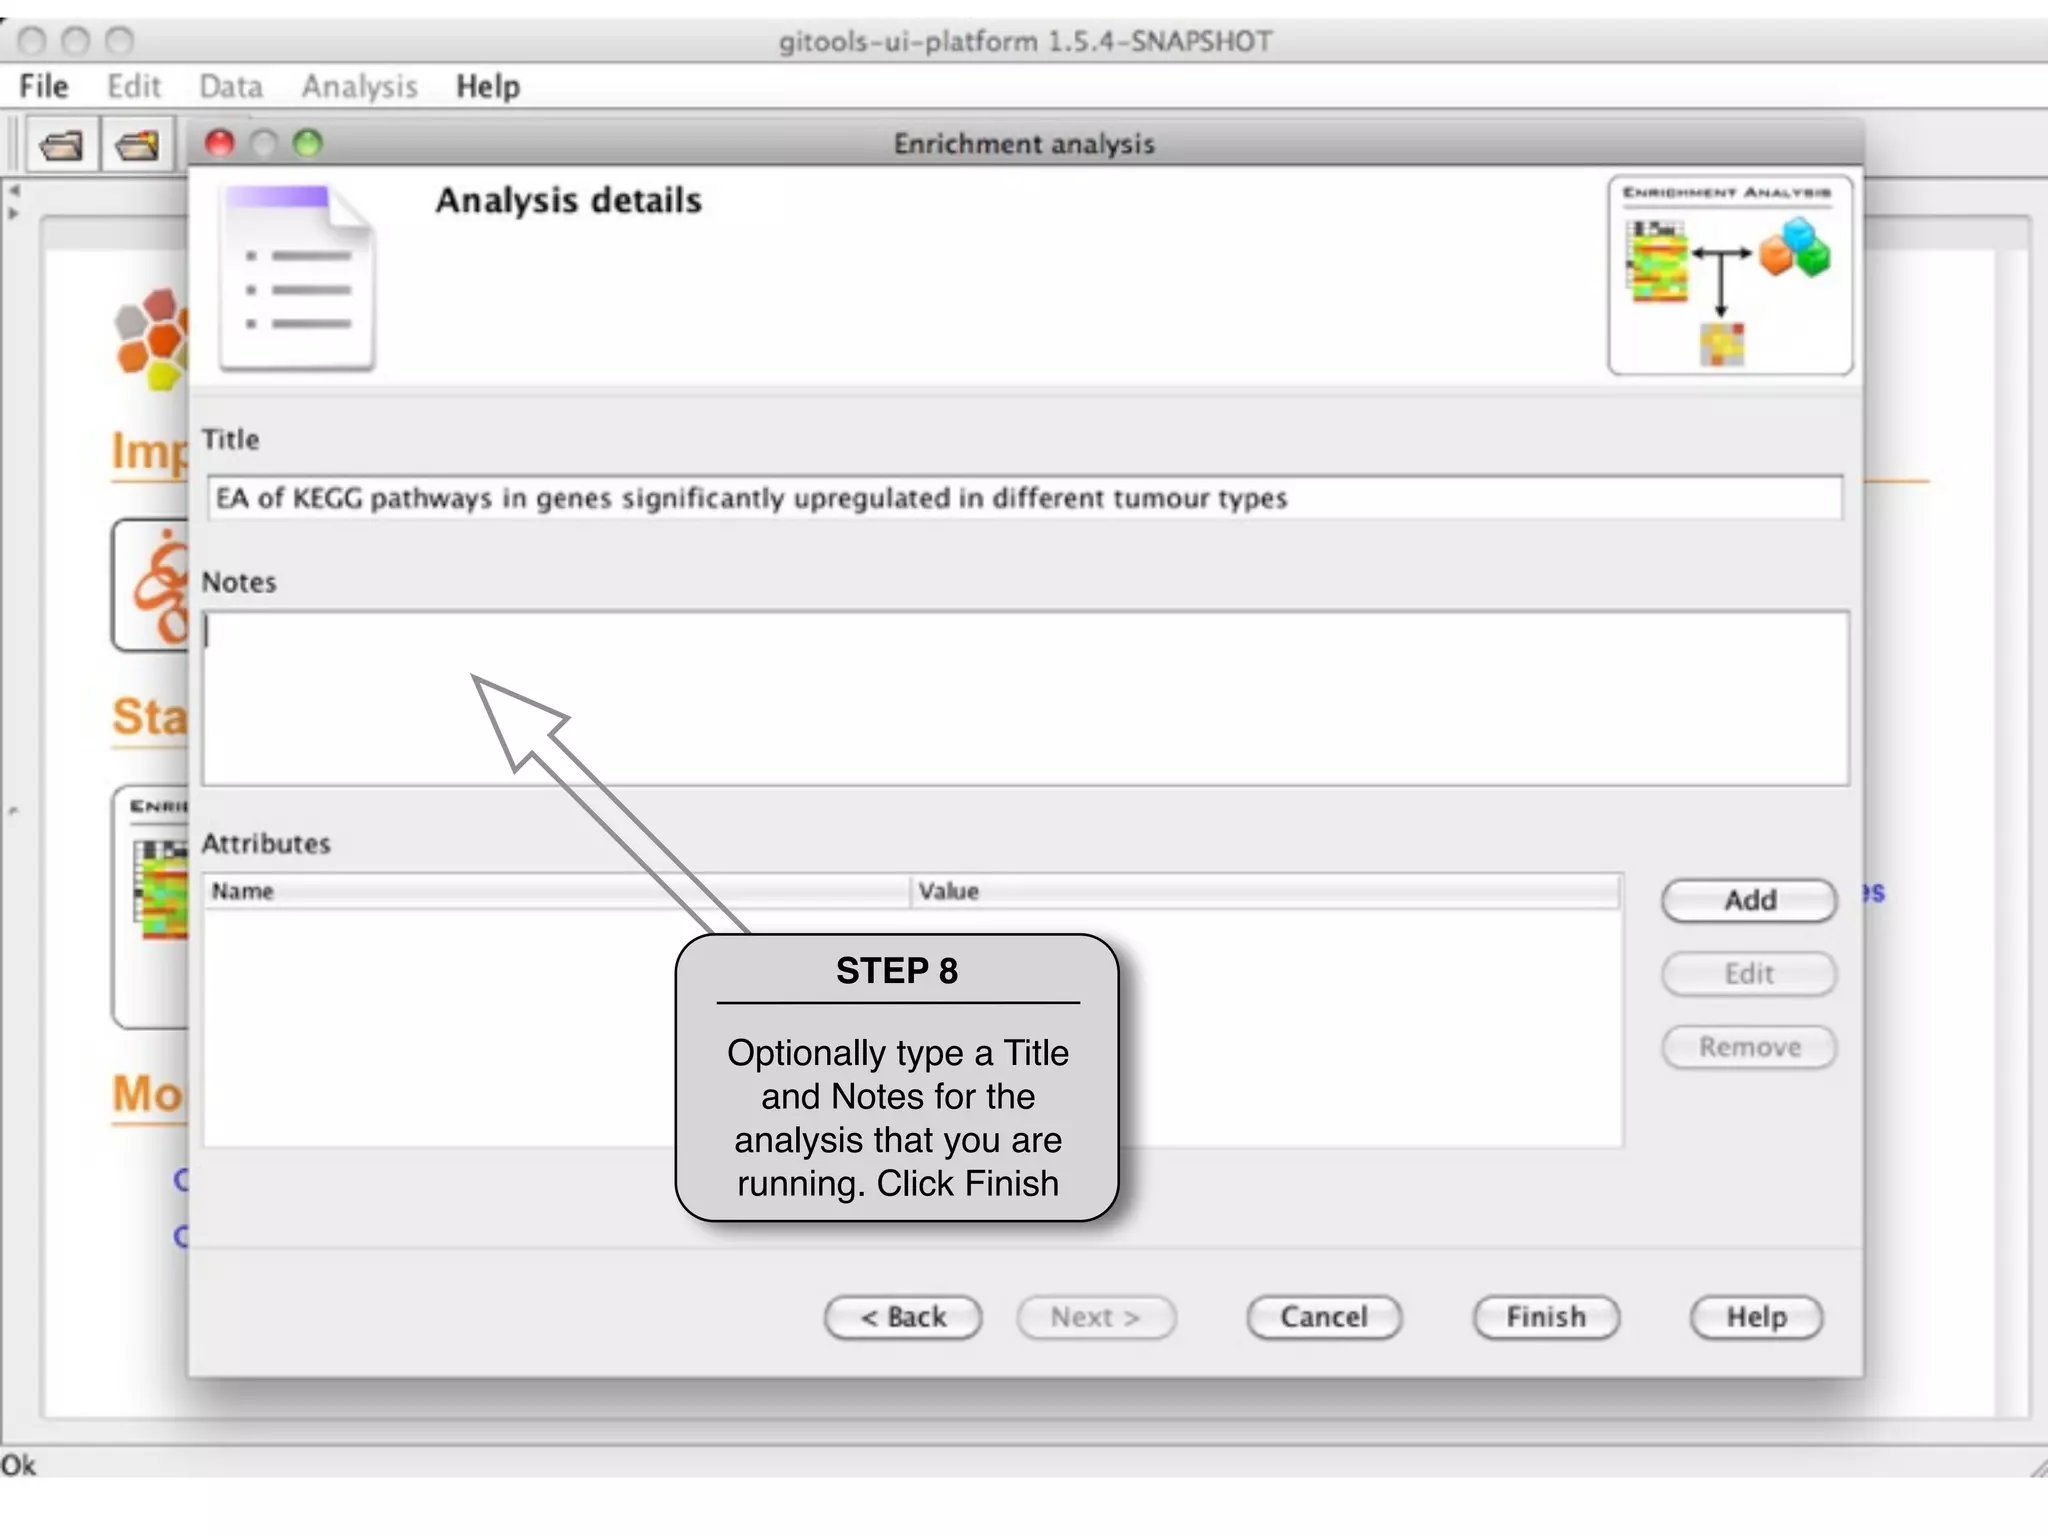
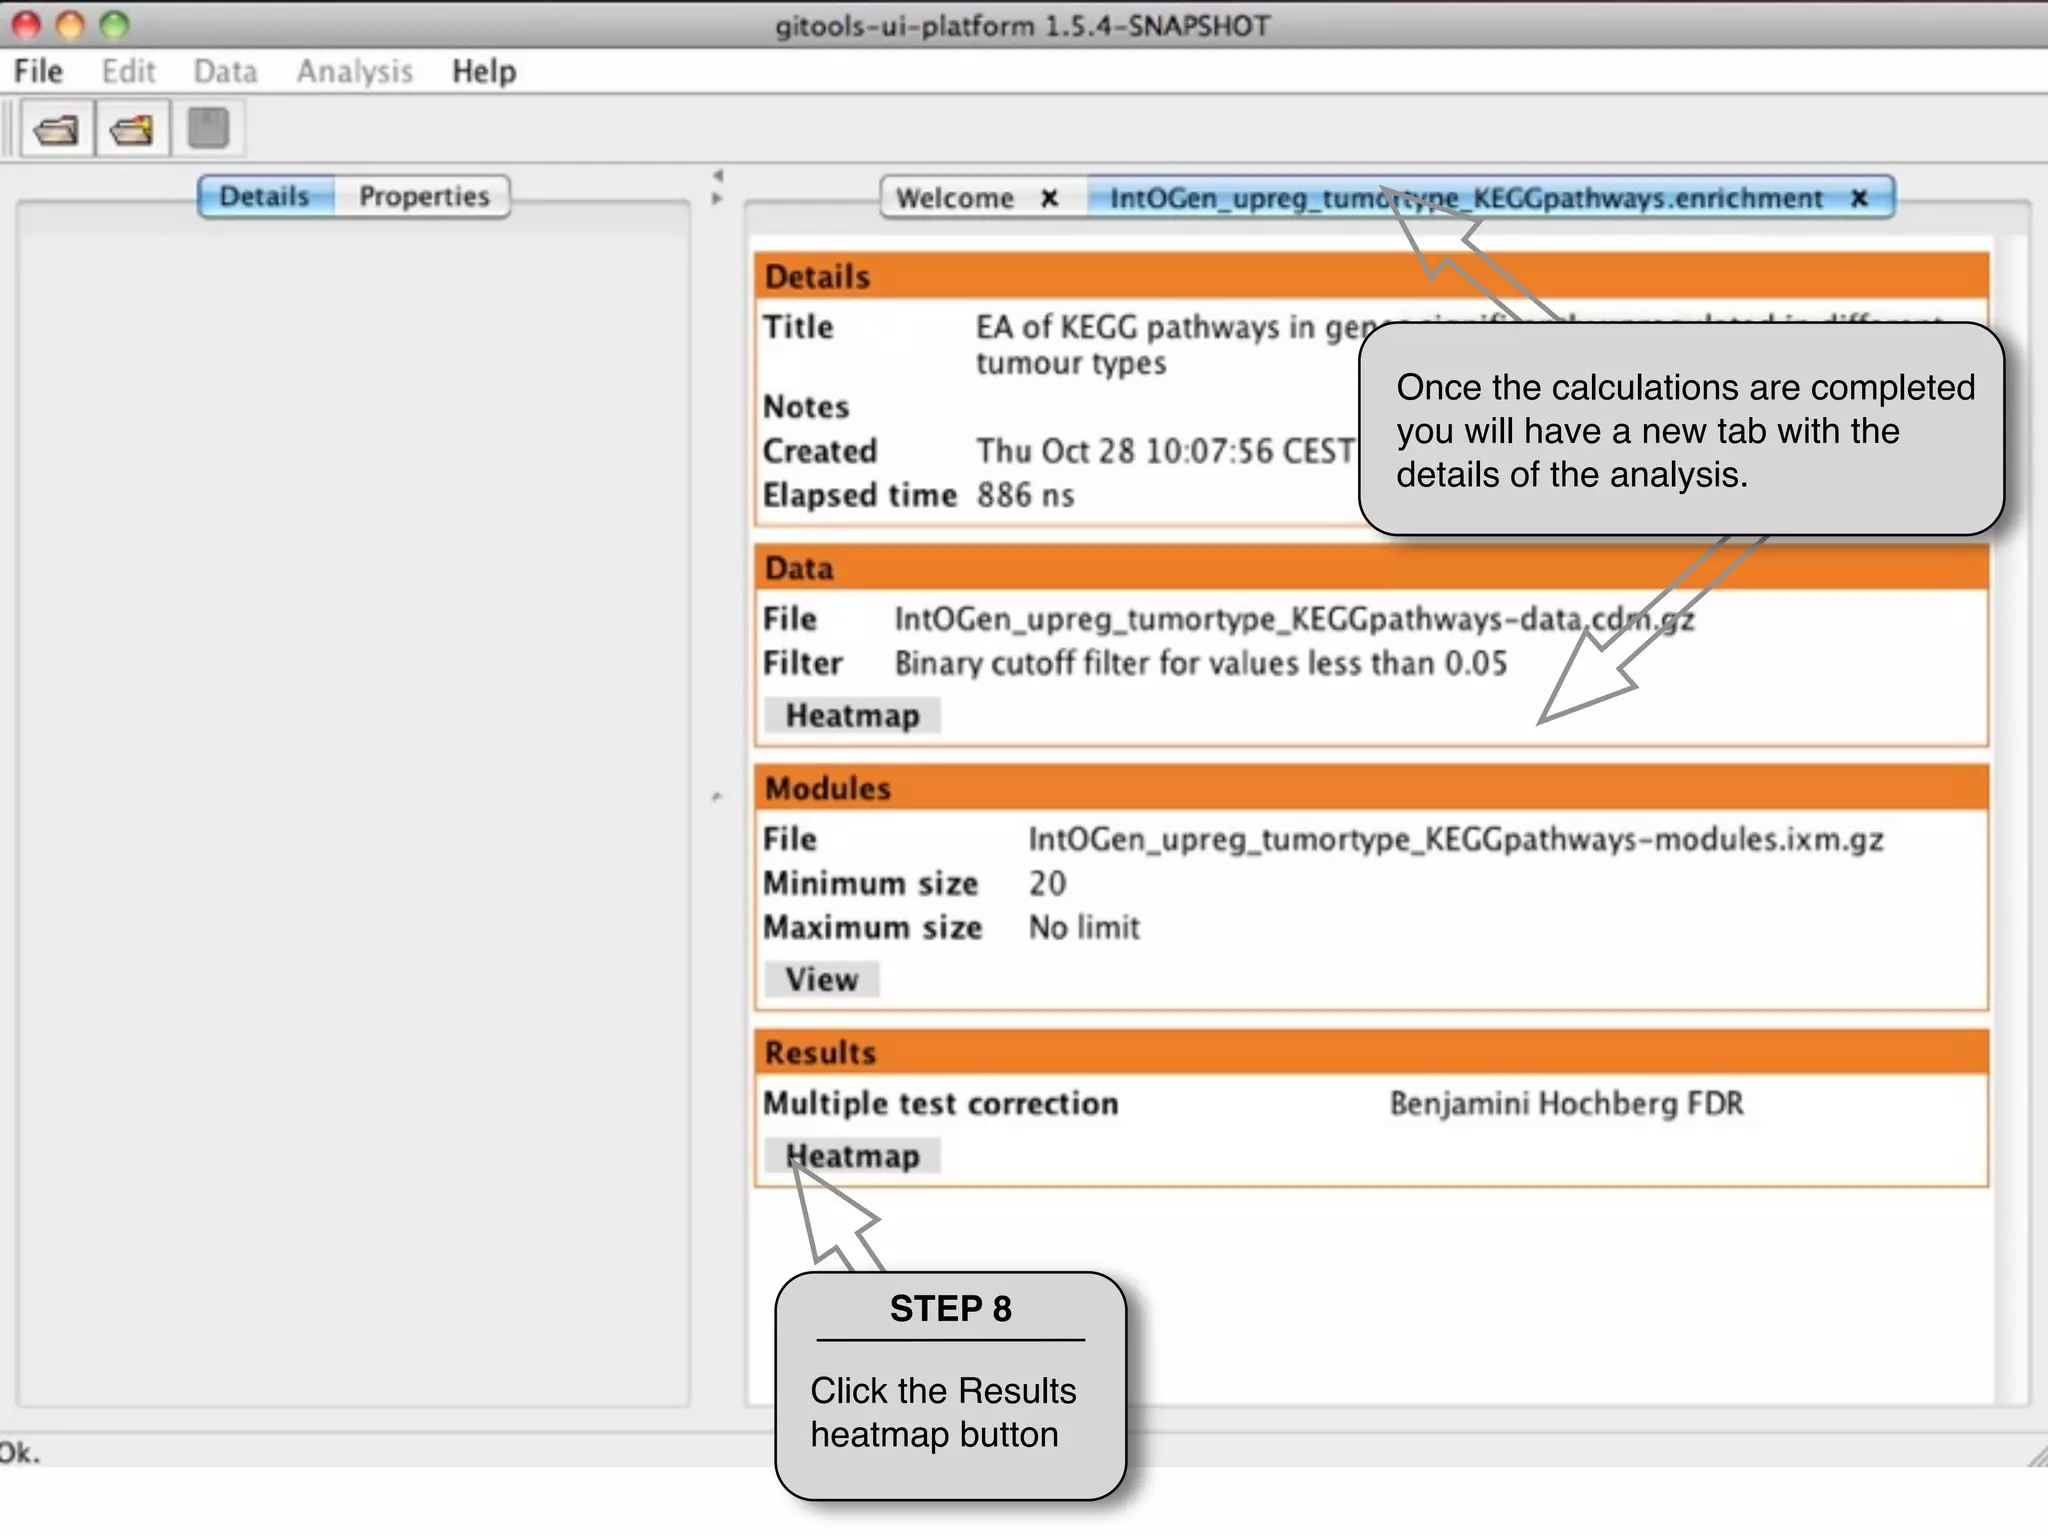
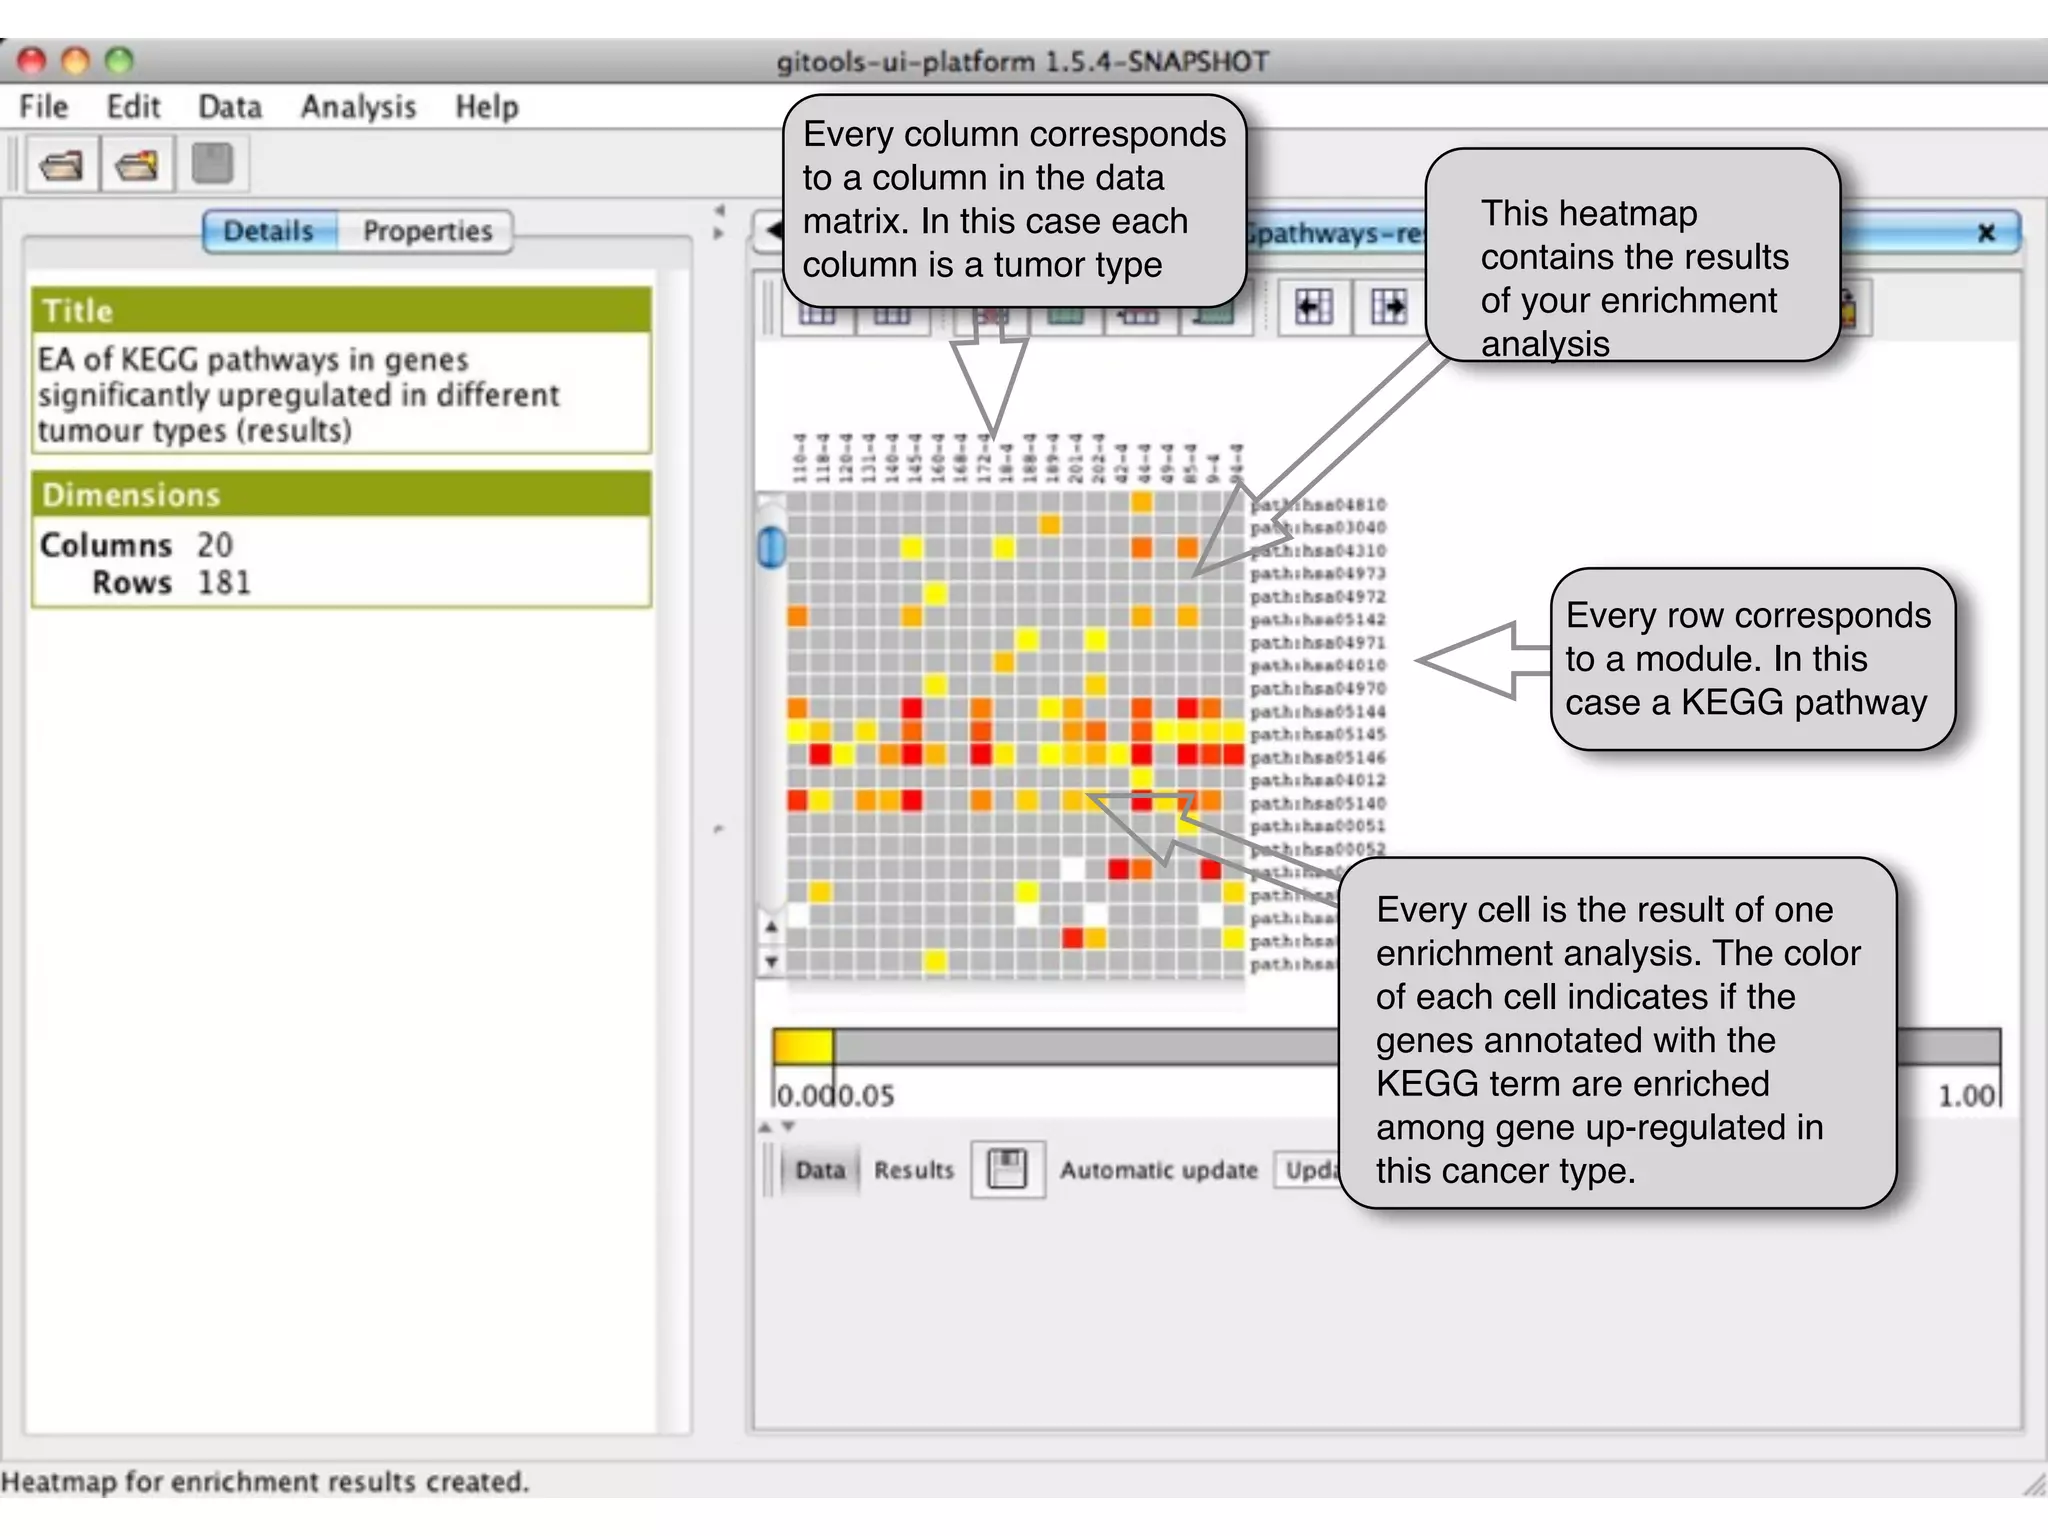
Tutorial 1.3: Run Enrichment Analysis
Run an enrichment analysis to test which KEGG pathways are enriched
among genes significantly up-regulated in different types of cancer
STEP 1

  Click Enrichment
  Analysis Button or
select New>Analysis>
Enrichment analysis...
You have the option of fill               STEP 2
automatically any analysis wizard in
Gitools with an example to learn to    Click Next
perform the analysis
STEP 3
 Select the format of the
data matrix that you will
  load. In this case is a
Continuous data matrix.
 And select the file that
contains the data matrix.
STEP 4

Transform the continous data matrix
  to a binary matrix by choosing a
transformation criteria. In this case,
  since the data matrix contains p-
 values, we want that values lower
    than 0.05 are converted to 1
     (significantly up-regulated)
STEP 5

 Select the format of the
 modules file that you will
load. In this case is a two
 columns mappings. And
    select the file that
 contains the data matrix
      and click Next
STEP 6

   Select the type of
enrichment analysis that
 you want to run. In this
   case we will run a
binomial test. Click Next
STEP 7

 Give a name to
the analysis and
indicate a Folder
where to place it.
   Click Next.
STEP 8

Optionally type a Title
  and Notes for the
analysis that you are
running. Click Finish
Once the calculations are completed
                    you will have a new tab with the
                    details of the analysis.


     STEP 8

Click the Results
heatmap button
Every column corresponds
to a column in the data
matrix. In this case each         This heatmap
column is a tumor type            contains the results
                                  of your enrichment
                                  analysis


                                        Every row corresponds
                                        to a module. In this
                                        case a KEGG pathway


                            Every cell is the result of one
                            enrichment analysis. The color
                            of each cell indicates if the
                            genes annotated with the
                            KEGG term are enriched
                            among gene up-regulated in
                            this cancer type.
THANKS FOR USING GITOOLS


    http://www.gitools.org

Tutorial 1.3 - Run Enrichment Analysis

  • 1.
    Tutorial 1.3: RunEnrichment Analysis Run an enrichment analysis to test which KEGG pathways are enriched among genes significantly up-regulated in different types of cancer
  • 2.
    STEP 1 Click Enrichment Analysis Button or select New>Analysis> Enrichment analysis...
  • 3.
    You have theoption of fill STEP 2 automatically any analysis wizard in Gitools with an example to learn to Click Next perform the analysis
  • 4.
    STEP 3 Selectthe format of the data matrix that you will load. In this case is a Continuous data matrix. And select the file that contains the data matrix.
  • 5.
    STEP 4 Transform thecontinous data matrix to a binary matrix by choosing a transformation criteria. In this case, since the data matrix contains p- values, we want that values lower than 0.05 are converted to 1 (significantly up-regulated)
  • 6.
    STEP 5 Selectthe format of the modules file that you will load. In this case is a two columns mappings. And select the file that contains the data matrix and click Next
  • 7.
    STEP 6 Select the type of enrichment analysis that you want to run. In this case we will run a binomial test. Click Next
  • 8.
    STEP 7 Givea name to the analysis and indicate a Folder where to place it. Click Next.
  • 9.
    STEP 8 Optionally typea Title and Notes for the analysis that you are running. Click Finish
  • 10.
    Once the calculationsare completed you will have a new tab with the details of the analysis. STEP 8 Click the Results heatmap button
  • 11.
    Every column corresponds toa column in the data matrix. In this case each This heatmap column is a tumor type contains the results of your enrichment analysis Every row corresponds to a module. In this case a KEGG pathway Every cell is the result of one enrichment analysis. The color of each cell indicates if the genes annotated with the KEGG term are enriched among gene up-regulated in this cancer type.
  • 12.
    THANKS FOR USINGGITOOLS http://www.gitools.org