Download to read offline
![International Research Journal of Engineering and Technology (IRJET) e-ISSN: 2395-0056
Volume: 04 Issue: 07 | July -2017 www.irjet.net p-ISSN: 2395-0072
© 2017, IRJET | Impact Factor value: 5.181 | ISO 9001:2008 Certified Journal | Page 3364
Turbulent Flow in Curved Square Duct: Prediction of Fluid flow and
Heat transfer Characteristics
R Girish Kumar1, Rajesh V Kale2
1M.E Student, RGIT, Andheri, Mumbai, India
2Professor, Dept of Mechanical Engineering, RGIT, Andheri, Mumbai, India
---------------------------------------------------------------------***---------------------------------------------------------------------
Abstract – Fully developed Turbulent flows in curved square
duct with curvature of 30degree numerically and
experimentally investigated. Turbulent flows in non circular
duct leads to generate the secondary motions in crosswise
direction. These secondary motions of second kind are
generated due to the gradient of Reynolds Stresses in cross
stream in straight duct. But these secondary motions are
generated in curved square duct due to imbalance between
centrifugal force and radial pressuregradients. Thisnoteaims
to predict numerically these secondary motions and their
effects on fluid flow and heat transfer characteristics in the
curved square duct. SST K ω model has been used to simulate
the flow. And these results are validated with experimental
measurements. It has been observed that there is good
agreement between the numerical and experimental results.
Key Words: Turbulent flow, Secondary motions,
Reynolds Stresses, Square Duct, Heat transfer
1.INTRODUCTION
Prediction of Turbulent flow characteristics is of academic
interest since few decades. In spite having numerous
applications, there are only few exclusive studies which are
focussed on secondary motions of turbulent flow. These
secondary flows mean velocity will be up to 5-10% of mean
velocity of primary flow. Experimental measurements of
turbulent flow characteristicsin90˚curvedsquareducthave
been studied by Humphery, White law and Yee [1]. These
studies are done with the aid of non disturbing Laser
Doppler Velocimetry and they have reported that stronger
secondary motions and higher levels of turbulence is
experienced near thicker boundary region. Numerous
studies undertaken over the past few years done by Lesieur
and Métais [2]; Moin [3]; Germano [4] demonstrate that LES
is one of the most reliable approaches for the prediction of
complex turbulent flows of practical relevance. Gavrilikas
investigated the flow pattern inside the straight rectangular
duct through numeric simulation and concluded that
turbulent flow near the smooth corner is subjected to
remarkable structural change, mean stream wise vortices
attain their largest values in the region where the viscous
effects are significant [5].
In few major applications the continuous change of fluid
direction induces the centrifugal effects in fluid flow. Tilak T
et al and Humphrey simulated the flow with various
boundary conditions and geometries and has given the
reason behind formation of secondary flows and
relationships between duct geometry, aspect ratios and
secondary flows [1, 6]. But there no exclusively devoted
study of these secondary flows in curvedductinrelationship
with heat transfer. Present study focuses on presenting the
relationship between heat transfer enhancement and
Secondary motions or secondary flows.
2. GOVERNING EQUATIONS, METHODOLOGY AND
TESTING DOMAIN
The present case is of unsteady, three dimensional and
turbulent in nature. Therefore an averaged continuity
equation, Reynolds averaged Navier stokes equation and
energy equations are solved.
1. Continuity equation
0
i
i
x
u
(1)
2. Navier Stokes equation
i
ji
j
i
jjj
jii
x
uu
x
u
xx
p
x
uu
t
u
)(
)(
1)( 11
(2)
3. Energy Equation
j
ji
jjj
i
x
uu
x
T
xx
Tu
t
T
11
)(
(3)
Where ‘u’ time averaged velocity and
11
ji uu is Reynolds
stress
SST K-ω turbulence model is used in predicting the
turbulent flow characteristics in the heated Curved squared
duct. And this model is validated with DNS results of
Gavrilakas(1992) for straight square duct at Reynolds
number 4410 and they show good agreement in the results.
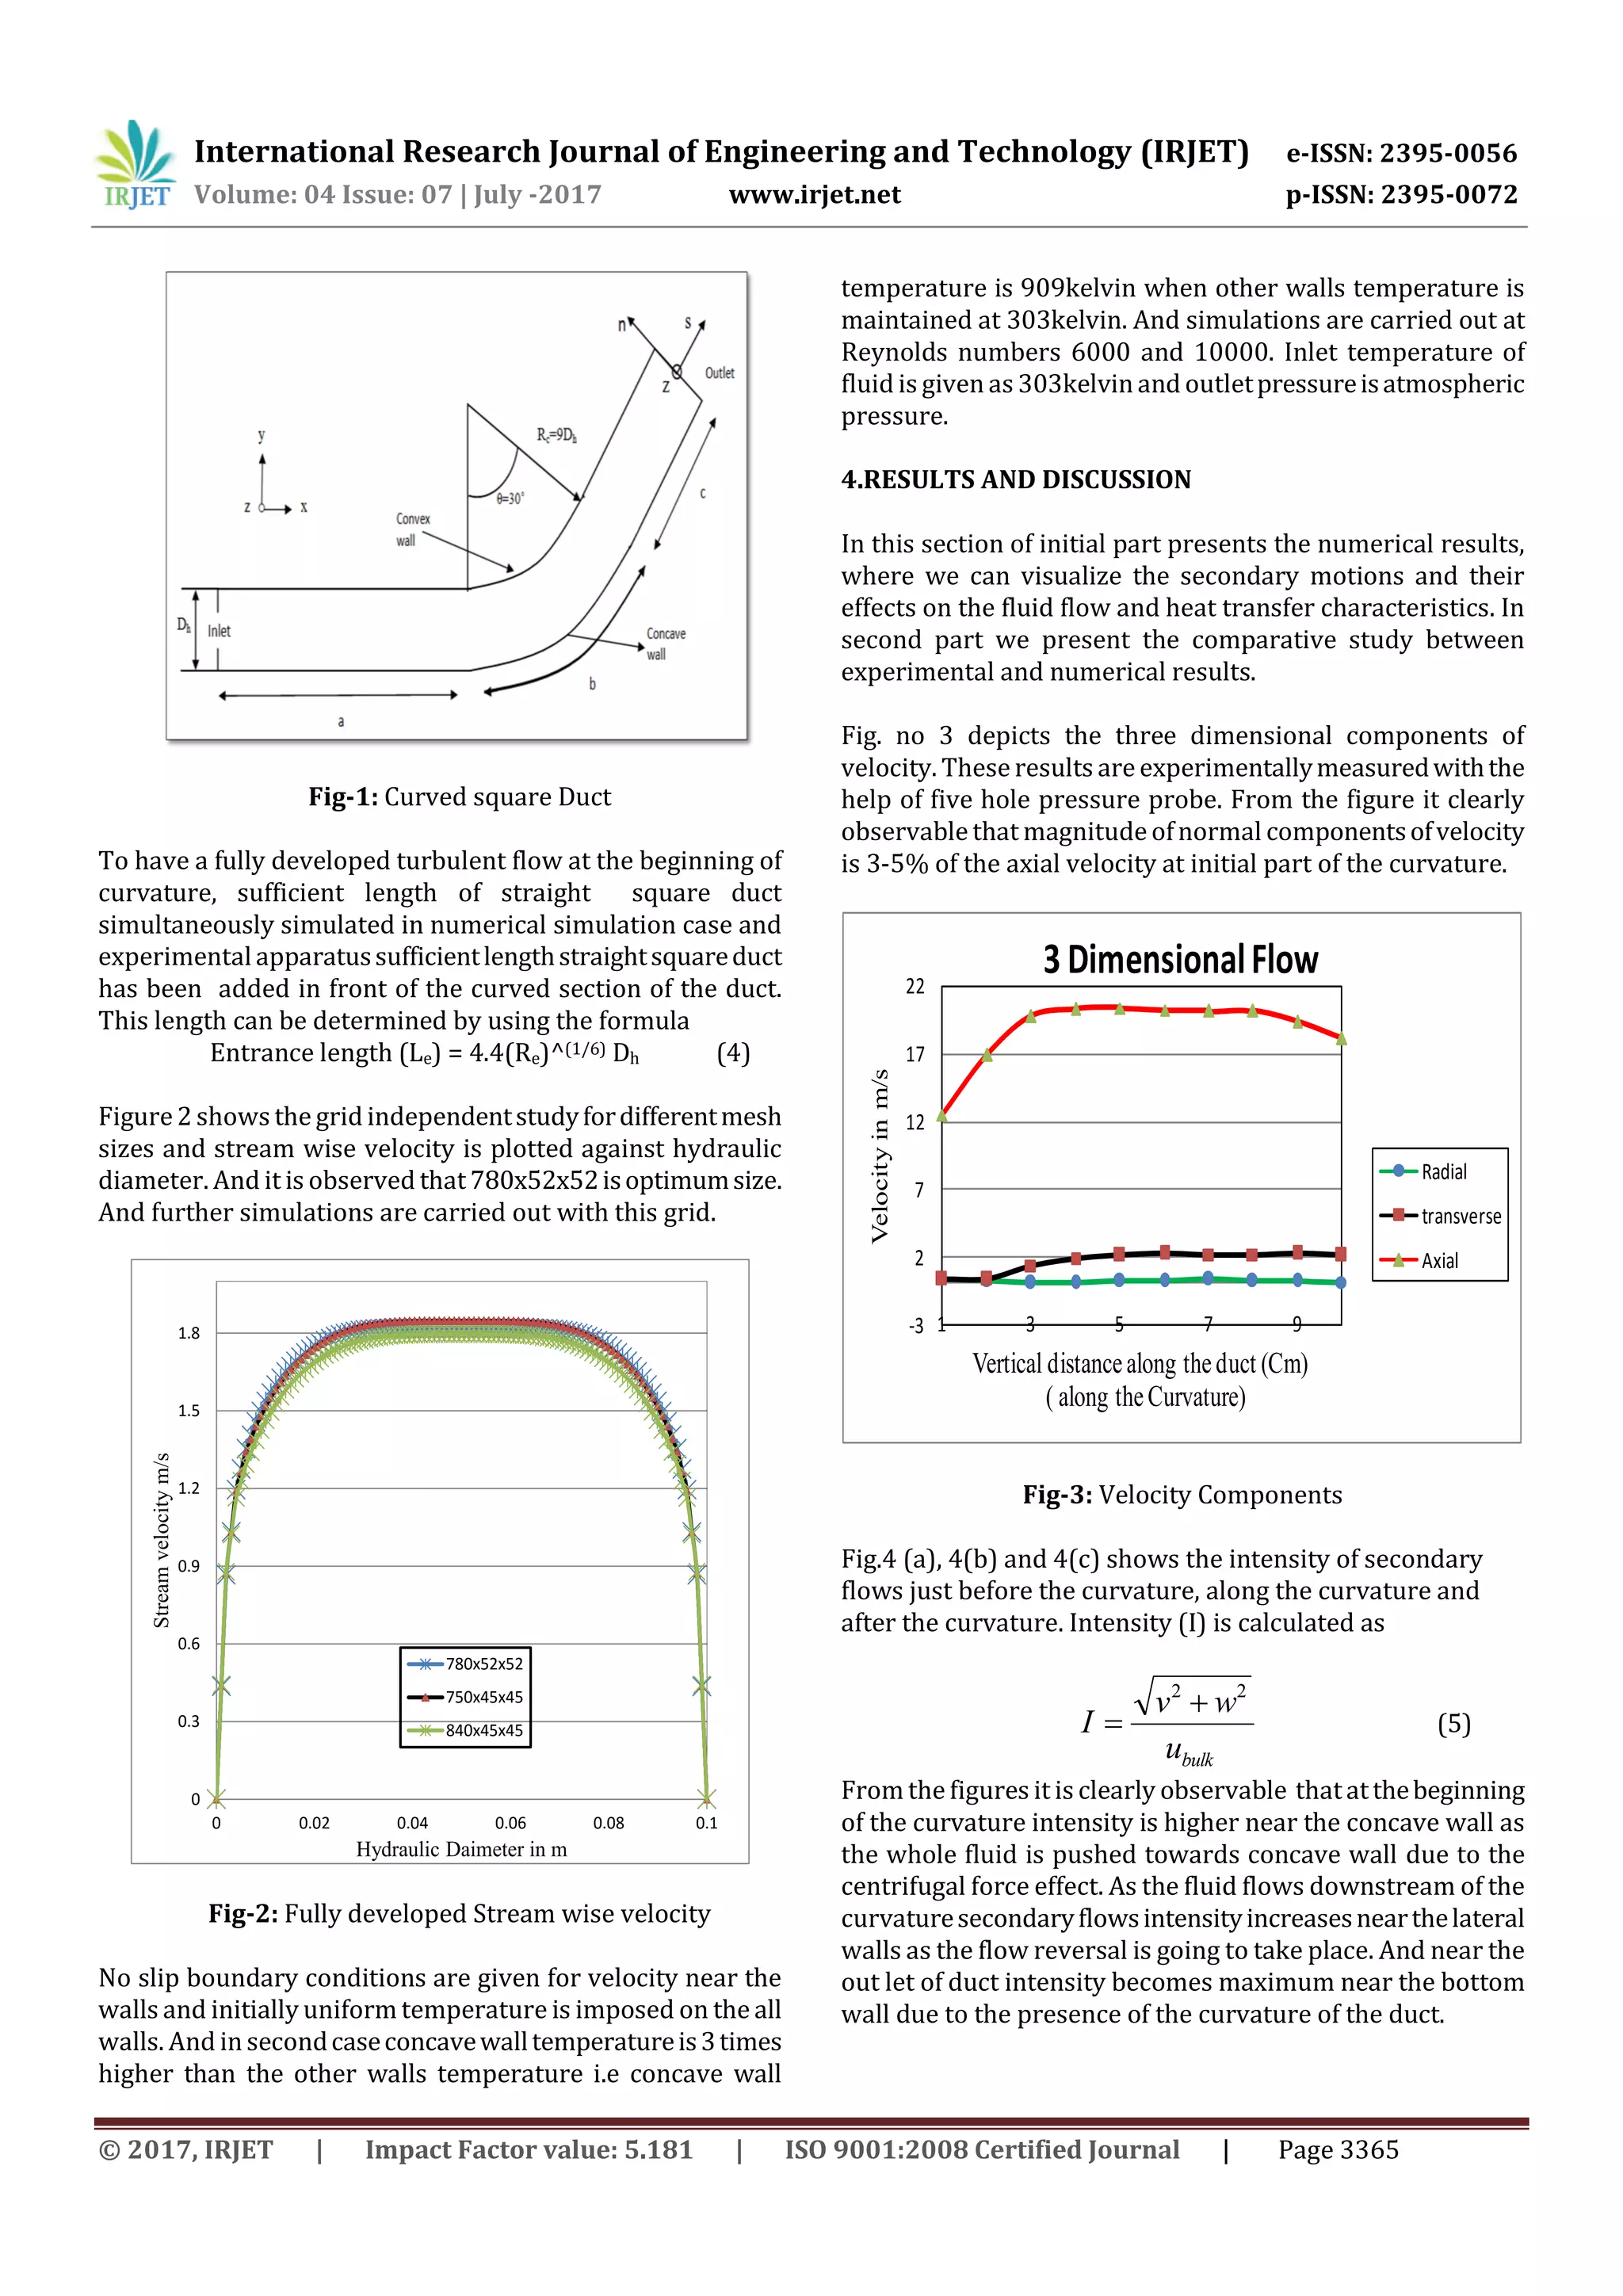
Computational domain is as shown in figure.1 consists of
30˚ curvature and all other dimensions are in terms of
hydraulic diameter of the duct Dh. It is square duct (Aspect
Ratio=1) with 100mm side. Air has been used as working
fluid with the properties of kinematic viscosity (ʋ) = 1.6x10⁻⁶
m2/s and Prandtle number (Pr) = 0.7.](https://image.slidesharecdn.com/irjet-v4i7667-170915104359/75/Turbulent-Flow-in-Curved-Square-Duct-Prediction-of-Fluid-flow-and-Heat-transfer-Characteristics-1-2048.jpg)
![International Research Journal of Engineering and Technology (IRJET) e-ISSN: 2395-0056
Volume: 04 Issue: 07 | July -2017 www.irjet.net p-ISSN: 2395-0072
© 2017, IRJET | Impact Factor value: 5.181 | ISO 9001:2008 Certified Journal | Page 3367
Fig -6(b):Temperature contour alog the Curvature
Fig -6(c): Temperature contour after the Curvature
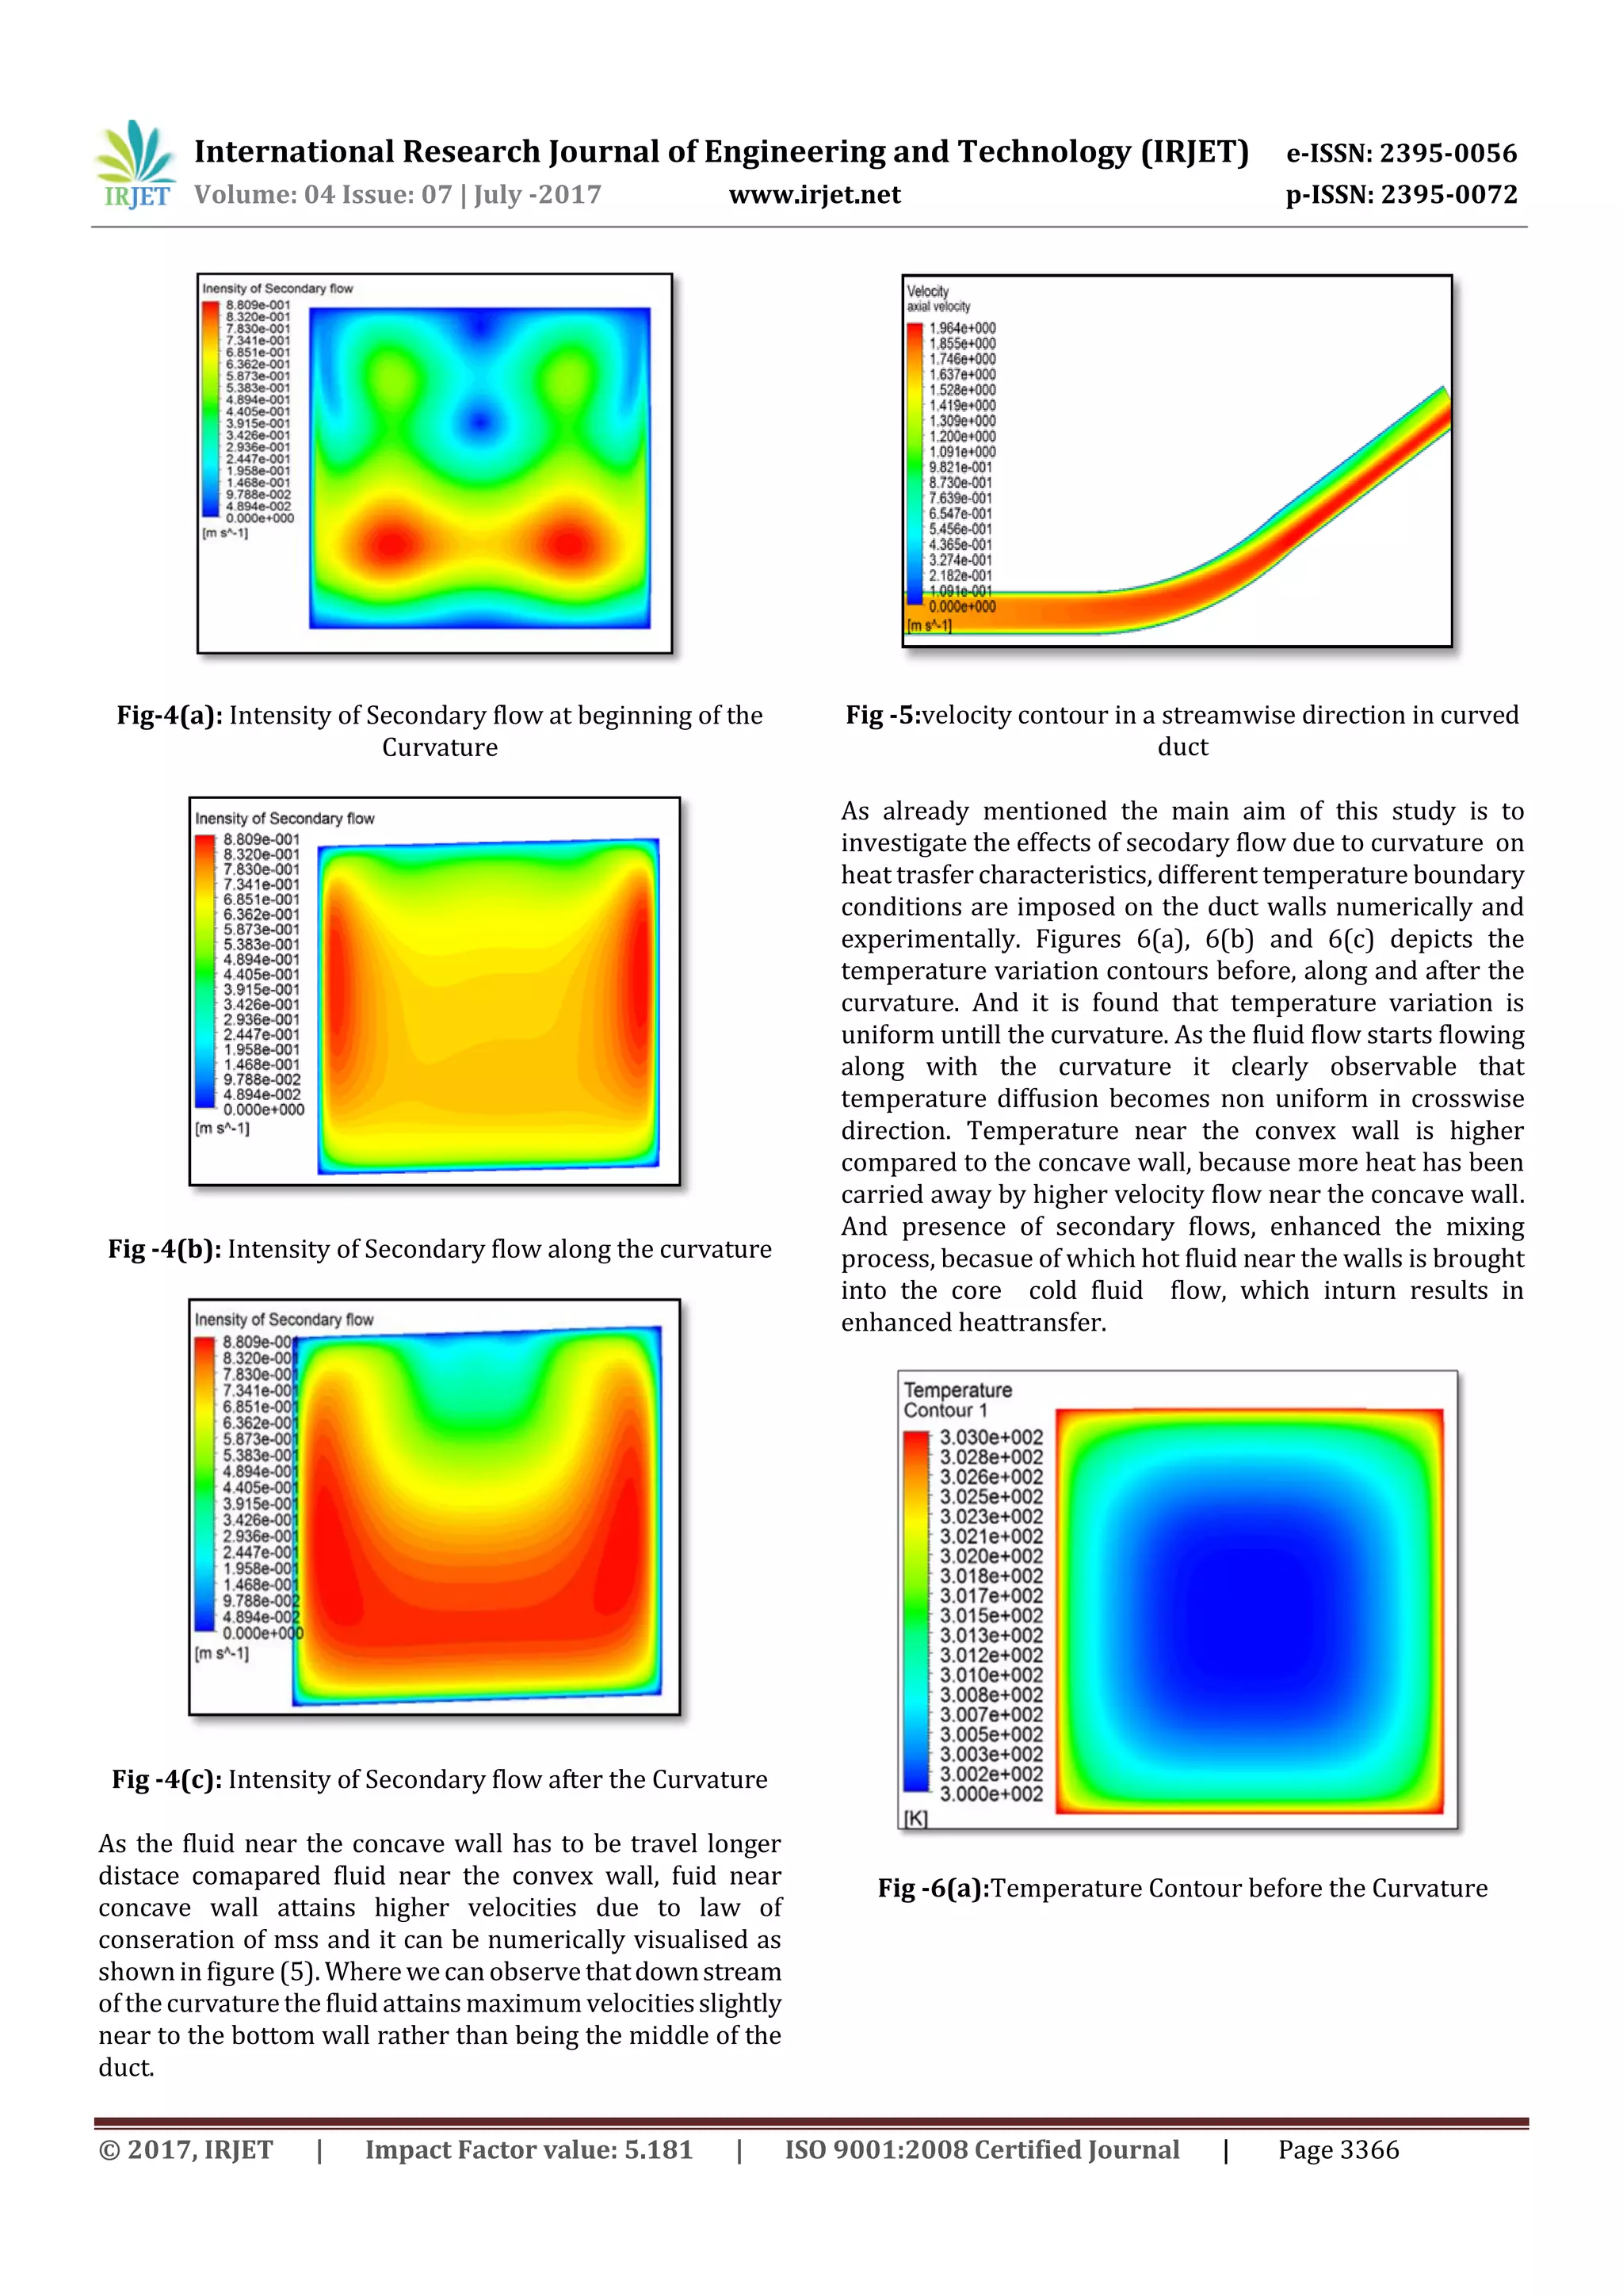
Figures 7 and 8 presents the comparive study of
CFD(numrical) and Experimental results on Streamwise
velocity and Temperature. It is witnessed that temperatures
near the convex wall is higher compared to theregionnearto
the concave wall due to lower magnitudes of velocities.
0
0.4
0.8
0 5 10
Streamwisevelocity
Hydraulic Diamter
CFD
Experimental
Fig -7: Stream wise velocity profile in transverse direction
0
0.2
0.4
0.6
0.8
1
0 0.2 0.4 0.6 0.8 1
Temperature
hydraylic diameter
Along the curvature@Re6000
Experimental
CFD
Fig -8: Temperature Profile in transverse direction
5. CONCLUSIONS
Turbulent fluid flow and heat transfer characteristics in the
curved square duct is investigated numerically and
experimentally. All 3 dimensional components of velocities
are compared with each other and it is found that normal
components of velocities are in the range of 3-5% of axial
component. Velocity, temperature and Pressures are
measured at different cross section positions and validated
with experimental results at different Reynolds numbers.
And it is observed that velocities near concave wall regions
are higher compared to convex wall as the fluid has to travel
longer distance. Because of which more heat is beingcarried
away near the concave wall. Secondary flows which are
generated due to imbalance between the centrifugal force
and radial pressure gradients enhances the heat transfer by
carrying the heat from the near wall region to core cold
fluid. These Secondary motions intensity is higher near the
lateral walls and enhances mixing process of fluid which
increases the heat transfer rate
ACKNOWLEDGEMENT
All credit goes to the Supreme Personality of Godhead
‘Krishna’ and his devotees like Sri Vaishnava (Dr.Rahul
Trivedi) by their causeless mercy only I could complete this
work. Thank you my Lord.
REFERENCES
[1] Humphrey, J., Whitelaw, J., and Yee, G., 1981, Turbulent
flow in a square duct with strong curvature. J. Fluid
Mech. 103, pp. 443-463.
[2] Moin., P., 1998, Numerical and physical issues in large
eddy simulation of turbulent flows, JSME Int. J., Ser. B
41(2), pp 454 – 463.
[3] Germano., M., 1998, Fundamentals of large eddy
simulations. In: Advanced Turbulent Flow
Computations. Springer-Verlag, pp 1760-1765.
[4] Temmerman, L., Leschziner, M., A., Mellen, C., P., and
Frohlich., J., 2003, Investigation of wall-function
approximations and subgrid-scale models in large eddy
simulation of separated flow in a channel with](https://image.slidesharecdn.com/irjet-v4i7667-170915104359/75/Turbulent-Flow-in-Curved-Square-Duct-Prediction-of-Fluid-flow-and-Heat-transfer-Characteristics-4-2048.jpg)
![International Research Journal of Engineering and Technology (IRJET) e-ISSN: 2395-0056
Volume: 04 Issue: 07 | July -2017 www.irjet.net p-ISSN: 2395-0072
© 2017, IRJET | Impact Factor value: 5.181 | ISO 9001:2008 Certified Journal | Page 3368
streamwise periodic constrictions, Int. J. of Heat and
Fluid Flow, Vol. 24, pp 157-180.
[5] Ghosal, S., Lund T. S., Moin P., and Akselvoll, K., 1995, A
dynamic localization model for large-eddysimulationof
turbulent flows. J. Fluid Mech., 285, pp. 229 -255.
[6] Camarri, S., Salvetti, M. V., Koobus, B., and Dervieux, A.,
Large-eddy simulation of a bluff body flow on
unstructured grids. Int. J. Numer. Meth. Fluids, 2002,40,
pp.1431-1460.](https://image.slidesharecdn.com/irjet-v4i7667-170915104359/75/Turbulent-Flow-in-Curved-Square-Duct-Prediction-of-Fluid-flow-and-Heat-transfer-Characteristics-5-2048.jpg)

This document summarizes a study that used computational fluid dynamics (CFD) to numerically simulate and experimentally investigate turbulent flow and heat transfer characteristics in a curved square duct. Secondary flows were generated in the duct due to imbalances between centrifugal forces and radial pressure gradients. The SST K-ω turbulence model was used to simulate flow. It was found that secondary flow intensities were highest near duct walls and enhanced mixing and heat transfer. Temperature distributions were non-uniform across the duct due to higher velocities near the concave wall carrying away more heat. Numerical results agreed well with experimental measurements.