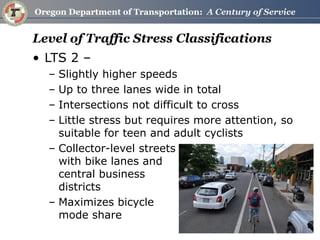
Bicycle Level of Traffic Stress A system connectivity methodology 
Jessica Horning 
Peter Schuytema, P.E. 
Pro Walk / Pro Bike / Pro Place 
September 9, 2014
Multimodal Analysis in APM
Level of Traffic Stress 
“Low Stress Bicycling and Network Connectivity”, Mineta Transportation Institute, Report 11-19, May 2012. 
•Classifies road segments based on perceived safety issues with close proximity to traffic. 
•Allows for quick assessment of system connectivity without burden of more intensive (MMLOS) methods. 
•Most data should be part of TSP inventories or easily obtainable. 
•Visual-based results for easy communication between staff, stakeholders, and the public.
Rider Groupings 
•Strong And Fearless (LTS 4) 
•Enthused and Confident (LTS 3) 
•Interested but Concerned (LTS 1 &2)
Level of Traffic Stress Classifications 
•LTS 1 – 
–Low speeds 
–No more than one lane per direction 
–Intersections easy to cross by all 
–Suitable for all cyclists, including 5th grade children and supervising riding parents 
–Residential local streets and separated paths
Level of Traffic Stress Classifications 
•LTS 2 – 
–Slightly higher speeds 
–Up to three lanes wide in total 
–Intersections not difficult to cross 
–Little stress but requires more attention, so suitable for teen and adult cyclists 
–Collector-level streets with bike lanes and central business districts 
–Maximizes bicycle mode share
Level of Traffic Stress Classifications 
•LTS 3 – 
–Moderate speeds 
–Up to five lanes of total width 
–Intersection crossings still perceived safe 
–Moderate stress – tolerable for many cyclists 
–Low speed arterials with bike lanes or moderate speed two/three-lane roadways
Level of Traffic Stress Classifications 
•LTS 4 – 
–Moderate to high speeds 
–From two to greater than five lanes 
–Intersections may be judged unsafe or difficult to cross 
–High-speed/multilane roadways with narrow or no bike lanes 
–High stress –suitable for experienced or skilled cyclists
The LTS Methodology Covers: 
•Segments 
•Intersection approaches and crossings 
•Measurement of “true” connectivity (beyond just filling facility gaps) 
•Ability to prioritize improvements
ODOT Method Modifications 
“Low Stress Bicycling and Network Connectivity”, Mineta Transportation Institute, Report 11-19, May 2012. 
•Reformatted tables to remove inconsistencies 
• Impact of left turn lanes on bicycle routing 
•Added considerations for buffered bike lanes and shared-lane markings 
•More flexibility on outside rider factors – hills, pavement condition, driveway density, etc. 
•Rural application using volumes and shoulder width
General Data Needs 
•Posted speed or prevailing speed 
•Number of lanes per direction 
•Bike lane/parking widths 
•Bike lane blockage frequency 
•Turn lane configurations 
•Daily volumes (rural only) 
•Shoulder width (rural only)
Stress Mapping 
•GIS or travel demand model-based 
•Color-coding by stress level quickly shows “connectivity islands” caused by barriers. 
–Arterials, railroads, waterways, street grid breaks 
•Allows for analysis of bicycle mode share splits. 
•Potential connectivity performance measures 
–Percent Trips (or Points) Connected at any given LTS
Application to Salem: 
Overall Stress Levels – Salem, OR
Salem Application: LOS 1 & 2 Islands With Downtown Highlighted
Oregon Household Activity Survey (OHAS): Household Bicycle Trip Counts Over Salem’s Low-Stress Network 
Legend:
Irrigon Bicycle, Pedestrian and Transit TSP Update
Questions? 
For more information on the original methodology, go to: 
http://transweb.sjsu.edu/project/1005.html 
Soon to be published in ODOT’s Analysis Procedure Manual V2: 
http://www.oregon.gov/ODOT/TD/TP/Pages/APM.aspx

Settling the Score: Street Performance Measures-Bicycle Level of Traffic Stress

  • 1.
    Bicycle Level ofTraffic Stress A system connectivity methodology Jessica Horning Peter Schuytema, P.E. Pro Walk / Pro Bike / Pro Place September 9, 2014
  • 2.
  • 3.
    Level of TrafficStress “Low Stress Bicycling and Network Connectivity”, Mineta Transportation Institute, Report 11-19, May 2012. •Classifies road segments based on perceived safety issues with close proximity to traffic. •Allows for quick assessment of system connectivity without burden of more intensive (MMLOS) methods. •Most data should be part of TSP inventories or easily obtainable. •Visual-based results for easy communication between staff, stakeholders, and the public.
  • 4.
    Rider Groupings •StrongAnd Fearless (LTS 4) •Enthused and Confident (LTS 3) •Interested but Concerned (LTS 1 &2)
  • 5.
    Level of TrafficStress Classifications •LTS 1 – –Low speeds –No more than one lane per direction –Intersections easy to cross by all –Suitable for all cyclists, including 5th grade children and supervising riding parents –Residential local streets and separated paths
  • 6.
    Level of TrafficStress Classifications •LTS 2 – –Slightly higher speeds –Up to three lanes wide in total –Intersections not difficult to cross –Little stress but requires more attention, so suitable for teen and adult cyclists –Collector-level streets with bike lanes and central business districts –Maximizes bicycle mode share
  • 7.
    Level of TrafficStress Classifications •LTS 3 – –Moderate speeds –Up to five lanes of total width –Intersection crossings still perceived safe –Moderate stress – tolerable for many cyclists –Low speed arterials with bike lanes or moderate speed two/three-lane roadways
  • 8.
    Level of TrafficStress Classifications •LTS 4 – –Moderate to high speeds –From two to greater than five lanes –Intersections may be judged unsafe or difficult to cross –High-speed/multilane roadways with narrow or no bike lanes –High stress –suitable for experienced or skilled cyclists
  • 9.
    The LTS MethodologyCovers: •Segments •Intersection approaches and crossings •Measurement of “true” connectivity (beyond just filling facility gaps) •Ability to prioritize improvements
  • 10.
    ODOT Method Modifications “Low Stress Bicycling and Network Connectivity”, Mineta Transportation Institute, Report 11-19, May 2012. •Reformatted tables to remove inconsistencies • Impact of left turn lanes on bicycle routing •Added considerations for buffered bike lanes and shared-lane markings •More flexibility on outside rider factors – hills, pavement condition, driveway density, etc. •Rural application using volumes and shoulder width
  • 11.
    General Data Needs •Posted speed or prevailing speed •Number of lanes per direction •Bike lane/parking widths •Bike lane blockage frequency •Turn lane configurations •Daily volumes (rural only) •Shoulder width (rural only)
  • 12.
    Stress Mapping •GISor travel demand model-based •Color-coding by stress level quickly shows “connectivity islands” caused by barriers. –Arterials, railroads, waterways, street grid breaks •Allows for analysis of bicycle mode share splits. •Potential connectivity performance measures –Percent Trips (or Points) Connected at any given LTS
  • 13.
    Application to Salem: Overall Stress Levels – Salem, OR
  • 14.
    Salem Application: LOS1 & 2 Islands With Downtown Highlighted
  • 15.
    Oregon Household ActivitySurvey (OHAS): Household Bicycle Trip Counts Over Salem’s Low-Stress Network Legend:
  • 16.
    Irrigon Bicycle, Pedestrianand Transit TSP Update
  • 17.
    Questions? For moreinformation on the original methodology, go to: http://transweb.sjsu.edu/project/1005.html Soon to be published in ODOT’s Analysis Procedure Manual V2: http://www.oregon.gov/ODOT/TD/TP/Pages/APM.aspx