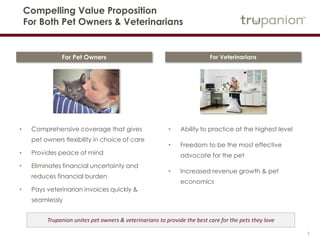
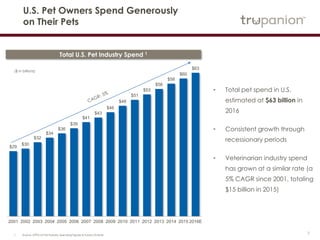
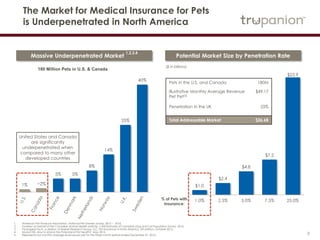
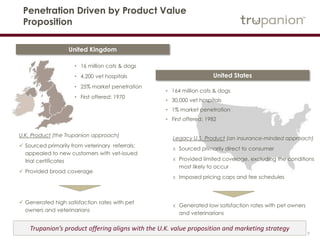
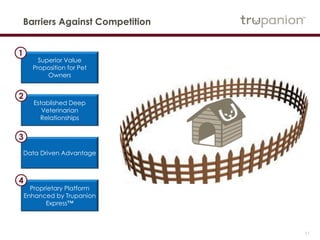
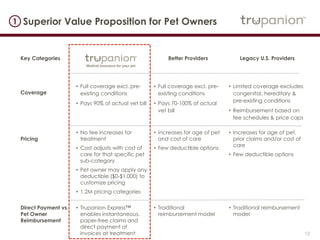
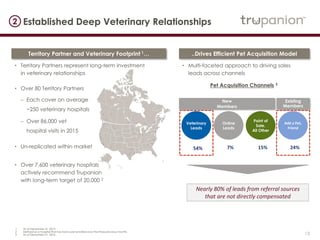
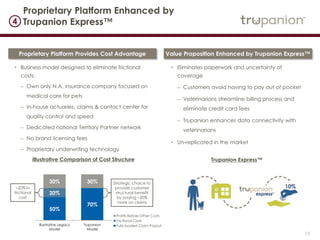
Trupanion Investor Presentation
March 2017
2
Legal Disclaimers
This presentation contains forward-looking statements within the meaning of Section 27A of the Securities Act of 1933 and Section 21E
of the Securities Exchange Act of 1934 relating to, among other things, expectations, plans, prospects and financial results for Trupanion,
including, but not limited to, its expectations regarding its ability to execute its business plans and financial objectives and its future
operating results and expenditures. These forward-looking statements are based upon the current expectations and beliefs of
Trupanion’s management as of the date of this press release, and are subject to certain risks and uncertainties that could cause actual
results to differ materially from those described in the forward-looking statements. All forward-looking statements made in this press
release are based on information available to Trupanion as of the date hereof, and Trupanion has no obligation to update these forward-
looking statements.
In particular, the following factors, among others, could cause results to differ materially from those expressed or implied by such
forward-looking statements: the ability to achieve or maintain profitability and/or appropriate levels of cash flow in future periods; the
accuracy of assumptions used in determining appropriate member acquisition expenditures; the severity and frequency of claims; the
ability to maintain high retention rates; the accuracy of assumptions used in pricing medical plan subscriptions and the ability to
accurately estimate the impact of new products or offerings on claims frequency; actual claims expense exceeding estimates; regulatory
and other constraints on the ability to institute, or the decision to otherwise delay, pricing modifications in response to changes in actual
or estimated claims expense; the effectiveness and statutory or regulatory compliance of our Territory Partner model and of our Territory
Partners, veterinarians and other third parties in recommending medical plan subscriptions to potential members; the ability to increase
the number of Territory Partners and active hospitals; compliance by us and those referring us members with laws and regulations that
apply to our business, including the sale of a pet medical plan; fluctuations in the Canadian currency exchange rate; the ability to protect
our proprietary and member information; the ability to maintain our culture and team; the ability to maintain the requisite amount of risk-
based capital; the ability to protect and enforce Trupanion’s intellectual property rights; third-party claims including litigation and
regulatory actions; and the ability to recognize benefits from investments in new solutions and enhancements to Trupanion’s technology
platform and website.
For a detailed discussion of these and other cautionary statements, please refer to the risk factors discussed in filings with the Securities
and Exchange Commission (SEC), including but not limited to, Trupanion’s Annual Report on Form 10-K for the year ended December
31, 2016 and any subsequently filed reports on Forms 10-Q and 8-K. All documents are available through the SEC’s Electronic Data
Gathering Analysis and Retrieval system at www.sec.gov or the Investor Relations section of Trupanion’s website at
http://investors.trupanion.com.
In addition to U.S. GAAP financials, this presentation includes certain non-GAAP financial measures. These non-GAAP measures are in
addition to, not a substitute for or superior to, measures of financial performance prepared in accordance with U.S. GAAP. A
reconciliation of non-GAAP financial measures to the corresponding GAAP measures is provided on our Investor Relations website.
3
Our Mission
Our mission is to help the
pets we all love receive
the best veterinary care
4
Trupanion at a Glance
• Pure-play focused on simple, fair and high-value
medical insurance for pets
• Comprehensive, lifelong coverage for dogs and cats,
including hereditary and congenital conditions (i.e., the
most likely conditions to occur)
• Pet owners are free to choose any veterinarian,
emergency care, or specialty hospital
• 90% of covered veterinary costs as invoiced, with no
payout limits
• Individual pets are not penalized for needing treatment
or getting older
• Veterinarians can be paid directly, and nearly
instantaneously with Trupanion Express™
Driving Category Growth
37
Consecutive Quarters of
25%+ Revenue Growth
98.60%
Average Monthly Retention 2
Strong Member Loyalty
36%
Total Revenue
5-year CAGR 1
1 As of 12/31/16.
2 For the 12-month period ended 12/31/2016. Average monthly retention is calculated as the monthly retention rate of enrolled pets for each applicable period averaged over the 12 months prior to the period end date.
5
Compelling Value Proposition
For Both Pet Owners & Veterinarians
• Comprehensive coverage that gives pet
owners flexibility in choice of care
• Provides peace of mind
• Eliminates financial uncertainty and
reduces financial burden
• Pays veterinarian invoices quickly &
seamlessly
• Ability to practice at the highest level
• Freedom to be the most effective
advocate for the pet
• Increased revenue growth & pet
economics
For Pet Owners For Veterinarians
Trupanion unites pet owners & veterinarians to provide the best care for the pets they love
6
Predictable High Growth Subscription Model
$3.1
$4.4
$5.3
$6.3
$7.6
$8.8
$9.9
$10.7
$12.0
$13.2
$14.5
$15.9
$17.8
$19.8
$22.1
$24.0
$25.6
$28.1
$30.3
$31.9
$33.3
$35.6
$37.9
$40.2
$42.7
$45.8
$48.4
$51.3
$0
$10.0
$20.0
$30.0
$40.0
$50.0
$60.0
Q1
'10
Q2
'10
Q3
'10
Q4
'10
Q1
'11
Q2
'11
Q3
'11
Q4
'11
Q1
'12
Q2
'12
Q3
'12
Q4
'12
Q1
'13
Q2
'13
Q3
'13
Q4
'13
Q1
'14
Q2
'14
Q3
'14
Q4
'14
Q1
'15
Q2
'15
Q3
'15
Q4
'15
Q1
'16
Q2
'16
Q3
'16
Q4
'16
Total Revenue by New vs. Existing Pets
(dollars, in millions)
Existing Pets New Pets
7
$29
$30
$32
$34
$36
$39
$41
$43
$46
$48
$51
$53
$56
$58
$60
$63
2001 2002 2003 2004 2005 2006 2007 2008 2009 2010 2011 2012 2013 2014 2015 2016E
• Total pet spend in U.S.
estimated at $63 billion in 2016
• Consistent growth through
recessionary periods
• Veterinarian industry spend has
grown at a similar rate (a 5%
CAGR since 2001, totaling $15
billion in 2015)
Total U.S. Pet Industry Spend 1
U.S. Pet Owners Spend Generously
on Their Pets
($ in billions)
1 Source: APPA US Pet Industry Spending Figures & Future Outlook
8
1% ~2%
5% 5%
8%
14%
25%
40%
The Market for Medical Insurance for Pets
is Underpenetrated in North America
1 American Pet Products Association, National Pet Owners Survey, 2015 – 2016.
2 Kynetec on behalf of the Canadian Animal Health Institute, CAHI Estimate of Canadian Dog and Cat Population Survey, 2016.
3 Packaged Facts, a division of Market Research Group, LLC, Pet Insurance in North America, 5th Edition, October 2013.
4 Munich RE, How to Unlock the Potential of Pet Health?, May 2013.
5 Represents our monthly average revenue per pet for the three month period ended December 31, 2016.
Massive Underpenetrated Market
1,2,3,4
180 Million Pets in U.S. & Canada
$1.0
$2.4
$4.8
$7.2
$23.9
1.0% 2.5% 5.0% 7.5% 25.0%% of Pets
with
Insurance:
United States and Canada
are significantly
underpenetrated when
compared to many other
developed countries
Potential Market Size by Penetration Rate
Pets in the U.S. and Canada 180M
Illustrative Monthly Average Revenue Pet
Pet(5)
Penetration in the UK
$49.17
25%
Total Addressable Market $26.6B
($ in billions)
9
• 16 million cats & dogs
• 4,200 vet hospitals
• 25% market penetration
• First offered: 1970
United Kingdom
United States
• 164 million cats & dogs
• 30,000 vet hospitals
• 1% market penetration
• First offered: 1982
U.K. Product (the Trupanion approach)
 Sourced primarily from veterinary referrals;
appealed to new customers with vet-issued trial
certificates
 Provided broad coverage
 Generated high satisfaction rates with pet
owners and veterinarians
Legacy U.S. Product (an insurance-minded approach)
х Sourced primarily direct to consumer
х Provided limited coverage, excluding the conditions most
likely to occur
х Imposed pricing caps and fee schedules
х Generated low satisfaction rates with pet owners and
veterinarians
Penetration Driven by Product Value
Proposition
Trupanion’s product offering aligns with the U.K. value proposition and marketing strategy
10
Attractive Trupanion Adoption & Economics
in Relatively Established Markets
• Region of Western Canada (entered 2003)
• Territory Partner presence for >10 years
• Human population of ~2.7 million
• Cats & dogs population of ~1.3 million
• >18,000 Trupanion enrolled pets1
• High penetration rates:
− 2/3rd active hospital base1,2
− Quotes generated each month equal to ~25% of
estimated number of pets acquired2
− ~5% of new pets enrolling with TRUP each
month1
• Accelerated growth:
− Annual pet growth > 20%3
− Annual revenue growth > 30%3
• Attractive economics:
− LVP to PAC > 5:11
Regional Case Study Analysis
Trupanion issued first policy in Canada in 2000 and first policy in the U.S. in 2008
1 For the period ended June 30, 2015.
2 Defined as a hospital that has had a pet enrolled over the three previous months
3 For the annual period ended December 31, 2014.
The above numbers are as of Q2 2015. For competitive reasons, we are not providing ongoing disclosure of this cohort.
11
Barriers Against Competition
Superior Value Proposition
for Pet Owners
Established Deep
Veterinarian Relationships
Data Driven Advantage
Proprietary Platform
Enhanced by Trupanion
Express™
1
2
3
4
12
Superior Value Proposition for Pet Owners1
Key Categories Better Providers Legacy U.S. Providers
Coverage
• Full coverage excl. pre-
existing conditions
• Pays 90% of actual vet bill
• Full coverage excl. pre-
existing conditions
• Pays 70-100% of actual
vet bill
• Limited coverage excludes
congenital, hereditary & pre-
existing conditions
• Reimbursement based on fee
schedules & price caps
Pricing
• No fee increases for
treatment
• Cost adjusts with cost of
care for that specific pet
sub-category
• Pet owner may apply any
deductible ($0-$1,000) to
customize pricing
• Millions of pricing categories
• Increases for age of pet
and cost of care
• Few deductible options
• Increases for age of pet, prior
claims and/or cost of care
• Few deductible options
Direct Payment vs.
Pet Owner
Reimbursement
• Trupanion Express™
enables instantaneous,
paper-free claims and direct
payment of invoices at
treatment
• Traditional reimbursement
model
• Traditional reimbursement
model
13
Established Deep Veterinary Relationships
Territory Partner and Veterinary Footprint 1…
• Territory Partners represent long-term investment in
veterinary relationships
• Over 80 Territory Partners
– Each cover on average
~250 veterinary hospitals
– Over 86,000 vet hospital
visits in 2015
• Un-replicated within market
• Over 7,600 veterinary hospitals actively
recommend Trupanion with long-term
target of 20,000 2
2
..Drives Efficient Pet Acquisition Model
• Multi-faceted approach to driving sales leads
across channels
Pet Acquisition Channels 3
7%54% 15%
Veterinary
Leads
Online
Leads
Point of
Sale,
All Other
24%
Add a
Pet,
Friend
Existing
Members
New
Members
Nearly 80% of leads from referral sources
that are not directly compensated
1 As of December 31, 2015
2 Defined as a hospital that has had a pet enrolled over the three previous months
3 As of December 31, 2016
14
Expected Claim per Pet per Month Other
• Millions of pricing categories
• Over 10 million medical plan months
• Over 1.5 million claims received
• Breed, postal code and age among the
pricing categories used to measure risk
Extensive data amassed over 16 years provides significant competitive advantages
Illustrative Pricing Examples
3 Data Driven Advantage
1 All data as of December 31, 2016
Comprehensive data helps us
understand the risk of each pet and
add a 30% margin $26.85
$39.78
$57.31
$65.88$11.51
$17.05
$24.56
$28.23
$38.36
$56.83
$81.87
$94.11
Cat Dog English Bulldog English Bulldog in NY
15
• Business model designed to eliminate frictional costs:
– Own only N.A. insurance company focused on
medical care for pets
– In-house actuaries, claims & contact center for
quality control and speed
– Dedicated national Territory Partner network
– No brand licensing fees
– Proprietary underwriting technology
50%
70%
20%
30% 30%
Illustrative Legacy
Model
Trupanion
Model
Profits Before Other Costs
Frictional Costs
Fully-loaded Claim Payout
4
Proprietary Platform Enhanced by
Trupanion Express™
~20% in
frictional
cost
Strategic choice to
provide customer
structural benefit by
paying ~20% more
on claims
Proprietary Platform Provides Cost Advantage
Value Proposition Enhanced by Trupanion
Express™
• Eliminates paperwork and uncertainty of coverage
– Customers avoid having to pay out of pocket
– Veterinarians streamline billing process and eliminate
credit card fees
– Trupanion enhances data connectivity with
veterinarians
• Un-replicated in the market
Trupanion Express™Illustrative Comparison of Cost Structure
16
Our Mission Driven Model Resonates with
Third Parties
“I had the opportunity to meet with a broad cross section of
Trupanion’s people in Seattle… What I experienced was a
group of people who are confident, ambitious, energized
and, above all, purpose driven.”
– Robert Vinall, RV Capital, quote from his annual investor
letter
“In Trupanion’s case, it is easy to underestimate how important
trust will be in shaping the Industry… trust must be continuously
earned by being deserved…which is expressed as a mission-
driven culture.”
– Josh Tarasoff, Greenlea Lane Capital Partners, quote from his
annual investor letter
Financial Review
18
Compelling Financial Model
• High growth business capturing underpenetrated market
• Monthly subscription model with recurring and visible revenues
• Strong lifetime value and proven customer unit economics
• Attractive long-term margin profile
19
57
89
127
182
232
292
344
12/31/10 12/31/11 12/31/12 12/31/13 12/31/2014 12/31/2015 12/31/2016
$37
$55
$77
$104
$134
$173
$7
$12
$14
$15
2011 2012 2013 2014 2015 2016
Subscription Revenue Other Revenue
Member-Centric Approach Driving Growth
Total Enrolled Pets 1 Total Revenue 2
(in thousands)
18% YOY
Growth
28% YOY
Growth
$37
$56
$84
$116
$147
($ in millions)
1 Cumulative as of December 31st for each respective year from 2010 to 2016
2 Includes subscription business segment and other business segment. Other business segment primarily includes revenue from plans not marketed directly to consumers
$188
20
Annual Cash Flow from Illustrative Member 1 Cumulative Cash Flow from Illustrative Member 1
FY 2016
5.1X
LVP to PAC
2, 3
LV
P
PAC
Near Term Investment Drives Long Term
Cash Flows
Breakeven in
~15 months
1 Based on lifetime value of a pet and average pet acquisition cost as of December 31, 2016 in subscription business segment.
2 Lifetime value of a pet (LVP) is calculated in part based on gross profit from our subscription business segment for the 12 months prior to the period end date excluding stock-based compensation expense related to cost of
revenue from our subscription business segment, sign-up fee revenue and the change in deferred revenue between periods, multiplied by the implied average subscriber life in months.
3 Pet acquisition cost (PAC) is calculated as net acquisition cost divided by the total number of new subscription pets enrolled in that period. Net acquisition cost, a non-GAAP financial measure, is calculated in a reporting period
as sales and marketing expenses, excluding stock-based compensation, offset by sign-up fee revenue and other business segment sales and marketing expenses.
Marketing costs are expensed up front while revenue is realized over the life of the member
($123)
($150)
($100)
($50)
$0
$50
$100
$150
Year 0 Year 1 Year 2 Year 3 Year 4 Year 5 Year 6 Year 7
($123)
($200)
($100)
$0
$100
$200
$300
$400
$500
$600
Year 0 Year 1 Year 2 Year 3 Year 4 Year 5 Year 6 Year 7
21
Attractive Long Term Margin Profile
1 In 2016, the fixed expenses were comprised of 7% G&A and 3% Core IT. In 2015, the fixed expenses were comprised of 9% G&A, 4% Core IT and 2% related to our Direct Pay Initiative. In 2014, the fixed expenses were
comprised of 10% G&A, 4% Core IT and 3% related to our Direct Pay Initiative.
% of Revenue 2012 2013 2014 2015 2016 Q1 2016 Q2 2016 Q3 2016 Q4 2016
Long-Term
Target
Revenues 100% 100% 100% 100% 100% 100% 100% 100% 100% 100%
Cost of goods 68% 67% 69% 70% 71% 72% 71% 71% 70% 70%
Variable expenses 12% 14% 14% 12% 11% 11% 11% 12% 11% 10%
Fixed expenses (1) 15% 14% 17% 15% 10% 11% 10% 9% 10% 5%
Adjusted operating margin 5.3% 5.1% 0.7% 2.4% 7.9% 6.3% 8.6% 8.4% 8.1% 15%
Acquisition cost 12% 10% 10% 10% 8% 9% 7% 8% 7%
Adjusted EBITDA -7% -5% -9% -8% 0% -2% 1% 1% 1%
Net loss -12% -10% -18% -12% -4% -6% -2% -3% -3%
Free cash flow (in thousands) (3,598)$ (2,496)$ (16,434)$ (15,319)$ 3,065$ (1,951)$ 1,121$ 852$ 3,043$
Thank You

Trup power point presentation (roth - 3-13-17)

  • 1.
  • 2.
    2 Legal Disclaimers This presentationcontains forward-looking statements within the meaning of Section 27A of the Securities Act of 1933 and Section 21E of the Securities Exchange Act of 1934 relating to, among other things, expectations, plans, prospects and financial results for Trupanion, including, but not limited to, its expectations regarding its ability to execute its business plans and financial objectives and its future operating results and expenditures. These forward-looking statements are based upon the current expectations and beliefs of Trupanion’s management as of the date of this press release, and are subject to certain risks and uncertainties that could cause actual results to differ materially from those described in the forward-looking statements. All forward-looking statements made in this press release are based on information available to Trupanion as of the date hereof, and Trupanion has no obligation to update these forward- looking statements. In particular, the following factors, among others, could cause results to differ materially from those expressed or implied by such forward-looking statements: the ability to achieve or maintain profitability and/or appropriate levels of cash flow in future periods; the accuracy of assumptions used in determining appropriate member acquisition expenditures; the severity and frequency of claims; the ability to maintain high retention rates; the accuracy of assumptions used in pricing medical plan subscriptions and the ability to accurately estimate the impact of new products or offerings on claims frequency; actual claims expense exceeding estimates; regulatory and other constraints on the ability to institute, or the decision to otherwise delay, pricing modifications in response to changes in actual or estimated claims expense; the effectiveness and statutory or regulatory compliance of our Territory Partner model and of our Territory Partners, veterinarians and other third parties in recommending medical plan subscriptions to potential members; the ability to increase the number of Territory Partners and active hospitals; compliance by us and those referring us members with laws and regulations that apply to our business, including the sale of a pet medical plan; fluctuations in the Canadian currency exchange rate; the ability to protect our proprietary and member information; the ability to maintain our culture and team; the ability to maintain the requisite amount of risk- based capital; the ability to protect and enforce Trupanion’s intellectual property rights; third-party claims including litigation and regulatory actions; and the ability to recognize benefits from investments in new solutions and enhancements to Trupanion’s technology platform and website. For a detailed discussion of these and other cautionary statements, please refer to the risk factors discussed in filings with the Securities and Exchange Commission (SEC), including but not limited to, Trupanion’s Annual Report on Form 10-K for the year ended December 31, 2016 and any subsequently filed reports on Forms 10-Q and 8-K. All documents are available through the SEC’s Electronic Data Gathering Analysis and Retrieval system at www.sec.gov or the Investor Relations section of Trupanion’s website at http://investors.trupanion.com. In addition to U.S. GAAP financials, this presentation includes certain non-GAAP financial measures. These non-GAAP measures are in addition to, not a substitute for or superior to, measures of financial performance prepared in accordance with U.S. GAAP. A reconciliation of non-GAAP financial measures to the corresponding GAAP measures is provided on our Investor Relations website.
  • 3.
    3 Our Mission Our missionis to help the pets we all love receive the best veterinary care
  • 4.
    4 Trupanion at aGlance • Pure-play focused on simple, fair and high-value medical insurance for pets • Comprehensive, lifelong coverage for dogs and cats, including hereditary and congenital conditions (i.e., the most likely conditions to occur) • Pet owners are free to choose any veterinarian, emergency care, or specialty hospital • 90% of covered veterinary costs as invoiced, with no payout limits • Individual pets are not penalized for needing treatment or getting older • Veterinarians can be paid directly, and nearly instantaneously with Trupanion Express™ Driving Category Growth 37 Consecutive Quarters of 25%+ Revenue Growth 98.60% Average Monthly Retention 2 Strong Member Loyalty 36% Total Revenue 5-year CAGR 1 1 As of 12/31/16. 2 For the 12-month period ended 12/31/2016. Average monthly retention is calculated as the monthly retention rate of enrolled pets for each applicable period averaged over the 12 months prior to the period end date.
  • 5.
    5 Compelling Value Proposition ForBoth Pet Owners & Veterinarians • Comprehensive coverage that gives pet owners flexibility in choice of care • Provides peace of mind • Eliminates financial uncertainty and reduces financial burden • Pays veterinarian invoices quickly & seamlessly • Ability to practice at the highest level • Freedom to be the most effective advocate for the pet • Increased revenue growth & pet economics For Pet Owners For Veterinarians Trupanion unites pet owners & veterinarians to provide the best care for the pets they love
  • 6.
    6 Predictable High GrowthSubscription Model $3.1 $4.4 $5.3 $6.3 $7.6 $8.8 $9.9 $10.7 $12.0 $13.2 $14.5 $15.9 $17.8 $19.8 $22.1 $24.0 $25.6 $28.1 $30.3 $31.9 $33.3 $35.6 $37.9 $40.2 $42.7 $45.8 $48.4 $51.3 $0 $10.0 $20.0 $30.0 $40.0 $50.0 $60.0 Q1 '10 Q2 '10 Q3 '10 Q4 '10 Q1 '11 Q2 '11 Q3 '11 Q4 '11 Q1 '12 Q2 '12 Q3 '12 Q4 '12 Q1 '13 Q2 '13 Q3 '13 Q4 '13 Q1 '14 Q2 '14 Q3 '14 Q4 '14 Q1 '15 Q2 '15 Q3 '15 Q4 '15 Q1 '16 Q2 '16 Q3 '16 Q4 '16 Total Revenue by New vs. Existing Pets (dollars, in millions) Existing Pets New Pets
  • 7.
    7 $29 $30 $32 $34 $36 $39 $41 $43 $46 $48 $51 $53 $56 $58 $60 $63 2001 2002 20032004 2005 2006 2007 2008 2009 2010 2011 2012 2013 2014 2015 2016E • Total pet spend in U.S. estimated at $63 billion in 2016 • Consistent growth through recessionary periods • Veterinarian industry spend has grown at a similar rate (a 5% CAGR since 2001, totaling $15 billion in 2015) Total U.S. Pet Industry Spend 1 U.S. Pet Owners Spend Generously on Their Pets ($ in billions) 1 Source: APPA US Pet Industry Spending Figures & Future Outlook
  • 8.
    8 1% ~2% 5% 5% 8% 14% 25% 40% TheMarket for Medical Insurance for Pets is Underpenetrated in North America 1 American Pet Products Association, National Pet Owners Survey, 2015 – 2016. 2 Kynetec on behalf of the Canadian Animal Health Institute, CAHI Estimate of Canadian Dog and Cat Population Survey, 2016. 3 Packaged Facts, a division of Market Research Group, LLC, Pet Insurance in North America, 5th Edition, October 2013. 4 Munich RE, How to Unlock the Potential of Pet Health?, May 2013. 5 Represents our monthly average revenue per pet for the three month period ended December 31, 2016. Massive Underpenetrated Market 1,2,3,4 180 Million Pets in U.S. & Canada $1.0 $2.4 $4.8 $7.2 $23.9 1.0% 2.5% 5.0% 7.5% 25.0%% of Pets with Insurance: United States and Canada are significantly underpenetrated when compared to many other developed countries Potential Market Size by Penetration Rate Pets in the U.S. and Canada 180M Illustrative Monthly Average Revenue Pet Pet(5) Penetration in the UK $49.17 25% Total Addressable Market $26.6B ($ in billions)
  • 9.
    9 • 16 millioncats & dogs • 4,200 vet hospitals • 25% market penetration • First offered: 1970 United Kingdom United States • 164 million cats & dogs • 30,000 vet hospitals • 1% market penetration • First offered: 1982 U.K. Product (the Trupanion approach)  Sourced primarily from veterinary referrals; appealed to new customers with vet-issued trial certificates  Provided broad coverage  Generated high satisfaction rates with pet owners and veterinarians Legacy U.S. Product (an insurance-minded approach) х Sourced primarily direct to consumer х Provided limited coverage, excluding the conditions most likely to occur х Imposed pricing caps and fee schedules х Generated low satisfaction rates with pet owners and veterinarians Penetration Driven by Product Value Proposition Trupanion’s product offering aligns with the U.K. value proposition and marketing strategy
  • 10.
    10 Attractive Trupanion Adoption& Economics in Relatively Established Markets • Region of Western Canada (entered 2003) • Territory Partner presence for >10 years • Human population of ~2.7 million • Cats & dogs population of ~1.3 million • >18,000 Trupanion enrolled pets1 • High penetration rates: − 2/3rd active hospital base1,2 − Quotes generated each month equal to ~25% of estimated number of pets acquired2 − ~5% of new pets enrolling with TRUP each month1 • Accelerated growth: − Annual pet growth > 20%3 − Annual revenue growth > 30%3 • Attractive economics: − LVP to PAC > 5:11 Regional Case Study Analysis Trupanion issued first policy in Canada in 2000 and first policy in the U.S. in 2008 1 For the period ended June 30, 2015. 2 Defined as a hospital that has had a pet enrolled over the three previous months 3 For the annual period ended December 31, 2014. The above numbers are as of Q2 2015. For competitive reasons, we are not providing ongoing disclosure of this cohort.
  • 11.
    11 Barriers Against Competition SuperiorValue Proposition for Pet Owners Established Deep Veterinarian Relationships Data Driven Advantage Proprietary Platform Enhanced by Trupanion Express™ 1 2 3 4
  • 12.
    12 Superior Value Propositionfor Pet Owners1 Key Categories Better Providers Legacy U.S. Providers Coverage • Full coverage excl. pre- existing conditions • Pays 90% of actual vet bill • Full coverage excl. pre- existing conditions • Pays 70-100% of actual vet bill • Limited coverage excludes congenital, hereditary & pre- existing conditions • Reimbursement based on fee schedules & price caps Pricing • No fee increases for treatment • Cost adjusts with cost of care for that specific pet sub-category • Pet owner may apply any deductible ($0-$1,000) to customize pricing • Millions of pricing categories • Increases for age of pet and cost of care • Few deductible options • Increases for age of pet, prior claims and/or cost of care • Few deductible options Direct Payment vs. Pet Owner Reimbursement • Trupanion Express™ enables instantaneous, paper-free claims and direct payment of invoices at treatment • Traditional reimbursement model • Traditional reimbursement model
  • 13.
    13 Established Deep VeterinaryRelationships Territory Partner and Veterinary Footprint 1… • Territory Partners represent long-term investment in veterinary relationships • Over 80 Territory Partners – Each cover on average ~250 veterinary hospitals – Over 86,000 vet hospital visits in 2015 • Un-replicated within market • Over 7,600 veterinary hospitals actively recommend Trupanion with long-term target of 20,000 2 2 ..Drives Efficient Pet Acquisition Model • Multi-faceted approach to driving sales leads across channels Pet Acquisition Channels 3 7%54% 15% Veterinary Leads Online Leads Point of Sale, All Other 24% Add a Pet, Friend Existing Members New Members Nearly 80% of leads from referral sources that are not directly compensated 1 As of December 31, 2015 2 Defined as a hospital that has had a pet enrolled over the three previous months 3 As of December 31, 2016
  • 14.
    14 Expected Claim perPet per Month Other • Millions of pricing categories • Over 10 million medical plan months • Over 1.5 million claims received • Breed, postal code and age among the pricing categories used to measure risk Extensive data amassed over 16 years provides significant competitive advantages Illustrative Pricing Examples 3 Data Driven Advantage 1 All data as of December 31, 2016 Comprehensive data helps us understand the risk of each pet and add a 30% margin $26.85 $39.78 $57.31 $65.88$11.51 $17.05 $24.56 $28.23 $38.36 $56.83 $81.87 $94.11 Cat Dog English Bulldog English Bulldog in NY
  • 15.
    15 • Business modeldesigned to eliminate frictional costs: – Own only N.A. insurance company focused on medical care for pets – In-house actuaries, claims & contact center for quality control and speed – Dedicated national Territory Partner network – No brand licensing fees – Proprietary underwriting technology 50% 70% 20% 30% 30% Illustrative Legacy Model Trupanion Model Profits Before Other Costs Frictional Costs Fully-loaded Claim Payout 4 Proprietary Platform Enhanced by Trupanion Express™ ~20% in frictional cost Strategic choice to provide customer structural benefit by paying ~20% more on claims Proprietary Platform Provides Cost Advantage Value Proposition Enhanced by Trupanion Express™ • Eliminates paperwork and uncertainty of coverage – Customers avoid having to pay out of pocket – Veterinarians streamline billing process and eliminate credit card fees – Trupanion enhances data connectivity with veterinarians • Un-replicated in the market Trupanion Express™Illustrative Comparison of Cost Structure
  • 16.
    16 Our Mission DrivenModel Resonates with Third Parties “I had the opportunity to meet with a broad cross section of Trupanion’s people in Seattle… What I experienced was a group of people who are confident, ambitious, energized and, above all, purpose driven.” – Robert Vinall, RV Capital, quote from his annual investor letter “In Trupanion’s case, it is easy to underestimate how important trust will be in shaping the Industry… trust must be continuously earned by being deserved…which is expressed as a mission- driven culture.” – Josh Tarasoff, Greenlea Lane Capital Partners, quote from his annual investor letter
  • 17.
  • 18.
    18 Compelling Financial Model •High growth business capturing underpenetrated market • Monthly subscription model with recurring and visible revenues • Strong lifetime value and proven customer unit economics • Attractive long-term margin profile
  • 19.
    19 57 89 127 182 232 292 344 12/31/10 12/31/11 12/31/1212/31/13 12/31/2014 12/31/2015 12/31/2016 $37 $55 $77 $104 $134 $173 $7 $12 $14 $15 2011 2012 2013 2014 2015 2016 Subscription Revenue Other Revenue Member-Centric Approach Driving Growth Total Enrolled Pets 1 Total Revenue 2 (in thousands) 18% YOY Growth 28% YOY Growth $37 $56 $84 $116 $147 ($ in millions) 1 Cumulative as of December 31st for each respective year from 2010 to 2016 2 Includes subscription business segment and other business segment. Other business segment primarily includes revenue from plans not marketed directly to consumers $188
  • 20.
    20 Annual Cash Flowfrom Illustrative Member 1 Cumulative Cash Flow from Illustrative Member 1 FY 2016 5.1X LVP to PAC 2, 3 LV P PAC Near Term Investment Drives Long Term Cash Flows Breakeven in ~15 months 1 Based on lifetime value of a pet and average pet acquisition cost as of December 31, 2016 in subscription business segment. 2 Lifetime value of a pet (LVP) is calculated in part based on gross profit from our subscription business segment for the 12 months prior to the period end date excluding stock-based compensation expense related to cost of revenue from our subscription business segment, sign-up fee revenue and the change in deferred revenue between periods, multiplied by the implied average subscriber life in months. 3 Pet acquisition cost (PAC) is calculated as net acquisition cost divided by the total number of new subscription pets enrolled in that period. Net acquisition cost, a non-GAAP financial measure, is calculated in a reporting period as sales and marketing expenses, excluding stock-based compensation, offset by sign-up fee revenue and other business segment sales and marketing expenses. Marketing costs are expensed up front while revenue is realized over the life of the member ($123) ($150) ($100) ($50) $0 $50 $100 $150 Year 0 Year 1 Year 2 Year 3 Year 4 Year 5 Year 6 Year 7 ($123) ($200) ($100) $0 $100 $200 $300 $400 $500 $600 Year 0 Year 1 Year 2 Year 3 Year 4 Year 5 Year 6 Year 7
  • 21.
    21 Attractive Long TermMargin Profile 1 In 2016, the fixed expenses were comprised of 7% G&A and 3% Core IT. In 2015, the fixed expenses were comprised of 9% G&A, 4% Core IT and 2% related to our Direct Pay Initiative. In 2014, the fixed expenses were comprised of 10% G&A, 4% Core IT and 3% related to our Direct Pay Initiative. % of Revenue 2012 2013 2014 2015 2016 Q1 2016 Q2 2016 Q3 2016 Q4 2016 Long-Term Target Revenues 100% 100% 100% 100% 100% 100% 100% 100% 100% 100% Cost of goods 68% 67% 69% 70% 71% 72% 71% 71% 70% 70% Variable expenses 12% 14% 14% 12% 11% 11% 11% 12% 11% 10% Fixed expenses (1) 15% 14% 17% 15% 10% 11% 10% 9% 10% 5% Adjusted operating margin 5.3% 5.1% 0.7% 2.4% 7.9% 6.3% 8.6% 8.4% 8.1% 15% Acquisition cost 12% 10% 10% 10% 8% 9% 7% 8% 7% Adjusted EBITDA -7% -5% -9% -8% 0% -2% 1% 1% 1% Net loss -12% -10% -18% -12% -4% -6% -2% -3% -3% Free cash flow (in thousands) (3,598)$ (2,496)$ (16,434)$ (15,319)$ 3,065$ (1,951)$ 1,121$ 852$ 3,043$
  • 22.

Editor's Notes

  • #14 Need to updated with 2014 map
  • #15 TJ to double check the numbers here