- For the year ended December 31, 2016, Everi Holdings Inc. presented investor information including financial results and an overview of their games and payments segments.
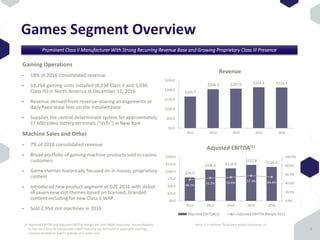
- The games segment saw $213.3 million in revenue in 2016 and $116.0 million in adjusted EBITDA, with a focus on Class II and proprietary Class III gaming machines.
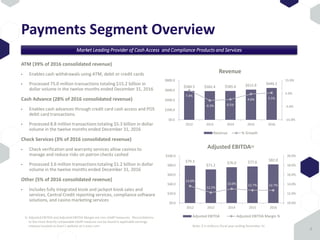
- The payments segment generated $646.2 million in revenue and $82.0 million in adjusted EBITDA in 2016 through ATM, cash advance, check services, and other products.
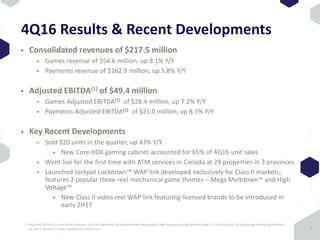
- Fourth quarter 2016 results showed continued growth with consolidated revenues up and increased unit sales, expansion to Canada, and a new Class II wide area progressive game.