The document provides an overview of Box's recent financial performance and outlook. Some key points:
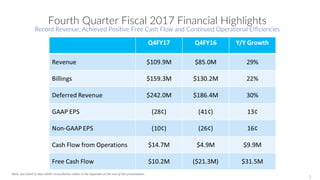
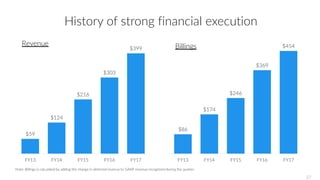
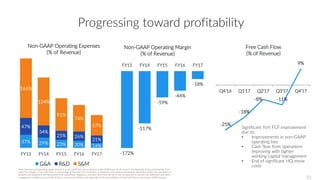
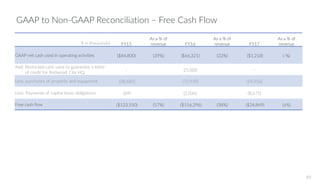
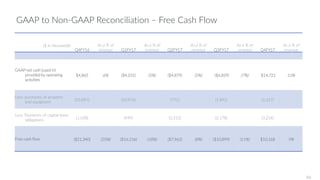
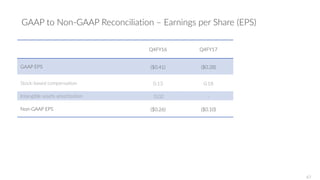
- In Q4 FY2017, Box achieved record revenue and positive free cash flow while continuing to improve operational efficiencies.
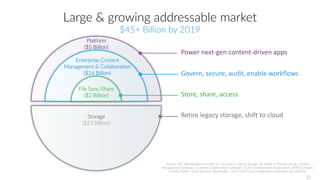
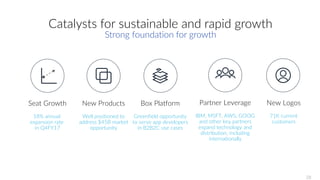
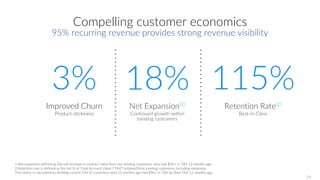
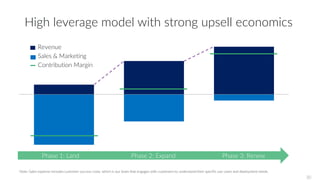
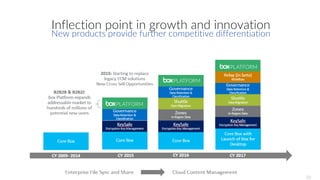
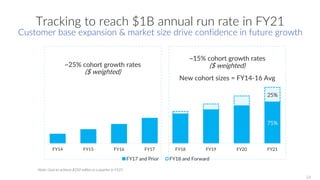
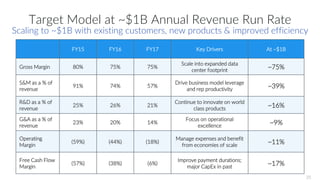
- Box is tracking to reach $1 billion in annual revenue run rate by FY2021 through expanding its existing customer base, new product introductions, and improved efficiency.
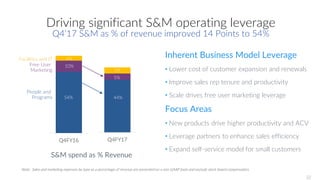
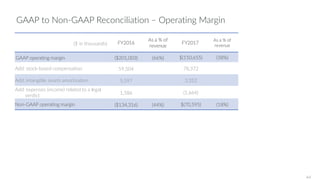
- Box's business model is expected to generate significant operating leverage as revenue scales, with sales and marketing expenses as a percentage of revenue declining to around 39% at a $1 billion revenue run rate.


![Q3 2022 DBX Investor Presentation v1 [TBU].pptx](https://cdn.slidesharecdn.com/ss_thumbnails/q32022dbxinvestorpresentationv1tbu-220926164154-0dda8e66-thumbnail.jpg?width=640&height=640&fit=bounds)
![Q3 2022 DBX Investor Presentation v1 [TBU].pptx](https://cdn.slidesharecdn.com/ss_thumbnails/q32022dbxinvestorpresentationv1tbu-220926164314-7b8f6da9-thumbnail.jpg?width=640&height=640&fit=bounds)


