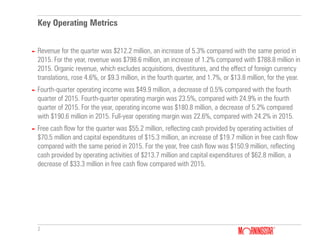
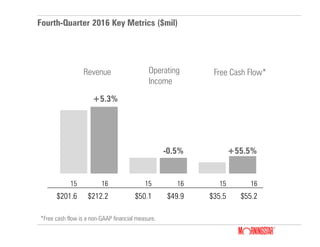
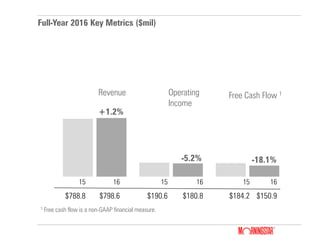
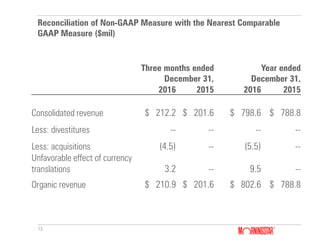
- Revenue for Q4 2016 was $212.2 million, up 5.3% year-over-year. Full-year revenue was $798.6 million, up 1.2% year-over-year.
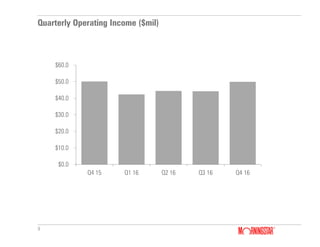
- Q4 2016 operating income was $49.9 million, down 0.5% year-over-year. Full-year operating income was $180.8 million, down 5.2% year-over-year.
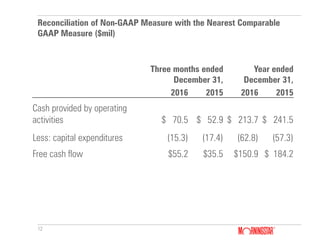
- Q4 2016 free cash flow was $55.2 million, up 55.5% year-over-year. Full-year free cash flow was $150.9 million, down 18.1% year-over-year.