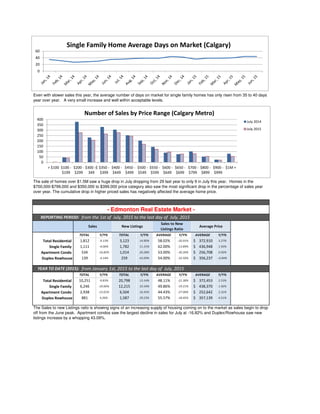
- Housing sales in Calgary decreased in July year-over-year, while new listings and active listings increased, improving market absorption. Attached home listings saw the largest year-over-year increase. The average single family home price in Calgary dropped to just over $545,000 in July.
- Sales of higher-priced homes ($700,000-$799,000 and over $1.5M) decreased the most, accounting for the erosion of Calgary's average home price. The average days on market for single family homes increased slightly from 35 to 40 days year-over-year.
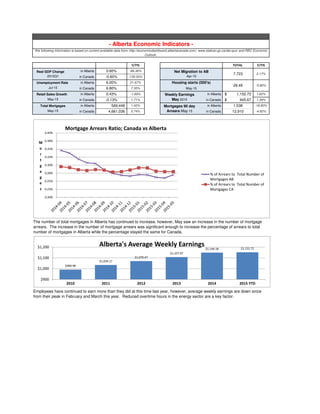
- Several Alberta economic indicators slowed in recent months, including GDP growth, retail sales, and weekly earnings, while unemployment
Calvert Home Mortgage Real Estate and Economic Report for September 2015Keith Uthe
This document summarizes real estate market conditions in Calgary and Edmonton in August 2015. In Calgary, average single-family home prices dropped below $545,000 and sales decreased most for homes priced between $200,000-$400,000. New listings growth slowed which helped support prices. In Edmonton, the number of days on market increased to 54 days. Mortgage arrears in Alberta remain lower than the previous 4 years despite a small rise in May-June. The Alberta and Canadian economies experienced modest growth, while oil prices and production decreased.
- Sales and new listings in the Fraser Valley region reached near record-setting levels in July 2020, with 2,100 sales (a 44% increase over July 2019) and 3,549 new listings (a 27% increase over July 2019).
- The strong demand is attributed to pent-up demand from the spring market and record-low interest rates, while low inventory levels are putting upward pressure on home prices in some communities.
- Benchmark home prices in July increased between 1-5% compared to July 2019 across detached homes, townhomes, and apartments in the region.
Fraser Valley Real Estate Board Stats Package Feb 2021Vicky Aulakh
- In February 2021, the Fraser Valley real estate market saw record property sales of 2,815, an increase of 108% from February 2020. This was the sixth consecutive month of record-breaking sales.
- The average number of days to sell a single-family home or townhome was 21 days, while apartments took an average of 35 days to sell.
- Benchmark home prices across property types increased from January 2021, with single-family detached homes seeing the largest increase of 5.1%. Inventory remained low due to high demand and a lack of new listings entering the market.
Calvert Home Mortgage Real Estate & Economic Report December 2015Keith Uthe
Calvert Home Mortgage provides a simplified breakdown of statistics and and information from the Calgary and Edmonton real estate markets and how they are affecting current home prices. You will also find the most recent statistics available for key Economic Fundamentals that influence the lending industry and real estate markets in Alberta.
Calvert Home Mortgage Economic Report May 31 2015Keith Uthe
Calvert Home Mortgage provides a simplified breakdown of statistics and and information from the Calgary and Edmonton real estate markets and how they are affecting current home prices. You will also find the most recent statistics available for key Economic Fundamentals that influence the lending industry and real estate markets in Alberta.
Sales volumes of real estate in the Fraser Valley reached their highest point for October, with 2,370 sales representing a 48.9% increase from October 2019. New listings also increased compared to last year. Benchmark home prices increased across all major property types compared to last October, with detached homes seeing a 9.9% increase. The real estate market remains strong despite the pandemic, though inventory levels are decreasing, with only 1.4 months of supply for detached homes in Langley if no new listings were added. Real estate professionals are encouraging online and virtual interactions to complete sales safely during the pandemic.
Fraser Valley Real Estate Board August 2021 Statistics Vicky Aulakh
- Home sales in the Fraser Valley remained elevated in August 2021, with 2,087 property sales representing a 2.4% increase from August 2020 and a 4% increase from July 2021. This was the second highest sales level ever recorded for the month of August.
- Housing supply remains extremely low, at levels last seen in the early 1980s, with total active listings down 44.9% from August 2020. The lack of supply is putting upward pressure on home prices across the region.
- Benchmark home prices rose between 1-31% across housing types compared to August 2020, with the average price of a detached home in the Fraser Valley increasing 50% over the past five years despite government measures aimed at improving afford
Fraser Valley Real Estate Board Statistics - November 2021 VickyAulakh1
- Home sales in the Fraser Valley region of BC continued to increase in November 2021, with 1,972 sales of all property types. This was a decrease of 9.2% from November 2020 but an increase of 1.8% from October 2021.
- New property listings also decreased, with 2,096 new listings in November 2021, down 5.5% from November 2020. Active inventory continued to decline sharply, down 47.9% from November 2020.
- The president of the Fraser Valley Real Estate Board said lack of housing supply remains the biggest challenge, and buyers and sellers are relying on their realtors' experience to navigate multiple offer situations and fast market conditions.
- Housing market activity in the Fraser Valley reached record levels in September, with home sales and new listings seeing the highest numbers ever recorded for the month.
- Sales increased 66.1% compared to September 2019 and 9.4% compared to August 2020, reaching 2,231 total sales. New listings also saw a record at 3,515, up 26.9% and 6.2% respectively.
- Demand has shifted towards single family detached homes, making up 47% of sales compared to 43% in the same period last year. Benchmark home prices also increased across all property types.
Dec 2020 Fraser Valley Real Estate Board PackageVicky Aulakh
- In December 2020, real estate sales in the Fraser Valley set a new record with 2,086 sales, an increase of 81.2% over the typical December sales. New listings were also near record levels.
- Despite months of slowdown due to the pandemic, total annual sales in 2020 were 12.4% above the 10-year average, with 19,926 total sales for the year.
- Benchmark home prices in December increased compared to both the previous month and the previous year for detached homes, townhomes, and apartments.
- Home sales in the Fraser Valley increased significantly in October 2019 compared to both September 2019 and October 2018, with sales up 18.5% and 37.8% respectively.
- While new listings decreased compared to the previous year and month, overall active listings also declined, down 4.5% and 6.9%.
- Benchmark home prices were mixed, with detached homes up slightly but townhouses and apartments down slightly to moderately compared to the previous year.
- Sales and new listings in the Fraser Valley set records in August 2020, with 2,039 sales (up 57.2% year-over-year) and 3,309 new listings (up 40.4% year-over-year).
- The average prices of single-family homes, townhomes, and apartments all increased compared to August 2019, with benchmark prices up 6.9%, 3%, and 4% respectively.
- REB President Chris Shields noted the market remains competitive with multiple offers and shorter days on market, and consumers are seeking expert guidance from REALTORS.
Fraser Valley Real Estate Board November 2020 statistics packageVicky Aulakh
- Housing demand in the Fraser Valley region of BC continued at record levels in November, with home sales up 54.7% compared to November 2019.
- A total of 2,173 housing units of all types were sold in November, setting a new monthly sales record.
- The average number of days on the market for detached homes was 32 days, while townhomes sold within 25 days and apartments within 34 days.
- Benchmark home prices increased across all major property types compared to November 2019, with detached homes up 11.5%, townhomes up 5.8%, and apartments up 4.6%.
- Home sales in the Fraser Valley increased 39% in February 2020 compared to January 2020 and 38% compared to February 2019, outpacing new listings which increased 15% month-over-month but decreased 15% year-over-year.
- Inventory levels remained below historical averages at 5,741 active listings as of the end of February, up 12% from January but down 10% from February 2019.
- Benchmark home prices in the region increased between 1-1.5% across detached homes, townhomes, and apartments compared to both the previous month and February 2019.
FVREB September 2021 Statistics PackageVickyAulakh1
- Housing sales in the Fraser Valley decreased in September compared to August but were the second highest for the month of September in the past 100 years.
- New housing listings increased compared to August but inventory remains low.
- Demand remains strong across the region while low inventory continues to pose challenges for buyers. Benchmark home prices rose in September across all major property types compared to the previous year.
- Real estate activity in the Fraser Valley saw a steep decline in April 2020 in response to measures taken to reduce the spread of COVID-19. Sales were down 52% from March and 50% from April 2019, which was one of the slowest Aprils on record.
- New property listings also declined significantly, down 47% from March and 58% from the previous year. Despite fewer transactions, realtors continued advising clients through virtual services.
- Benchmark home prices in the region increased modestly for detached homes and townhouses compared to March 2020, while apartment prices remained stable. The real estate market remained balanced as new listings declined faster than sales.
- Home sales in the Fraser Valley rebounded in July, increasing 11.6% compared to June 2019. New listings decreased slightly.
- The benchmark prices for single family detached homes and townhomes decreased compared to last year, while prices for apartments remained unchanged.
- REALTORS saw more activity at open houses in July and an increase in first-time home buyers, indicating improved consumer confidence in the market.
Fraser Valley Real Estate Board June 2020 Vicky Aulakh
- Property sales in the Fraser Valley more than doubled from May to June 2020, increasing 113% as buyers returned to the market.
- New property listings also increased significantly, rising 57% from May to June while active listings rose 9%.
- The average prices of detached homes, townhomes, and apartments all increased between 1-4% compared to June 2019, with benchmark prices also rising, indicating stability in the housing market despite the pandemic.
- In November 2019, real estate activity in the Fraser Valley saw 1,405 total property sales, an increase of 36.7% from November 2018 but a decrease of 11.7% from October 2019.
- Demand was unusually high for the end of the year while inventory levels declined, with the supply of townhomes and condos not keeping up with buyer demand.
- Benchmark home prices decreased year-over-year but price declines were moderating, with the combined residential benchmark price down only 3% in November compared to 6% earlier in the summer.
Fraser Valley Real Estate Board May 2021 Statistics PackageVicky Aulakh
Near record-breaking new listings in May were not enough to match insatiable buyer demand in the Fraser Valley real estate market. Sales reached 2,951, near the record of 2,911 set in 2016, while new listings of 3,926 approached the record of 2018. Total active inventory was 5,868, down 9% from May 2020. The average number of days to sell a single-family home was 14 days. Benchmark home prices continued to increase from April 2021.
Fraser Valley Real Estate Board Statistics Package October 2021VickyAulakh1
- MLS home sales in the Fraser Valley remained strong in October at 1,938 sales, an increase of 3.9% from September but a decrease of 18.2% from October 2020.
- New property listings decreased 29% from October 2020 and 6.6% from September 2021, contributing to low inventory levels.
- Benchmark home prices increased across all major property types compared to September 2021, with detached homes seeing the largest increase of 2.5% to $1,396,700.
Fraser Valley Real Estate Board July 2021 Statistics Vicky Aulakh
In July 2021, home sales in the Fraser Valley remained steady compared to the previous month with 2,006 property sales. New listings decreased by 31.5% compared to July 2020. Total active inventory reached the lowest level for July since 1981 with 4,901 properties, a 33% decrease from July 2020. The average price of homes increased 17% compared to July 2020, to $969,172.
Real Estate Analysis & Benchmark 121214Dean Koeller
This report provides real estate data for Calgary, Edmonton, and Alberta. In Calgary, total residential sales increased 11.14% year-over-year in 2014 while new listings rose 14.87%. The average price of single family homes in Calgary has risen steadily from $287,635 in 2005 to $552,183 in 2014. In Edmonton, total residential sales increased slightly by 0.64% in 2014 compared to the previous year as new listings grew by 8.87%. Alberta's GDP increased by 3.9% from 2013 to 2014.
Halfway through 2016, the San Francisco residential real estate market is performing as expected, with sales and prices up in most areas while inventory remains low. Specifically:
- Median sales prices increased 3.8% for single-family homes and 7% for condos over the past year.
- New listings were down 21% for single-family but up 13% for condos. Pending sales fell 1% for single-family and 16% for condos.
- Months of supply decreased 5% for single-family but increased 58% for condos, indicating the inventory issue is more pronounced in the condo market.
The document provides detailed data on housing activity and market metrics in San
The housing market in the Fraser Valley region of BC continued to stabilize in August 2019, with home sales increasing 12.3% compared to August 2018. Total home sales in August 2019 were 1,297, with sales of single-family detached homes up 18% and townhomes up 9.2% compared to the previous year. While active listings increased 9.6% year-over-year to 8,040, new property listings in August declined 8.5% compared to August 2018. Benchmark home prices decreased across property types compared to the previous year, with single-family detached prices down 5.4%, townhome prices down 4.9%, and apartment prices down 7.7%.
Fraser Valley Real Estate Board Statistics Package January 2020 Vicky Aulakh
- Home sales in the Fraser Valley region of BC were 6% above the 10-year average for January while new listings were 11% below average.
- 974 total property sales occurred in January, down 22% from December 2019 but up 24% from January 2019.
- Benchmark home prices increased slightly for detached homes, townhomes, and apartments compared to December 2019.
Residential real estate activity in San Francisco decreased in August 2016. New listings and pending sales declined for both single family homes and condos/co-ops compared to the previous year. The median sales price increased slightly for single family homes but decreased for condos/co-ops. Low inventory continued to be a challenge, putting upward pressure on home prices.
Calvert Home Mortgage's Real Estate and Economic Report for Sept 2015Jesse Bobrowski
Please view our monthly report which highlights real estate activity in Alberta's two major markets as well as general economic indicators related to Alberta's economy.
At Calvert we utilize this information to assist in making prudent real estate lending decisions.
Calvert Home Mortgage Real Estate and Economic Report for September 2015Keith Uthe
Calvert Home Mortgage provides a simplified breakdown of statistics and and information from the Calgary and Edmonton real estate markets and how they are affecting current home prices. You will also find the most recent statistics available for key Economic Fundamentals that influence the lending industry and real estate markets in Alberta.
Calvert Home Mortgage Economic Report for October 2015Keith Uthe
Calvert Home Mortgage provides a simplified breakdown of statistics and and information from the Calgary and Edmonton real estate markets and how they are affecting current home prices. You will also find the most recent statistics available for key Economic Fundamentals that influence the lending industry and real estate markets in Alberta.
Calvert Home Mortgage Real Estate and Economic Report for November 2015Keith Uthe
Calvert Home Mortgage provides a simplified breakdown of statistics and and information from the Calgary and Edmonton real estate markets and how they are affecting current home prices. You will also find the most recent statistics available for key Economic Fundamentals that influence the lending industry and real estate markets in Alberta.
Record Homes Sales Again for July 2015! As was the case in June, Dane County home sales in July reached an all-time high for the month. Year-to-date sales are also setting a record pace – exceeding the previous high recorded in 2005. New listings are keeping pace with recent years yet the active inventory continues to fall. This year has been positive as well for the primary market* served by the SCWMLS. Last month we stated that demand is expected to remain high for the second half of the year and nothing has happened to change our mind. As a result, inventories will remain low – below the 6 month figure generally considered to be the market balance between buyers and sellers. Prices (and interest rates) will likely continue to rise. For both buyers and sellers, strategic advice and knowledge of the market from your real estate professional will be valuable assets.
TORONTO, ONTARIO, May 5, 2020 – Toronto Regional Real Estate Board President Michael Collins released the following key housing market statistics for April 2020:
Home Sales and Listings
Greater Toronto Area REALTORS® reported 2,975 residential transactions through TRREB’s MLS® System. This result was down by 67 per cent compared to April 2019. Weekday sales remained within a relatively steady range during the month, averaging 130 per day.
New listings amounted to 6,174 in April 2020 – down on a year-over-year basis by a similar rate compared to sales (-64.1 per cent).
“The necessary social distancing and economic impacts associated with COVID-19 clearly impacted home sales and listings throughout April 2020. However, REALTORS® have been able to facilitate some transactions on behalf of buyers and sellers through the use of innovative techniques including virtual open houses. TRREB has also provided a live stream virtual open house option on Member listings featured on our public websites, and I would expect the use of these innovative techniques to increase as some level of social distancing remains in place for the foreseeable future,” said Mr. Collins.
“TRREB Members should continue to follow directives and guidance being given by the government and public health agencies. TRREB’s professional development staff are continuously working to educate our Members via virtual webinars on using technology in innovative ways to conduct business virtually, including video, virtual tours and the use of electronic forms wherever possible,” said TRREB CEO John DiMichele.
"We are on track for record home sales reported through TREB's MLS® System this year. Barring a drastic shift in the economy over the next three months, total transactions reported by TREB Members in 2015 are expected to be at or near the 100,000 mark. This is a testament to the importance that GTA households put on home ownership as a long-term investment," said Mr. McLean.
The Do Good Report - Wrightsville Beach 1st Quarter 2013DoGoodRealEstate
The document provides an overview of the Wrightsville Beach real estate market through Q1 2013. Key points include:
- Home inventory dropped 17% from Q1 2012 levels, indicating a seller's market with high demand and low supply.
- Median and average home prices increased substantially (25% and 14% respectively) from Q4 2012.
- The real estate company expects continued stability and growth in the market through 2013.
Sales in the GTA decreased 18% year-over-year in September 2021, while average home prices increased 18.3% to $1,136,280. New listings were down 34% compared to September 2020, contributing to tighter market conditions and higher prices. Demand remained strong but supply issues persisted, with many buyers unable to find suitable properties. Price growth was driven by detached and semi-detached houses as well as townhouses, while condo apartment prices also increased with more first-time buyers entering the ownership market.
- Home sales in the Toronto region reached a record high in April 2016, with 12,085 sales, up 7.4% from April 2015. However, sales of detached and semi-detached houses as well as townhouses declined in the City of Toronto due to low inventory.
- The average home price rose 16.2% from April 2015 to $739,082 in April 2016 due to high demand and lack of supply, especially in the City of Toronto where some homeowners chose not to list due to the land transfer tax.
- With strong buyer competition expected to continue through the busy spring season, home prices were forecast to keep rising unless listings growth significantly outpaced sales growth.
THE TORONTO REAL ESTATE BOARD'S MAY 2018 MARKET SALES STATISTICS WITH MEDIA R...Shawn Venasse
June 4, 2018 -- Greater Toronto Area REALTORS® reported 7,834 sales through TREB's MLS® System in May 2018. This result was down by 22.2 per cent compared to May 2017. While the number of sales was down year-over-year, the annual rate of decline was less than reported in February, March and April, when sales were down by more than 30 per cent. On a month-over-month basis, seasonally adjusted May sales were basically flat compared to April.
Dane County home sales continued at a very strong pace in November, up 13.6% over last year and 13.8% for the year-to-date. New listings in Dane County increased over last year (2014) in November – this time by more than 13%. 2015 Could come very close to setting an all-time record for home sales, exceeding the 7981 reported at the end of 2005.
2015 Could come very close to setting an all time record for home sales. Inventory is low, but great homes are there to be found. Buy now to avoid competition with other buyers and lock in today's lower interest rates versus risking higher rates in the Spring.
Once again, new listings increased – 4% for the month – but the higher volume of sales continues to keep the number of homes for sale very lean. Only 3.06 months of active inventory is now available compared to 4.5 months just one year ago.
Across the eight county primary market region of the South Central Wisconsin MLS, sales increased 3.8% in October and now stand 11.7% ahead of last year. The median price increased as well – up 7.2% for the month and 6.2% year-to-date. All counties are equaling or exceeding 2014 in year-to-date sales and median prices.
Home sales in Dane County set a record in October 2015 with 586 sales, an 18.9% increase from October 2014. The median home sale price was $230,000, unchanged from the year-to-date median. Inventory remains low with only 3.06 months of supply available. Across the eight-county region, home sales increased 3.8% in October while the median sale price rose 7.2% compared to October 2014.
STRONG MARKET CONTINUES—While August homes sales in Dane County did not set records like June and July, the 713 sales are slightly more than 2014, keeping the year-to-date total 13.8% ahead of last year. For the first eight months, total sales in 2015 are second highest on record, exceeded only by those in 2005 (which also is the record year for annual sales).
New listings are keeping pace with 2014 yet the number of active residential listings is still very much on the lean side. The supply of active inventory is 3.3 months compared to 4.8 months at this same time in 2014 and 2013. Generally a six-month supply is considered to represent a balanced market between buyers and sellers.
Residential real estate activity in San Francisco saw increases in the first half of 2015 compared to the same period last year. The median sales price for single-family homes rose 10.7% to $1,301,000, while condos rose 15.2% to $1,100,000. New listings declined for both segments, down 19.1% for single-family and 26.2% for condos. Pending sales rose 10.5% for single-family but fell 9.1% for condos. Inventory levels decreased across the board, dropping over 25% for both single-family and condo units.
In April 2013, there were 9,811 home sales in the Greater Toronto Area through the TorontoMLS system, representing a 2% decrease from April 2012. The average selling price was $526,335, up 2% from April 2012. New listings and active listings at the end of April increased compared to the previous year. The condominium apartment segment saw price growth, with the average selling price and MLS HPI apartment index both up year-over-year.
1. Economic Region
Calgary Single Family
Calgary Apt. Condo
Calgary Attached
2015
Economic Region
Calgary Single Family
Calgary Apt. Condo
Calgary Attached
In July the number of Economic Region sales decreased less year over year than the number of new listings and active listings improving the
absorption and stability of the market. Active listings in the Attached category have continued to have the largest increase over last year.
[The Attached category includes semi-detached duplexes, row houses and townhouse condominiums.]
Average single family home sale price dropped to just over $545,000 in July, a decrease of $18,000 from June's high of $563,000.
There was a marked decrease in sales with prices between $700,000-$799,000 and sales in excess of $1.5M which is accounting
for the greatest erosion of the average sale price.
1,313 60.22% 399,233$ -1.52%
1,362 44.45% 307,087$ -3.48%
3,071 -23.07% 5,444 -0.98% 56.33% -21.97%
3,688 29.21% 545,900$ -1.85%
2,225 -29.16% 4,669 -3.83% 48.46% -24.58%
8,752 -23.18% 15,140 -9.48% 57.69% -14.81%
7,148 29.13% 473,785$ -1.17%
AVERAGE Y/Y% AVERAGE Y/Y%
15,089 -24.19% 27,370 -8.25% 55.10% -16.79%
TOTAL Y/Y% TOTAL Y/Y% AVERAGE Y/Y%
YEAR TO DATE (2015): from January 1st , 2015 to the last day of July, 2015
1,297 26.29% 406,569$ 0.92%
1,306 12.78% 304,571$ -3.59%
526 -9.93% 776 1.31% 68.00% -10.81%
3,636 1.62% 545,284$ -3.19%
345 -27.97% 613 -11.16% 56.28% -18.93%
1,441 -11.10% 2,081 -7.39% 69.25% -4.01%
7,118 -11.65% 480,489$ 0.89%2,484 -14.40% 3,768 -17.53% 65.92% 3.79%
AVERAGE Y/Y% AVERAGE Y/Y%TOTAL Y/Y% TOTAL Y/Y% AVERAGE Y/Y%
Real Estate and Economic Report
Sales New Listings
Sales to New
Listings Ratio
Active Listings Average Price
from the 1st of July, 2015 to the last day of July, 2015
- Calgary Real Estate Market -
REPORTING PERIOD:
$459,035 $465,202 $479,880
$517,333
$558,738 $545,900
$250,000
$350,000
$450,000
$550,000
$650,000
2010 2011 2012 2013 2014 2015 YTD
Single Family Home Annual Average Price (Calgary)
0
1000
2000
3000
4000
5000
6000
7000
8000
9000
10000
Single Family Home Comparisons (Calgary)
Sales (Total) New Listings (Total) Active Listings (Avg.)
2. Total Residential
Single Family
Apartment Condo
Duplex Rowhouse
2015
Total Residential
Single Family
Apartment Condo
Duplex Rowhouse 357,139$ 4.51%
The Sales to new Listings ratio is showing signs of an increasing supply of housing coming on to the market as sales begin to drop
off from the June peak. Apartment condos saw the largest decline in sales for July at -16.82% and Duplex/Rowhouse saw new
listings increase by a whopping 43.09%.
881 4.26% 1,587 29.23% 55.57% -18.45%
438,370$ 1.92%
2,938 -15.01% 6,504 16.45% 44.43% -27.00% 252,642$ 2.31%
TOTAL Y/Y%
372,453$ 2.53%
6,246 -10.66% 12,215 10.34% 49.86% -19.21%
YEAR TO DATE (2015): from January 1st, 2015 to the last day of July, 2015
AVERAGE Y/Y%
10,251 -9.83% 20,798 13.14% 48.11% -21.38%
TOTAL Y/Y% AVERAGE Y/Y%
256,708$ 0.92%
139 -4.14% 259 43.09% 54.00% -32.50% 356,237$ -0.84%
534 -16.82% 1,014 20.28% 53.00% -30.26%
3.27%
1,111 -4.06% 1,782 11.31% 62.00% -13.89% 436,948$ 1.93%
Y/Y%
1,812 -9.13% 3,123 14.90% 58.02% -20.91% 372,910$
TOTAL Y/Y% TOTAL Y/Y% AVERAGE Y/Y% AVERAGE
REPORTING PERIOD: from the 1st of July, 2015 to the last day of July, 2015
Sales New Listings
Sales to New
Listings Ratio
Average Price
- Edmonton Real Estate Market -
Even with slower sales this year, the average number of days on market for single family homes has only risen from 35 to 40 days
year over year. A very small increase and well within acceptable levels.
The sale of homes over $1.5M saw a huge drop in July dropping from 29 last year to only 9 in July this year. Homes in the
$700,000-$799,000 and $350,000 to $399,000 price category also saw the most significant drop in the percentage of sales year
over year. The cumulative drop in higher priced sales has negatively affected the average home price.
0
20
40
60
Single Family Home Average Days on Market (Calgary)
0
50
100
150
200
250
300
350
400
> $100 $100 -
$199
$200 -
$299
$300 -$
349
$350 -
$399
$400 -
$449
$450 -
$499
$500 -
$549
$550 -
$599
$600 -
$649
$650 -
$699
$700 -
$799
$800 -
$899
$900 -
$999
$1M +
July 2014
July 2015
Number of Sales by Price Range (Calgary Metro)
3. Following a drop in average days on market from 58 to 44 between January to March 2015 we have now seen a steady increase
to 50 average days on market. Apartment condos are the highest at 54 average days on market.
Historically Edmonton follows Calgary for price increases and decreases by about 6 months, however, that trend broke off in 2014
likely due to the drop in oil prices. During the same 10 year period the TSX100 only increased 50% compared to the 110% for
Calgary and the 80% for Edmonton showing that real estate continues to be a strong investment.
Sales of single family homes in July 2015 were consistent with sales for July in the previous 3 years. The number of new listings is
continuing to stay high compared to previous years when there was a much greater peak and steep drop starting in July.
Since 2011 the average home price in Edmonton has increased an average of just over 4% per year since 2011 with a high of
5.4% between 2013 and 2014. The current YTD increase over 2014 is 1.53%.
$383,226 $379,485
$392,446
$409,438
$431,760
$438,370
$340,000
$360,000
$380,000
$400,000
$420,000
$440,000
$460,000
2010 2011 2012 2013 2014 2015 YTD
Single Family Home Annual Average Price (Edmonton)
989
1,084
1,264
1,136
941
854
773
782
623
419
528
648
923
1,022
1,179
1,198
1,125
983
857
863
673
436
485
747
917
1,147
1,213
1,324
1,158
924
967
850
717
439
390
547
876
1,001
1,078
1,243
1,111
1,737
1,663
1,943
1,627
1,455
1,380
1,266
1,082
769
409
955
1,115
1,467
1,569
1,911
1,586
1,491
1,349
1,268
1,059
783
415
1,070
1,082
1,585
1,818
2,085
1,829
1,601
1,353
1,337
1,256
794
534
1,298
1,428
1,883
1,964
1,974
1,886
1,782
0
500
1,000
1,500
2,000
2,500
Single Family Home Comparisons (Edmonton)
Sales (Total) New Listings (Total)
0
50
100
Average Days on Market (Edmonton Metro)
100
125
150
175
200
225
Calgary Home Price Index
Edmonton Home Price Index
Home Price Index Comparison
4. Real GDP Change
2015Q1
Unemployment Rate
Jul-15
Retail Sales Growth
May-15
Total Mortgages
May-15
Mortgages 90 day
Arrears May 15
in Alberta
in Canada
in Canada
569,448
4,661,036
-1.69%in Alberta 0.43%
in Canada
1.42%
0.74%
in Alberta
in Canada -0.60%
-86.36%
-130.00%
in Alberta
in Alberta
6.00%
in Canada
1.62%
in Canada 945.67$
12,910 -4.62%
1.39%
1,538
1,152.72$
-18.80%
29.49 -5.80%
-0.13%
Weekly Earnings
May 2015
6.80% 7.35%
in Alberta
1.71%
Housing starts (000's)
May-15
*the following information is based on current available data from: http://economicdashboard.albertacanada.com/, www.statcan.gc.ca/dai-quo/ and RBC Economic
Outlook.
TOTAL Y/Y%
7,723 2.17%
Apr-15
Net Migration to AB
21.67%
0.60%
Y/Y%
- Alberta Economic Indicators -
Employees have continued to earn more than they did at this time last year, however, average weekly earnings are down since
from their peak in February and March this year. Reduced overtime hours in the energy sector are a key factor.
The number of total mortgages in Alberta has continued to increase, however, May saw an increase in the number of mortgage
arrears. The increase in the number of mortgage arrears was significant enough to increase the percentage of arrears to total
number of mortgages in Alberta while the percentage stayed the same for Canada.
$990.98
$1,034.17
$1,070.47
$1,107.97
$1,149.18 $1,152.72
$900
$1,000
$1,100
$1,200
2010 2011 2012 2013 2014 2015 YTD
Alberta's Average Weekly Earnings
0.20%
0.23%
0.25%
0.28%
0.30%
0.33%
0.35%
0.38%
0.40%
M
o
r
t
g
a
g
e
s
% of Arrears to Total Number of
Mortgages AB
% of Arrears to Total Number of
Mortgages CA
Mortgage Arrears Ratio; Canada vs Alberta
5. Notes:
- On 15 July, the Bank lowered the overnight rate target to 1/2 per cent.
- Total CPI inflation in Canada has been around 1 per cent; core inflation has been close to 2 per cent.
- The Bank expects real GDP growth of just over 1 per cent in 2015 and about 2 1/2 per cent in 2016 and 2017.
http://economicdashboard.albertacanada.com/
http://www.creb.com/
http://www.ereb.com/REALTORSAssociationOfEdmonton.html
http://www.capp.ca/Pages/default.aspx
http://homepriceindex.ca/hpi_tool_en.html
http://www.cba.ca/en/component/content/publication/69-statistics
http://www.finance.alberta.ca/aboutalberta/
http://www.statcan.gc.ca/dai-quo/
http://www.housepriceindex.ca/default.aspx?langue=EN
The oil sands currently provides jobs for 514,000 people across Canada (direct, indirect and induced) and this is expected to grow
to over 800,000 jobs in 2028. Many of these jobs will be created in provinces outside of Alberta. Source CAPP
121,500 Albertans are directly employed in mining, oil and gas extraction sectors
Bank of Canada Realeased its Monetary Policy report for July 2015. The key Highlights are:
CND resale of homes has picked up in Toronto and Vancouver while they have declined in Calgary and Edmonton.
http://www.bankofcanada.ca/wp-content/uploads/2014/12/fsr-december2014.pdf
Resources
http://www.rbc.com/economics/economic-data/index.html
Prior to June we had seen a trend of closing the gap between the price in $USD of West Texas Intermediate (WTI) Oil and
Western Canadian Select (WCS) bitumen. This was and still is a big benefit to the majority of Alberta producers as WCS is what
is mostly produced in Alberta and shipped out at the US dollar rate and then converted to Canadian Dollars. This means that
currently the price for WCS in Canadian dollars is about $64 per barrel, with the low Canadian dollar the Alberta producers are
enjoying the relative benefit. Even though the price gap has increased recently it is nowhere near its peak gap differential.
- Global growth faltered in early 2015. It is expected to strengthen over the second half of 2015, averaging about 3 per cent for the
year, and accelerate to around 3 1/2 per cent in 2016 and 2017.
- The projection for growth in Canada in 2015 has been marked down, with real GDP estimated to have contracted modestly
in the first half of the year. Growth in Canada is projected to resume in the third quarter and begin to exceed potential again in
- The Bank anticipates that the economy will return to full capacity and inflation to 2 per cent on a sustained basis in the first half of
2017.
$-
$10.00
$20.00
$30.00
$40.00
$50.00
$60.00
$70.00
$80.00
$90.00
$100.00
$110.00
$120.00
WCS OIL PRICES
WTI OIL PRICES
WTI-WCS Price Differential
WTI and WCS Pricing and Price Differential (US$)