Download to read offline


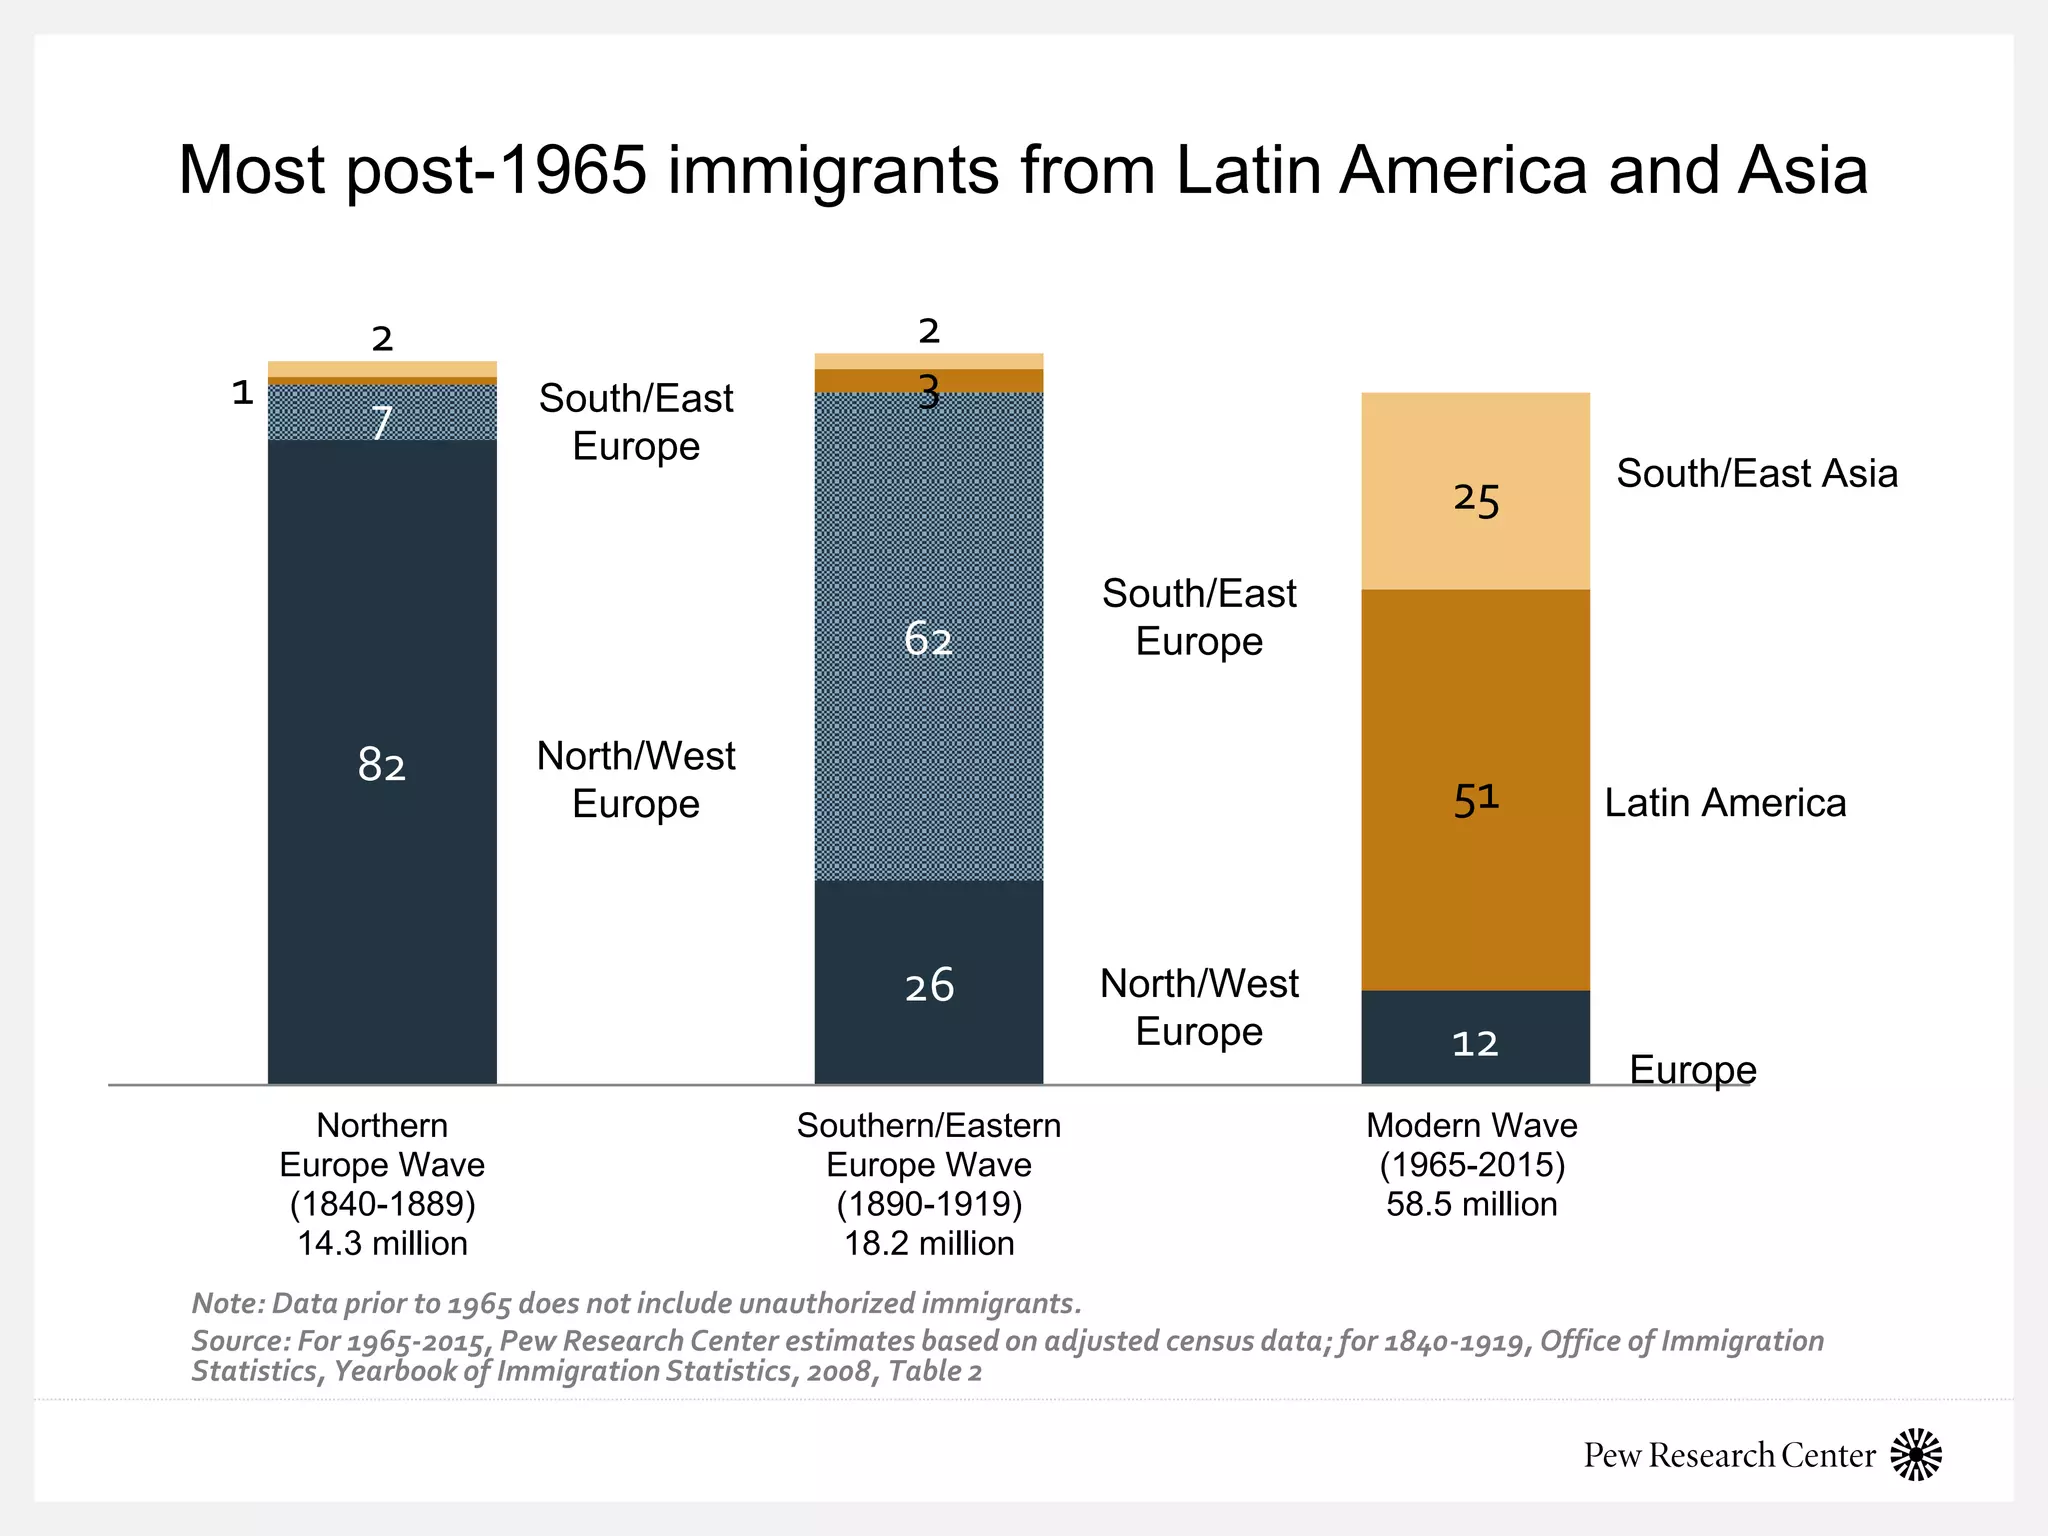


The document provides an overview of global migration trends and attitudes towards immigrants, highlighting the significant number of international migrants and refugees, with over 258 million people living outside their countries of birth as of 2017. It includes survey findings on public opinions about immigrants, noting that many view them as a strength to the economy, while there is a widespread preference for limiting immigration. The report also presents demographic patterns of immigrants in various countries, with a focus on high-skilled immigration and the growing trend of refugees worldwide.