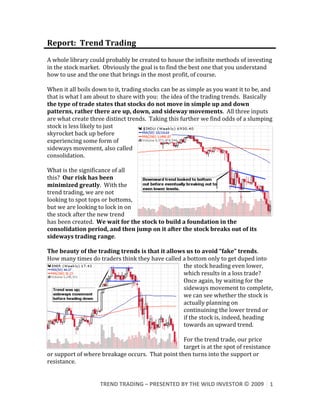
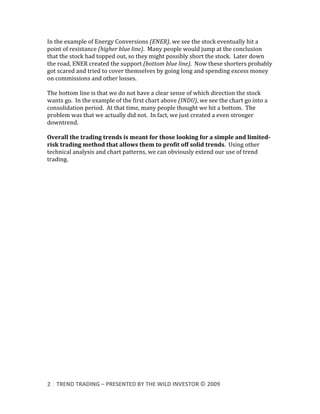
Report:

Trend
Trading


A
whole
library
could
probably
be
created
to
house
the
infinite
methods
of
investing

in
the
stock
market.

Obviously
the
goal
is
to
find
the
best
one
that
you
understand

how
to
use
and
the
one
that
brings
in
the
most
profit,
of
course.


When
it
all
boils
down
to
it,
trading
stocks
can
be
as
simple
as
you
want
it
to
be,
and

that
is
what
I
am
about
to
share
with
you:

the
idea
of
the
trading
trends.

Basically

the
type
of
trade
states
that
stocks
do
not
move
in
simple
up
and
down

patterns,
rather
there
are
up,
down,
and
sideway
movements.

All
three
inputs

are
what
create
three
distinct
trends.

Taking
this
further
we
find
odds
of
a
slumping

stock
is
less
likely
to
just

skyrocket
back
up
before

experiencing
some
form
of

sideways
movement,
also
called

consolidation.


What
is
the
significance
of
all

this?

Our
risk
has
been

minimized
greatly.

With
the

trend
trading,
we
are
not

looking
to
spot
tops
or
bottoms,

but
we
are
looking
to
lock
in
on

the
stock
after
the
new
trend

has
been
created.

We
wait
for
the
stock
to
build
a
foundation
in
the

consolidation
period,
and
then
jump
on
it
after
the
stock
breaks
out
of
its

sideways
trading
range.


The
beauty
of
the
trading
trends
is
that
it
allows
us
to
avoid
“fake”
trends.


How
many
times
do
traders
think
they
have
called
a
bottom
only
to
get
duped
into

                                                      the
stock
heading
even
lower,

                                                      which
results
in
a
loss
trade?


                                                      Once
again,
by
waiting
for
the

                                                      sideways
movement
to
complete,

                                                      we
can
see
whether
the
stock
is

                                                      actually
planning
on

                                                      continuining
the
lower
trend
or

                                                      if
the
stock
is,
indeed,
heading

                                                      towards
an
upward
trend.


                                                      For
the
trend
trade,
our
price

                                                      target
is
at
the
spot
of
resistance

or
support
of
where
breakage
occurs.

That
point
then
turns
into
the
support
or

resistance.


                     TREND
TRADING
–
PRESENTED
BY
THE
WILD
INVESTOR
©
2009
 1


In
the
example
of
Energy
Conversions
(ENER),
we
see
the
stock
eventually
hit
a

point
of
resistance
(higher
blue
line).

Many
people
would
jump
at
the
conclusion

that
the
stock
had
topped
out,
so
they
might
possibly
short
the
stock.

Later
down

the
road,
ENER
created
the
support
(bottom
blue
line).

Now
these
shorters
probably

got
scared
and
tried
to
cover
themselves
by
going
long
and
spending
excess
money

on
commissions
and
other
losses.


The
bottom
line
is
that
we
do
not
have
a
clear
sense
of
which
direction
the
stock

wants
go.

In
the
example
of
the
first
chart
above
(INDU),
we
see
the
chart
go
into
a

consolidation
period.

At
that
time,
many
people
thought
we
hit
a
bottom.

The

problem
was
that
we
actually
did
not.

In
fact,
we
just
created
a
even
stronger

downtrend.


Overall
the
trading
trends
is
meant
for
those
looking
for
a
simple
and
limited­
risk
trading
method
that
allows
them
to
profit
off
solid
trends.

Using
other

technical
analysis
and
chart
patterns,
we
can
obviously
extend
our
use
of
trend

trading.


2
 TREND
TRADING
–
PRESENTED
BY
THE
WILD
INVESTOR
©
2009


Trend trading