Download to read offline


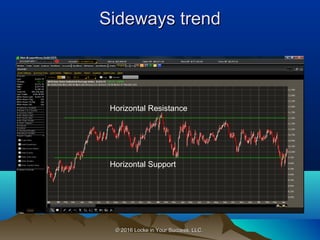

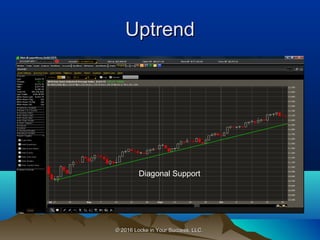


The document provides an overview of technical analysis, emphasizing the importance of trends in various time frames, including uptrends, downtrends, and sideways trends. It discusses how trends are indicated by series of high and low points, along with the roles of support, resistance, and volume in determining trend strength and potential reversals. Additionally, it highlights the necessity of validating peaks and troughs based on the timeframe used for analysis.


