fundamentals of corporate finance 11th canadian edition test bank.docx
Market Wrap Up: 16th February, 2011
1. Feb 16, 2011
MARKET VIEW
NIFTY VIEW
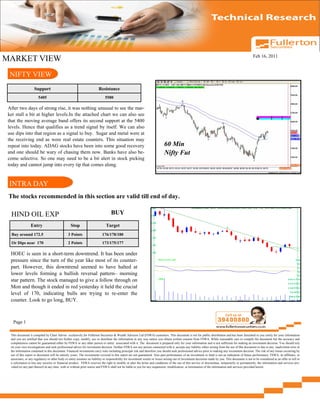
Support Resistance
5405 5580
After two days of strong rise, it was nothing unusual to see the mar-
ket stall a bit at higher levels.In the attached chart we can also see
that the moving average band offers its second support at the 5400
levels. Hence that qualifies as a trend signal by itself. We can also
use dips into that region as a signal to buy. Sugar and metal were at
the receiving end as were real estate counters. This situation may
repeat into today. ADAG stocks have been into some good recovery 60 Min
and one should be wary of chasing them now. Banks have also be- Nifty Fut
come selective. So one may need to be a bit alert in stock picking
today and cannot jump into every tip that comes along.
INTRA DAY
The stocks recommended in this section are valid till end of day.
HIND OIL EXP BUY
Entry Stop Target
Buy around 172.5 3 Points 176/178/180
Or Dips near 170 2 Points 173/175/177
HOEC is seen in a short-term downtrend. It has been under
pressure since the turn of the year like most of its counter-
part. However, this downtrend seemed to have halted at
lower levels forming a bullish reversal pattern– morning
star pattern. The stock managed to give a follow through on
Mon and though it ended in red yesterday it held the crucial
level of 170, indicating bulls are trying to re-enter the
counter. Look to go long, BUY.
Page 1
This document is compiled by Chart Advise exclusively for Fullerton Securities & Wealth Advisors Ltd (FSWA) customers. This document is not for public distribution and has been furnished to you solely for your information
and you are notified that you should not further copy, modify, use or distribute the information in any way unless you obtain written consent from FSWA. While reasonable care to compile the document but the accuracy and
completeness cannot be guaranteed either by FSWA or any other person or entity associated with it. The document is prepared only for your information and is not sufficient for making an investment decision. You should rely
on your own investigations and seek professional advice for investment decision. Neither FSWA nor any person connected with it, accepts any liability either arising from the use of this document or due to any inadvertent error in
the information contained in this document. Financial investments carry risks including principal risk and therefore you should seek professional advice prior to making any investment decision. The risk of any losses occurring by
use of this report or document will be entirely yours. The investments covered in this report are not guaranteed. Also past performance of an investment or fund is not an indication of future performance. FSWA, its affiliates, or
associates, or any regulatory or other body or entity assumes no liability or responsibility for investment results or losses arising out of investment decisions made by you. This document is not to be considered as an offer to sell or
a solicitation to buy any security or financial product. FSWA reserves the right to modify or alter the terms and conditions of the use of this service or discontinue, temporarily or permanently, the information and services pro-
vided (or any part thereof) at any time, with or without prior notice and FSWA shall not be liable to you for any suspension, modification, or termination of the information and services provided herein.
2. APTECH LTD BUY
Entry Stop Target
Buy above 108 1.5 Points 110/112
Or Dips near 105 1.5 Points 107/109
Aptech has bounced back from its 52 week low smartly. It
managed to give a bullish indication a couple of days prior
and there has been follow through as well. On Tue, it fur-
ther extended gains, showing the bulls are definitely back in
the counter and are gung-ho as well. RSI is healthy and well
placed. Volume has shot up significantly indicating action
to be positive. BUY.
ESCORTS SELL
Entry Stop Target
Sell below 112.50 1.5Points 110/108/106
Or Rally around 115 1.5Points 113/111/110
This commercial vehicle counter has been in a steady
downtrend. It indicated healthy activity at lower levels in
the last couple of trading sessions but could not go against
the trend of lower tops lower bottoms. Seeking resistance at
the descending trendline the stock plummeted yesterday to
close near the low indicating bears are still totally in con-
trol. Look to go short ,SELL.
Page 2
This document is compiled by Chart Advise exclusively for Fullerton Securities & Wealth Advisors Ltd (FSWA) customers. This document is not for public distribution and has been furnished to you solely for your information
and you are notified that you should not further copy, modify, use or distribute the information in any way unless you obtain written consent from FSWA. While reasonable care to compile the document but the accuracy and
completeness cannot be guaranteed either by FSWA or any other person or entity associated with it. The document is prepared only for your information and is not sufficient for making an investment decision. You should rely
on your own investigations and seek professional advice for investment decision. Neither FSWA nor any person connected with it, accepts any liability either arising from the use of this document or due to any inadvertent error in
the information contained in this document. Financial investments carry risks including principal risk and therefore you should seek professional advice prior to making any investment decision. The risk of any losses occurring by
use of this report or document will be entirely yours. The investments covered in this report are not guaranteed. Also past performance of an investment or fund is not an indication of future performance. FSWA, its affiliates, or
associates, or any regulatory or other body or entity assumes no liability or responsibility for investment results or losses arising out of investment decisions made by you. This document is not to be considered as an offer to sell or
a solicitation to buy any security or financial product. FSWA reserves the right to modify or alter the terms and conditions of the use of this service or discontinue, temporarily or permanently, the information and services pro-
vided (or any part thereof) at any time, with or without prior notice and FSWA shall not be liable to you for any suspension, modification, or termination of the information and services provided herein.
3. How to read this report
Nifty View is a brief description of the Nifty futures stating what exactly happened during the previous trading ses-
sion. The narration will also explain what is the current market sentiment and how it is having effect on the market
scenario. It will also throw light on how we can expect the market to move for the day along with relevant support
and resistance levels. A chart is also appended in order to provide more clarity to the write-up.
Intra Day View will consist of 3 stocks from the actively traded counters of the NSE / BSE along with charts. The
trades will be given along with three sets of information –
Entry The ideal price at which you should trade (Buy / Sell) the particular counter
- Buy above means Buy above the level mentioned
- Buy on dips means Buy when prices dip towards the level mentioned
- Buy around means Buy the counter near the range mentioned
- Sell below means Sell below the levels mentioned
- Sell on rallies means Sell when prices move higher towards the price mentioned
- Sell around means Sell when prices move higher into the range mentioned
Stop The level beyond which one should not be holding this counter in case the trade backfires. The stop loss is men-
tioned in number of points. The stop has to be placed from the point placed from the point of entry around the level
mentioned.
Exit The suggested targets around which one may choose to book profits. Ideally more than one target is provided so
that one can continue to be in the trade depending on ones risk appetite.
Page 3
This document is compiled by Chart Advise exclusively for Fullerton Securities & Wealth Advisors Ltd (FSWA) customers. This document is not for public distribution and has been furnished to you solely for your information
and you are notified that you should not further copy, modify, use or distribute the information in any way unless you obtain written consent from FSWA. While reasonable care to compile the document but the accuracy and
completeness cannot be guaranteed either by FSWA or any other person or entity associated with it. The document is prepared only for your information and is not sufficient for making an investment decision. You should rely
on your own investigations and seek professional advice for investment decision. Neither FSWA nor any person connected with it, accepts any liability either arising from the use of this document or due to any inadvertent error in
the information contained in this document. Financial investments carry risks including principal risk and therefore you should seek professional advice prior to making any investment decision. The risk of any losses occurring by
use of this report or document will be entirely yours. The investments covered in this report are not guaranteed. Also past performance of an investment or fund is not an indication of future performance. FSWA, its affiliates, or
associates, or any regulatory or other body or entity assumes no liability or responsibility for investment results or losses arising out of investment decisions made by you. This document is not to be considered as an offer to sell or
a solicitation to buy any security or financial product. FSWA reserves the right to modify or alter the terms and conditions of the use of this service or discontinue, temporarily or permanently, the information and services pro-
vided (or any part thereof) at any time, with or without prior notice and FSWA shall not be liable to you for any suspension, modification, or termination of the information and services provided herein.
4. NIFTY DAY TRADING TABLE
SCRIPT CLOSE SECOND FIRST PIVOT FIRST SECOND
SUPPORT SUPPORT RESISTANCE RESISTANCE
ABB 662.55 651 657 665 671 680
ACC 1003 978 991 1002 1015 1026
AMBUJACEM 119.2 116 117 119 121 123
AXISBANK 1274.8 1233 1254 1271 1292 1309
BHARTIARTL 329.15 319 324 329 334 338
BHEL 2070.6 2003 2037 2095 2128 2186
BPCL 603.9 587 596 608 617 629
CAIRN 322.05 316 319 324 327 332
CIPLA 309.85 301 306 312 316 322
DLF 239.7 232 236 242 246 252
GAIL 457.55 445 451 458 464 470
GRASIM 2308.55 2233 2271 2333 2371 2433
HCLTECH 483 464 474 482 491 499
HDFC 646.6 625 636 644 655 664
HDFCBANK 2107 2051 2079 2103 2132 2156
HEROHONDA 1517 1480 1499 1519 1538 1558
HINDALCO 212.4 206 209 215 218 224
HINDUNILVR 273.15 269 271 274 276 279
ICICIBANK 1054.2 1019 1037 1051 1069 1084
IDEA 62 54 58 61 65 69
INFOSYSTCH 3106.55 3048 3077 3103 3132 3158
ITC 157.1 153 155 157 159 161
JINDALSTEL 650.75 621 636 646 661 671
LT 1624.75 1570 1598 1643 1670 1716
M&M 668.05 642 655 668 680 693
MARUTI 1236.7 1200 1218 1230 1248 1260
NATIONALUM 405.15 391 398 404 411 417
NTPC 180.9 176 178 180 183 185
ONGC 282.55 270 276 281 287 292
PNB 1094.95 1018 1056 1081 1119 1144
POWERGRID 98.75 97 98 99 99 100
RANBAXY 516.15 500 508 514 522 528
RCOM 101.55 92 97 100 105 109
RELCAPITAL 481.8 407 445 468 505 528
RELIANCE 941.7 899 920 933 954 966
RELINFRA 634.85 603 619 636 652 669
RPOWER 121.3 112 117 120 124 128
Page 4
This document is compiled by Chart Advise exclusively for Fullerton Securities & Wealth Advisors Ltd (FSWA) customers. This document is not for public distribution and has been furnished to you solely for your information
and you are notified that you should not further copy, modify, use or distribute the information in any way unless you obtain written consent from FSWA. While reasonable care to compile the document but the accuracy and
completeness cannot be guaranteed either by FSWA or any other person or entity associated with it. The document is prepared only for your information and is not sufficient for making an investment decision. You should rely
on your own investigations and seek professional advice for investment decision. Neither FSWA nor any person connected with it, accepts any liability either arising from the use of this document or due to any inadvertent error in
the information contained in this document. Financial investments carry risks including principal risk and therefore you should seek professional advice prior to making any investment decision. The risk of any losses occurring by
use of this report or document will be entirely yours. The investments covered in this report are not guaranteed. Also past performance of an investment or fund is not an indication of future performance. FSWA, its affiliates, or
associates, or any regulatory or other body or entity assumes no liability or responsibility for investment results or losses arising out of investment decisions made by you. This document is not to be considered as an offer to sell or
a solicitation to buy any security or financial product. FSWA reserves the right to modify or alter the terms and conditions of the use of this service or discontinue, temporarily or permanently, the information and services pro-
vided (or any part thereof) at any time, with or without prior notice and FSWA shall not be liable to you for any suspension, modification, or termination of the information and services provided herein.
5. NIFTY DAY TRADING TABLE continued
SCRIPT CLOSE SECOND FIRST PIVOT FIRST SECOND
SUPPORT SUPPORT RESISTANCE RESISTANCE
SAIL 162.45 157 160 162 164 166
SBIN 2736.8 2632 2684 2723 2775 2814
SIEMENS 838.15 833 836 840 842 846
STER 163.5 161 162 164 165 167
SUNPHARMA 423.85 409 416 422 429 434
SUZLON 47.95 46 47 48 49 50
TATACOMM 210.6 202 206 210 214 218
TATAMOTORS 1237.35 1183 1210 1229 1256 1275
TATAPOWER 1268.65 1204 1236 1258 1290 1311
TATASTEEL 616.6 604 610 619 625 634
TCS 1097.7 1055 1077 1098 1119 1140
UNITECH 34.95 33 34 35 36 38
WIPRO 425.45 413 419 423 430 434
SENSEX 18273.80 17917 18096 18229 18407 18540
NIFTY 5481.00 5367 5424 5465 5522 5563
HOW TO READ THE TRADING TABLE
1. If prices are above the LAST CLOSE column, then look to BUY the SCRIP
2. If prices are below the LAST CLOSE column, then look to SELL the SCRIP.
3. The PIVOT is to be used as an addition reference of the trend along with the last close.
4. If prices are weak then look to BUY AROUND the FIRST SUPPORT column.
5. On long positions, the STOPLOSS is given in the left most column.
6. If holding long positions, then take partial profits around the FIRST RESISTANCE column.
7. Profit in Long positions can be taken and one can exit around the SECOND RESISTANCE column.
8. If holding short positions, then the SECOND RESISTANCE column should be used as a stoploss.
Page 5
This document is compiled by Chart Advise exclusively for Fullerton Securities & Wealth Advisors Ltd (FSWA) customers. This document is not for public distribution and has been furnished to you solely for your information
and you are notified that you should not further copy, modify, use or distribute the information in any way unless you obtain written consent from FSWA. While reasonable care to compile the document but the accuracy and
completeness cannot be guaranteed either by FSWA or any other person or entity associated with it. The document is prepared only for your information and is not sufficient for making an investment decision. You should rely
on your own investigations and seek professional advice for investment decision. Neither FSWA nor any person connected with it, accepts any liability either arising from the use of this document or due to any inadvertent error in
the information contained in this document. Financial investments carry risks including principal risk and therefore you should seek professional advice prior to making any investment decision. The risk of any losses occurring by
use of this report or document will be entirely yours. The investments covered in this report are not guaranteed. Also past performance of an investment or fund is not an indication of future performance. FSWA, its affiliates, or
associates, or any regulatory or other body or entity assumes no liability or responsibility for investment results or losses arising out of investment decisions made by you. This document is not to be considered as an offer to sell or
a solicitation to buy any security or financial product. FSWA reserves the right to modify or alter the terms and conditions of the use of this service or discontinue, temporarily or permanently, the information and services pro-
vided (or any part thereof) at any time, with or without prior notice and FSWA shall not be liable to you for any suspension, modification, or termination of the information and services provided herein.