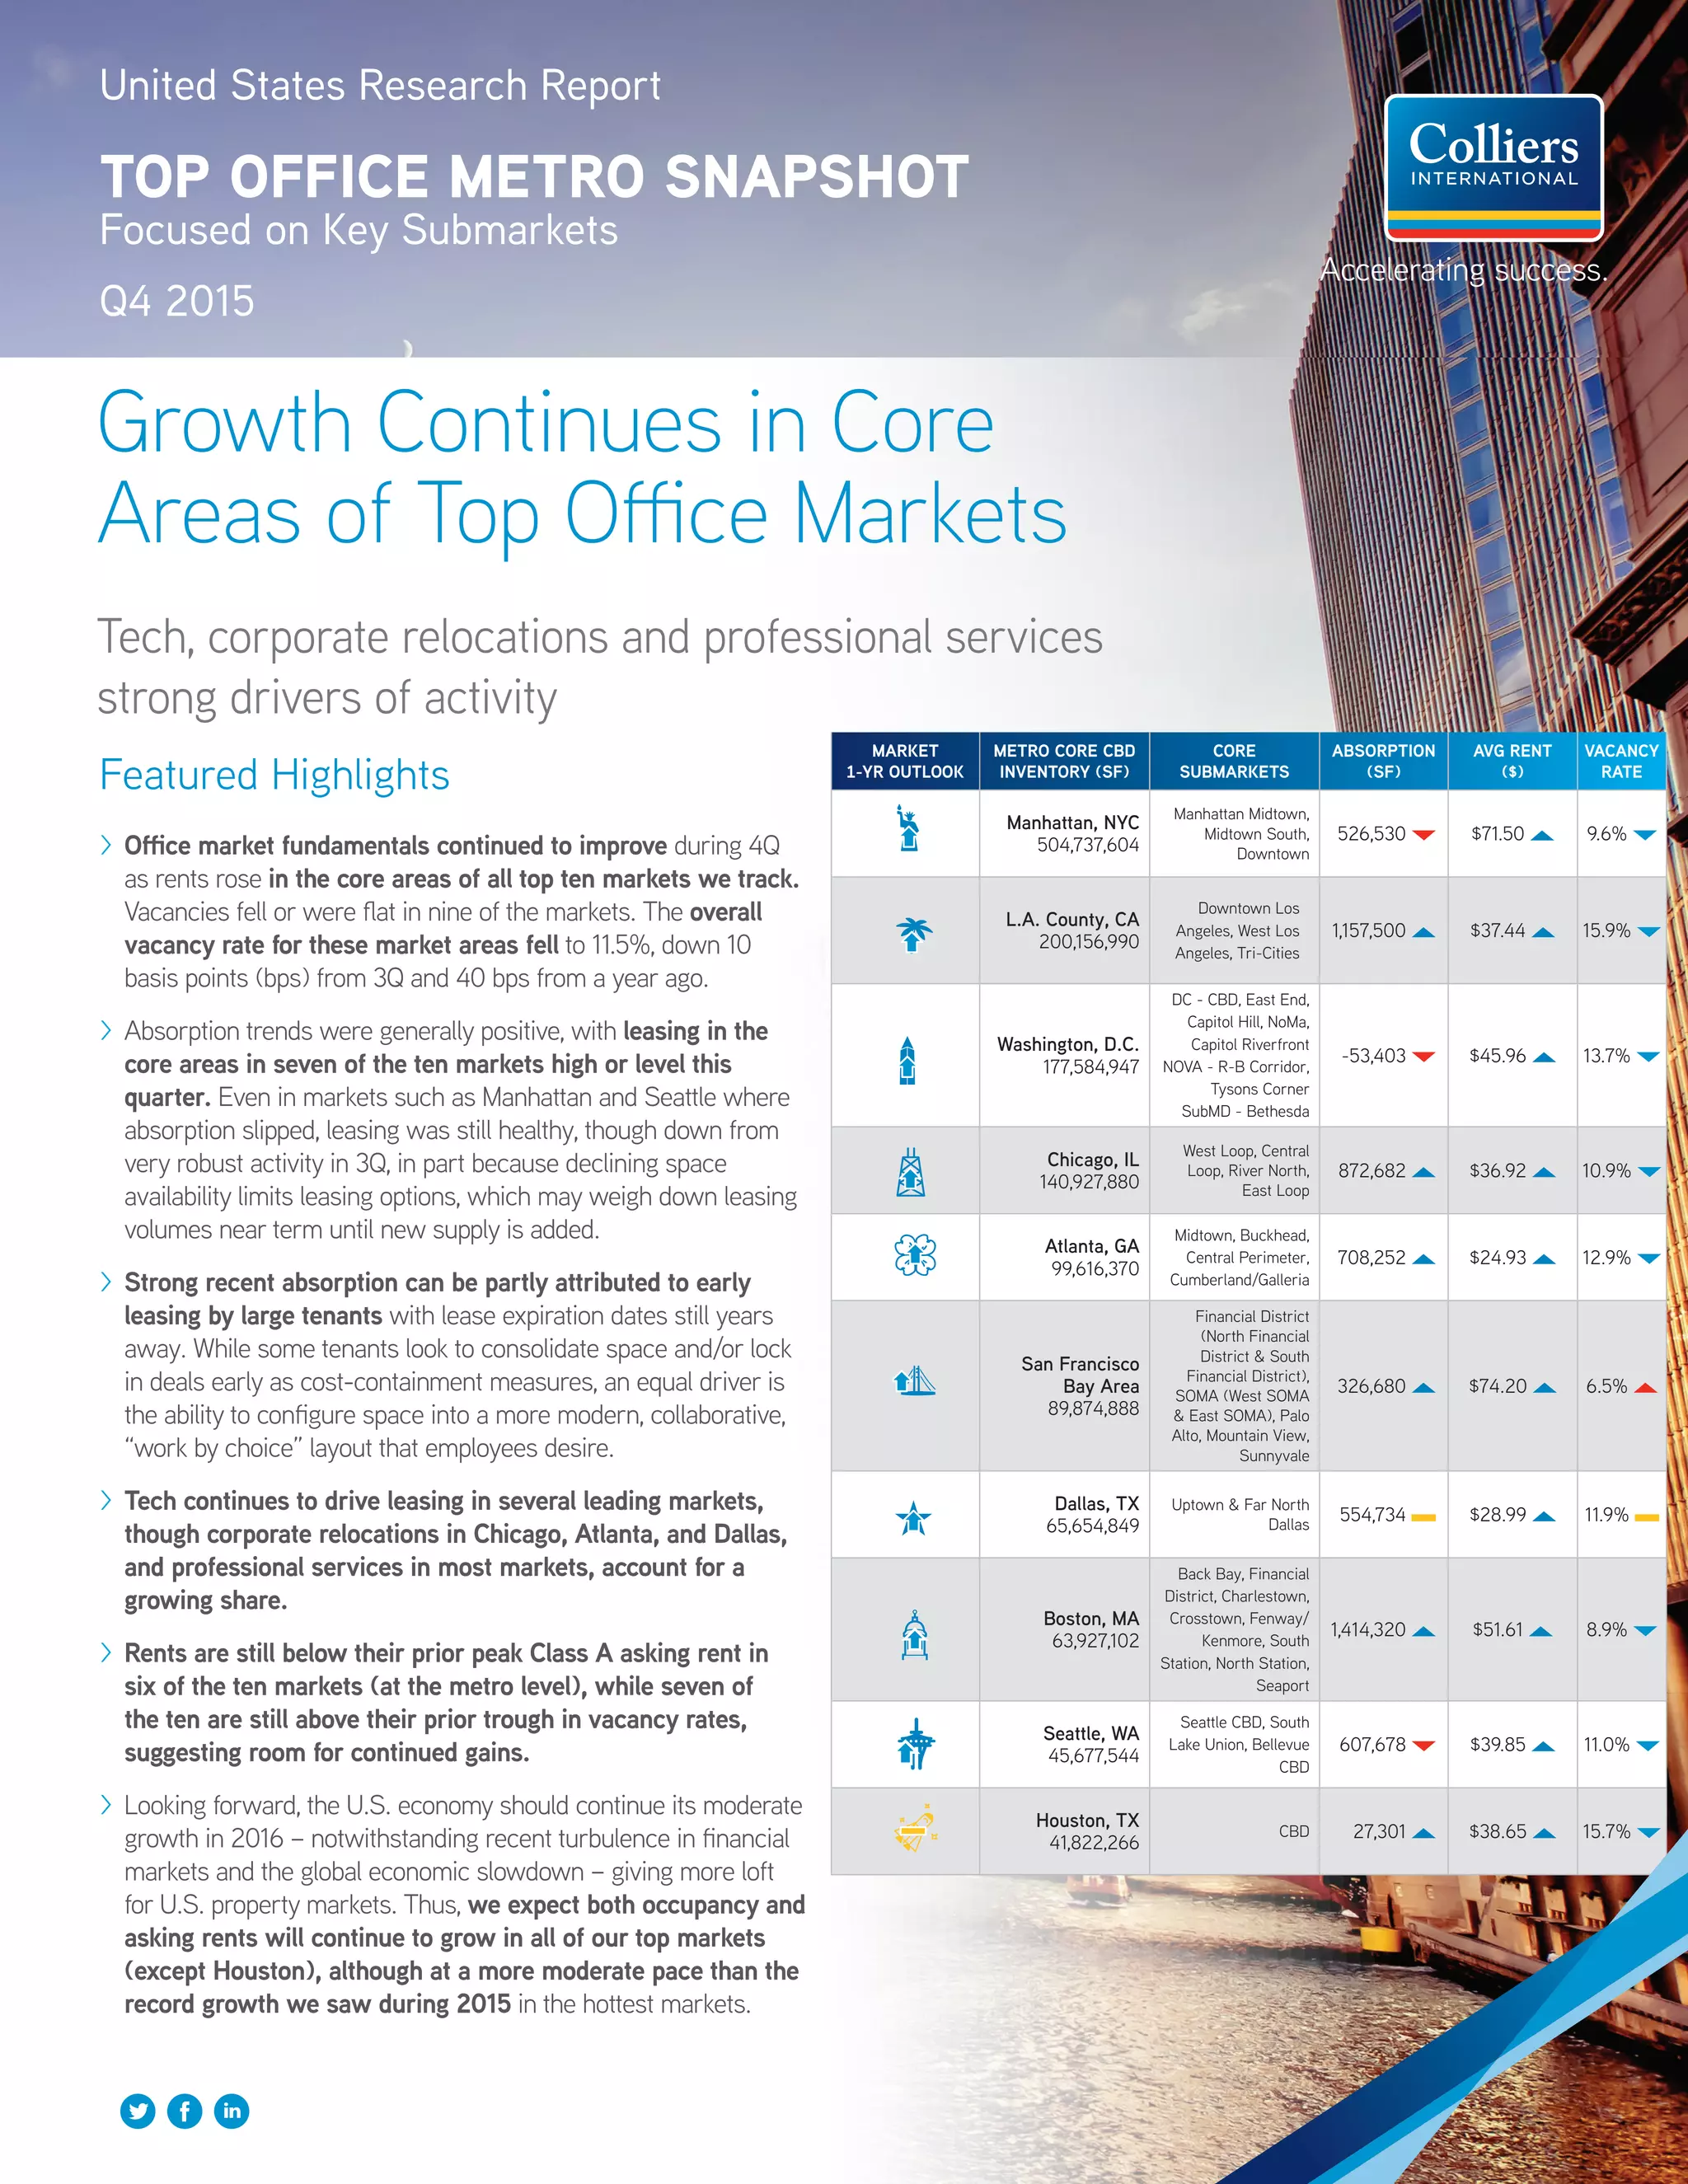
United States Research Report
TOP OFFICE METRO SNAPSHOT
Focused on Key Submarkets
Q4 2015
Featured Highlights
>> Office market fundamentals continued to improve during 4Q
as rents rose in the core areas of all top ten markets we track.
Vacancies fell or were flat in nine of the markets. The overall
vacancy rate for these market areas fell to 11.5%, down 10
basis points (bps) from 3Q and 40 bps from a year ago.
>> Absorption trends were generally positive, with leasing in the
core areas in seven of the ten markets high or level this
quarter. Even in markets such as Manhattan and Seattle where
absorption slipped, leasing was still healthy, though down from
very robust activity in 3Q, in part because declining space
availability limits leasing options, which may weigh down leasing
volumes near term until new supply is added.
>> Strong recent absorption can be partly attributed to early
leasing by large tenants with lease expiration dates still years
away. While some tenants look to consolidate space and/or lock
in deals early as cost-containment measures, an equal driver is
the ability to configure space into a more modern, collaborative,
“work by choice” layout that employees desire.
>> Tech continues to drive leasing in several leading markets,
though corporate relocations in Chicago, Atlanta, and Dallas,
and professional services in most markets, account for a
growing share.
>> Rents are still below their prior peak Class A asking rent in
six of the ten markets (at the metro level), while seven of
the ten are still above their prior trough in vacancy rates,
suggesting room for continued gains.
>> Looking forward, the U.S. economy should continue its moderate
growth in 2016 – notwithstanding recent turbulence in financial
markets and the global economic slowdown – giving more loft
for U.S. property markets. Thus, we expect both occupancy and
asking rents will continue to grow in all of our top markets
(except Houston), although at a more moderate pace than the
record growth we saw during 2015 in the hottest markets.
Growth Continues in Core
Areas of Top Office Markets
Tech, corporate relocations and professional services
strong drivers of activity
MARKET
1-YR OUTLOOK
METRO CORE CBD
INVENTORY (SF)
CORE
SUBMARKETS
ABSORPTION
(SF)
AVG RENT
($)
VACANCY
RATE
Manhattan, NYC
         504,737,604
Manhattan Midtown,
Midtown South,
Downtown
526,530 $71.50 9.6%
L.A. County, CA
       200,156,990
Downtown Los
Angeles, West Los
Angeles, Tri-Cities
1,157,500 $37.44 15.9%
Washington, D.C.
  177,584,947
DC - CBD, East End,
Capitol Hill, NoMa,
Capitol Riverfront
NOVA - R-B Corridor,
Tysons Corner
SubMD - Bethesda
-53,403 $45.96 13.7%
Chicago, IL
       140,927,880
West Loop, Central
Loop, River North,
East Loop
872,682 $36.92 10.9%
Atlanta, GA    
99,616,370
Midtown, Buckhead,
Central Perimeter,
Cumberland/Galleria
708,252 $24.93 12.9%
San Francisco
Bay Area
     89,874,888
Financial District
(North Financial
District & South
Financial District),
SOMA (West SOMA
& East SOMA), Palo
Alto, Mountain View,
Sunnyvale
326,680 $74.20 6.5%
Dallas, TX
      65,654,849
Uptown & Far North
Dallas
554,734 $28.99 11.9%
Boston, MA
63,927,102
Back Bay, Financial
District, Charlestown,
Crosstown, Fenway/
Kenmore, South
Station, North Station,
Seaport
1,414,320 $51.61 8.9%
Seattle, WA
45,677,544
Seattle CBD, South
Lake Union, Bellevue
CBD
607,678 $39.85 11.0%
Houston, TX   
41,822,266
CBD 27,301 $38.65 15.7%
LOCAL INSIGHTS
>> The diversification of tenants has helped drive the Downtown
submarket. Consumer goods tenants such as Hugo Boss and Hudson’s
Bay as well as law firms, media and engineering firms moving into the
submarket have decreased reliance on the financial sector.
>> Midtown continues to be strong as the submarket has not yet reached
its previous peak in asking rents. More than four million square feet
of office construction is underway or in the pipeline in Midtown
to compete with the 19 million square feet being constructed in
the neighboring Hudson Yards/Manhattan West area of Midtown
South. The Hudson Yards/Manhattan West area has seen significant
commitments in buildings being developed by Related and Brookfield
while other developments await anchor tenants.
>> While the third quarter saw technology, advertising, media and
information services (TAMI) firms overtake financial services,
insurance and real estate (FIRE) companies in terms of total square
footage leased in Manhattan, the fourth quarter saw the FIRE sector
regain the top spot with 36% of total leasing vs. a 23% share for
TAMI. Of note was WeWork’s 900,000 square feet of leases in 2015,
which accounted for 3% of all Manhattan leasing and 9% of all FIRE
sector leasing. The TAMI sector did register the largest deal of 2015,
however - a 582,000 square foot renewal/expansion by Publicis
Groupe at 1675 Broadway.
>> While tech firms have gravitated to areas such as Santa Monica
and Silicon Beach, further development opportunities are limited.
Seeing the success other metros have had redeveloping older
building stock for tech tenants, developers in the Arts District of
Downtown Los Angeles have been rehabbing that area’s older
B-stock and functionally obsolescent industrial buildings in hopes
of becoming a new tech hub.
>> Co-working firms have been active across the market, from
Pasadena to Downtown Los Angeles. They provide an affordable
alternative with short-term commitments for companies focusing on
growing their business before transitioning to traditional office leases.
>> Absorption remains positive, although there has been a slowdown
in momentum. Vacancy rates have been decreasing, but they
haven’t been decreasing sharply enough to justify the continuing 3
to 3.5% annual escalations in rent.
>> Firms that need access to the federal government and lobbying
activities concentrate in the downtown areas of the CBD, East
End and Capitol Hill in the District. Local tech firms also prefer to
be located in these downtown submarkets, enabling them to take
advantage of the experienced talent pool.
>> Just outside of the District, Tysons Corner in undergoing a
renaissance as the federal government contracting industry enjoys
the proximity to both Washington, DC and Dulles International
Airport. In addition, new buildings such as 1775 Tysons Boulevard
are incorporating a more collaborative environment (concierge
services, Wi-Fi social lounge, elevated terraces, health club, etc.) to
lure tech tenants.
>> For the first time in several years, law firms are not contracting.
While there aren’t strong signs of expansion yet, the maintaining of
their current footprints is a step in the right direction.
>> Corporate migration into the CBD is the biggest driver of activity.
Recent relocations include ConAgra Foods from Omaha, NE and
Motorola Solutions from Suburban Chicago. CBD locations help in
recruitment of young talent who live Downtown and want access to
public transportation for commuting.
>> The phase-in of an 18% property tax increase over the next four
years to address shortfalls in public pension funding could deter
future corporate headquarters relocations, as the city is no longer
offering tax breaks to lure firms.
>> While tech tenants have generally preferred the River North area in
recent years, Google’s converted storage facility in the Fulton Market
submarket is attracting more development geared to the needs of
tech firms. Shared office space companies are very active in all
submarkets, signing leases of between 50,000-80,000 square feet.
>> Professional services firms and corporate headquarters relocations
are the major drivers of activity in the area. Mercedes Benz
is constructing a 250,000 square foot facility for its U.S. HQ
relocation from New Jersey and Porsche, relocating from nearby
Sandy Springs, GA, recently opened its new $100 million HQ
facility near the Hartsfield-Jackson Airport.
>> The growing tech presence has been concentrated in the Midtown
submarket. A top example is the conversion of a former Sears
Roebuck warehouse and regional office into Ponce City Market,
a successful 2.1 million square foot mixed-use live/work/play
redevelopment that appeals to tech firms and their employees.
>> Competition for prime, Class A space has driven rents up to new
heights across the Central Perimeter, Midtown and Buckhead
submarkets. Asking rents in Buckhead are up by 24% from 2014.
However, new construction to satiate demand is limited, with only
one spec development currently under construction.
>> The Q4 rise in vacancy in San Francisco is attributed to the
delivery of 1.2 million square feet of new construction – all of
which is preleased, but won’t be occupied until Q1/Q2 2016 –
rather than a softening of the market. It was a record year as Class
A effective rents in the city increased over 12% year-on-year and
Class B rents increased over 20%. Further growth is expected in
2016, albeit at a more moderate pace. Many tech tenants remain
willing to pay these elevated rents to stay in the area rather than
migrate out of state.
>> With vacancies under 1% in key tech submarkets of the Peninsula,
companies are turning to purchasing land in order to expand, such
as Apple’s purchase of 98 acres in Cupertino to build a second
campus. Large tenants are pushing out smaller start-ups either by
paying more or buying buildings and absorbing space as existing
leases expire.
>> Issues to watch include: whether or not sizeable amounts of
sublease space will hit the market as firms move to newly
constructed HQ’s; the impact on expansions if venture capital
funding pulls back measurably from its current record levels; and
concern regarding housing affordability and its impact on attracting
talent.
NewYorkWashington,DC
Chicago
LosAngeles
SanFrancisco
Top Office Metro Snapshot | Colliers International2
Atlanta
>> Corporate relocations remain one of the main drivers in Dallas. Many
firms relocating to Texas cite the low cost of living, steady population
growth, available workforce and quality education as factors. Over
500 companies have relocated their corporate headquarters to Texas
over the last five years.
>> The affordability of housing is also a major draw for these companies
in retaining employees. For example, with Toyota’s relocation from
Torrance, CA to Plano, TX, the company can keep employee pay at
the same level and those employees benefit from housing costs that
are roughly one-third those of California.
>> General population growth combined with corporate relocations
are driving massive development. On the border between Plano
and Frisco, approximately 30 minutes north of downtown Dallas,
there are several mixed-use developments totaling $7 billion either
announced or underway within a three-mile span which includes
Frisco’s “$5-billion mile”.
>> Traditional boundaries with respect to submarket location
preferences according to tenant industry have blurred and pricing
has played a role in that transition. Tech firms began moving to
the Financial District after being priced out of Cambridge, and life
sciences companies who traditionally desired the Kendall Square and
Cambridge neighborhoods are now looking elsewhere as rents have
risen on what limited space is available.
>> Public transportation remains a key factor in these moves. The
Financial District is only three stops from Cambridge on the Red
Line, for example. The areas around North Station, a major transit
hub, as well as the Seaport, are up and coming for tech firms as they
have the edgy, creative, loft space that these firms desire.
>> Law firms have stabilized head counts and space requirements
after several years of downsizing. Shared workspace companies
are active and growing, and in some cases leasing space that hadn’t
seen a lot of interest from other firms.
>> Tech growth continues to drive the Seattle area. Amazon expanded
its global headquarters during Q4 2015 by delivering the first of
three 1.1 million square foot office towers. These developments
increase Amazon’s total commitments to roughly 11 million square
feet in the Downtown Seattle submarkets of Lake Union and
Belltown. Many Silicon Valley-based tech firms such as Facebook,
Google, Apple, Oracle, and Salesforce have expanded their Seattle
satellite offices to tap into the area’s deep engineering talent pool
and high quality of life.
>> Demand for space in core urban submarkets remains strong as
tech companies leverage prime office space to attract and retain
the millennial workforce that has gravitated to living in these
areas. As the availability of creative loft-style space has dried
up, landlords are modernizing traditional Class A towers; adding
amenities such as amenity rich lobbies, fitness centers, and even
bicycle lockers in order to compete for the growing demand from
tech firms. This competition for space has driven Class A asking
rents up 9.7% year-on-year.
>> One area of potential concern is the millions of square feet of
speculative projects under construction and planned to be delivered
over the next 18-36 months into the CBD. Will the fast pace of
absorption over the past 24 months continue unabated, or could
broader headwinds that face the tech sector slow the pace of
expansion plans in Seattle?
>> As goes the energy market, so goes the office market in Houston.
The sustained low levels in oil pricing have precipitated rounds of
layoffs and corporate downsizing as sublease space is flooding the
market. The strong correlation between the WTI Spot Price and
Class A vacancy rates is undeniable, as $120+ per barrel prices
led to sub-10% vacancy in 2008 while the current $30 per barrel
prices have driven vacancy up to the 15% range.
>> One of the bright spots in the market is a booming petrochemical
industry, reaping the rewards of low-priced raw materials. The
housing market is also performing well now, as developers barely
kept pace with demand during the last boom, and there is not an
abundance of excess housing stock.
>> Looking forward, vacancy rates are anticipated to rise as major
energy firms leave leased space and move into new owner-
occupied developments that continue to work through the
construction pipeline. This leaves opportunity for firms seeking
to upgrade their offices at an affordable price as landlords are
renovating many of these vacated buildings to attract new
tenants.
Copyright © 2015 Colliers International.
The information contained herein has been obtained from sources deemed reliable. While every reasonable effort has been made to ensure its accuracy, we cannot guarantee it.
No responsibility is assumed for any inaccuracies. Readers are encouraged to consult their professional advisors prior to acting on any of the material contained in this report.
Colliers International
666 Fifth Avenue
New York, NY 10103
+1 212 716 3500
colliers.com
OFFICE SERVICES | contact
Cynthia Foster		
President,
National Office Services
+1 212 716 3515
cynthia.foster@colliers.com
RESEARCH | contact
Pete Culliney
Director of Research | Global
+1 212 716 3698
pete.culliney@colliers.com
Michael Roessle
Director of National Research | USA
+1 212 716 3699
michael.roessle@colliers.com
Seattle
BostonDallas
Houston

Top Office Metros 2015 4Q

  • 1.
    United States ResearchReport TOP OFFICE METRO SNAPSHOT Focused on Key Submarkets Q4 2015 Featured Highlights >> Office market fundamentals continued to improve during 4Q as rents rose in the core areas of all top ten markets we track. Vacancies fell or were flat in nine of the markets. The overall vacancy rate for these market areas fell to 11.5%, down 10 basis points (bps) from 3Q and 40 bps from a year ago. >> Absorption trends were generally positive, with leasing in the core areas in seven of the ten markets high or level this quarter. Even in markets such as Manhattan and Seattle where absorption slipped, leasing was still healthy, though down from very robust activity in 3Q, in part because declining space availability limits leasing options, which may weigh down leasing volumes near term until new supply is added. >> Strong recent absorption can be partly attributed to early leasing by large tenants with lease expiration dates still years away. While some tenants look to consolidate space and/or lock in deals early as cost-containment measures, an equal driver is the ability to configure space into a more modern, collaborative, “work by choice” layout that employees desire. >> Tech continues to drive leasing in several leading markets, though corporate relocations in Chicago, Atlanta, and Dallas, and professional services in most markets, account for a growing share. >> Rents are still below their prior peak Class A asking rent in six of the ten markets (at the metro level), while seven of the ten are still above their prior trough in vacancy rates, suggesting room for continued gains. >> Looking forward, the U.S. economy should continue its moderate growth in 2016 – notwithstanding recent turbulence in financial markets and the global economic slowdown – giving more loft for U.S. property markets. Thus, we expect both occupancy and asking rents will continue to grow in all of our top markets (except Houston), although at a more moderate pace than the record growth we saw during 2015 in the hottest markets. Growth Continues in Core Areas of Top Office Markets Tech, corporate relocations and professional services strong drivers of activity MARKET 1-YR OUTLOOK METRO CORE CBD INVENTORY (SF) CORE SUBMARKETS ABSORPTION (SF) AVG RENT ($) VACANCY RATE Manhattan, NYC          504,737,604 Manhattan Midtown, Midtown South, Downtown 526,530 $71.50 9.6% L.A. County, CA        200,156,990 Downtown Los Angeles, West Los Angeles, Tri-Cities 1,157,500 $37.44 15.9% Washington, D.C.   177,584,947 DC - CBD, East End, Capitol Hill, NoMa, Capitol Riverfront NOVA - R-B Corridor, Tysons Corner SubMD - Bethesda -53,403 $45.96 13.7% Chicago, IL        140,927,880 West Loop, Central Loop, River North, East Loop 872,682 $36.92 10.9% Atlanta, GA     99,616,370 Midtown, Buckhead, Central Perimeter, Cumberland/Galleria 708,252 $24.93 12.9% San Francisco Bay Area      89,874,888 Financial District (North Financial District & South Financial District), SOMA (West SOMA & East SOMA), Palo Alto, Mountain View, Sunnyvale 326,680 $74.20 6.5% Dallas, TX       65,654,849 Uptown & Far North Dallas 554,734 $28.99 11.9% Boston, MA 63,927,102 Back Bay, Financial District, Charlestown, Crosstown, Fenway/ Kenmore, South Station, North Station, Seaport 1,414,320 $51.61 8.9% Seattle, WA 45,677,544 Seattle CBD, South Lake Union, Bellevue CBD 607,678 $39.85 11.0% Houston, TX    41,822,266 CBD 27,301 $38.65 15.7%
  • 2.
    LOCAL INSIGHTS >> Thediversification of tenants has helped drive the Downtown submarket. Consumer goods tenants such as Hugo Boss and Hudson’s Bay as well as law firms, media and engineering firms moving into the submarket have decreased reliance on the financial sector. >> Midtown continues to be strong as the submarket has not yet reached its previous peak in asking rents. More than four million square feet of office construction is underway or in the pipeline in Midtown to compete with the 19 million square feet being constructed in the neighboring Hudson Yards/Manhattan West area of Midtown South. The Hudson Yards/Manhattan West area has seen significant commitments in buildings being developed by Related and Brookfield while other developments await anchor tenants. >> While the third quarter saw technology, advertising, media and information services (TAMI) firms overtake financial services, insurance and real estate (FIRE) companies in terms of total square footage leased in Manhattan, the fourth quarter saw the FIRE sector regain the top spot with 36% of total leasing vs. a 23% share for TAMI. Of note was WeWork’s 900,000 square feet of leases in 2015, which accounted for 3% of all Manhattan leasing and 9% of all FIRE sector leasing. The TAMI sector did register the largest deal of 2015, however - a 582,000 square foot renewal/expansion by Publicis Groupe at 1675 Broadway. >> While tech firms have gravitated to areas such as Santa Monica and Silicon Beach, further development opportunities are limited. Seeing the success other metros have had redeveloping older building stock for tech tenants, developers in the Arts District of Downtown Los Angeles have been rehabbing that area’s older B-stock and functionally obsolescent industrial buildings in hopes of becoming a new tech hub. >> Co-working firms have been active across the market, from Pasadena to Downtown Los Angeles. They provide an affordable alternative with short-term commitments for companies focusing on growing their business before transitioning to traditional office leases. >> Absorption remains positive, although there has been a slowdown in momentum. Vacancy rates have been decreasing, but they haven’t been decreasing sharply enough to justify the continuing 3 to 3.5% annual escalations in rent. >> Firms that need access to the federal government and lobbying activities concentrate in the downtown areas of the CBD, East End and Capitol Hill in the District. Local tech firms also prefer to be located in these downtown submarkets, enabling them to take advantage of the experienced talent pool. >> Just outside of the District, Tysons Corner in undergoing a renaissance as the federal government contracting industry enjoys the proximity to both Washington, DC and Dulles International Airport. In addition, new buildings such as 1775 Tysons Boulevard are incorporating a more collaborative environment (concierge services, Wi-Fi social lounge, elevated terraces, health club, etc.) to lure tech tenants. >> For the first time in several years, law firms are not contracting. While there aren’t strong signs of expansion yet, the maintaining of their current footprints is a step in the right direction. >> Corporate migration into the CBD is the biggest driver of activity. Recent relocations include ConAgra Foods from Omaha, NE and Motorola Solutions from Suburban Chicago. CBD locations help in recruitment of young talent who live Downtown and want access to public transportation for commuting. >> The phase-in of an 18% property tax increase over the next four years to address shortfalls in public pension funding could deter future corporate headquarters relocations, as the city is no longer offering tax breaks to lure firms. >> While tech tenants have generally preferred the River North area in recent years, Google’s converted storage facility in the Fulton Market submarket is attracting more development geared to the needs of tech firms. Shared office space companies are very active in all submarkets, signing leases of between 50,000-80,000 square feet. >> Professional services firms and corporate headquarters relocations are the major drivers of activity in the area. Mercedes Benz is constructing a 250,000 square foot facility for its U.S. HQ relocation from New Jersey and Porsche, relocating from nearby Sandy Springs, GA, recently opened its new $100 million HQ facility near the Hartsfield-Jackson Airport. >> The growing tech presence has been concentrated in the Midtown submarket. A top example is the conversion of a former Sears Roebuck warehouse and regional office into Ponce City Market, a successful 2.1 million square foot mixed-use live/work/play redevelopment that appeals to tech firms and their employees. >> Competition for prime, Class A space has driven rents up to new heights across the Central Perimeter, Midtown and Buckhead submarkets. Asking rents in Buckhead are up by 24% from 2014. However, new construction to satiate demand is limited, with only one spec development currently under construction. >> The Q4 rise in vacancy in San Francisco is attributed to the delivery of 1.2 million square feet of new construction – all of which is preleased, but won’t be occupied until Q1/Q2 2016 – rather than a softening of the market. It was a record year as Class A effective rents in the city increased over 12% year-on-year and Class B rents increased over 20%. Further growth is expected in 2016, albeit at a more moderate pace. Many tech tenants remain willing to pay these elevated rents to stay in the area rather than migrate out of state. >> With vacancies under 1% in key tech submarkets of the Peninsula, companies are turning to purchasing land in order to expand, such as Apple’s purchase of 98 acres in Cupertino to build a second campus. Large tenants are pushing out smaller start-ups either by paying more or buying buildings and absorbing space as existing leases expire. >> Issues to watch include: whether or not sizeable amounts of sublease space will hit the market as firms move to newly constructed HQ’s; the impact on expansions if venture capital funding pulls back measurably from its current record levels; and concern regarding housing affordability and its impact on attracting talent. NewYorkWashington,DC Chicago LosAngeles SanFrancisco Top Office Metro Snapshot | Colliers International2 Atlanta
  • 3.
    >> Corporate relocationsremain one of the main drivers in Dallas. Many firms relocating to Texas cite the low cost of living, steady population growth, available workforce and quality education as factors. Over 500 companies have relocated their corporate headquarters to Texas over the last five years. >> The affordability of housing is also a major draw for these companies in retaining employees. For example, with Toyota’s relocation from Torrance, CA to Plano, TX, the company can keep employee pay at the same level and those employees benefit from housing costs that are roughly one-third those of California. >> General population growth combined with corporate relocations are driving massive development. On the border between Plano and Frisco, approximately 30 minutes north of downtown Dallas, there are several mixed-use developments totaling $7 billion either announced or underway within a three-mile span which includes Frisco’s “$5-billion mile”. >> Traditional boundaries with respect to submarket location preferences according to tenant industry have blurred and pricing has played a role in that transition. Tech firms began moving to the Financial District after being priced out of Cambridge, and life sciences companies who traditionally desired the Kendall Square and Cambridge neighborhoods are now looking elsewhere as rents have risen on what limited space is available. >> Public transportation remains a key factor in these moves. The Financial District is only three stops from Cambridge on the Red Line, for example. The areas around North Station, a major transit hub, as well as the Seaport, are up and coming for tech firms as they have the edgy, creative, loft space that these firms desire. >> Law firms have stabilized head counts and space requirements after several years of downsizing. Shared workspace companies are active and growing, and in some cases leasing space that hadn’t seen a lot of interest from other firms. >> Tech growth continues to drive the Seattle area. Amazon expanded its global headquarters during Q4 2015 by delivering the first of three 1.1 million square foot office towers. These developments increase Amazon’s total commitments to roughly 11 million square feet in the Downtown Seattle submarkets of Lake Union and Belltown. Many Silicon Valley-based tech firms such as Facebook, Google, Apple, Oracle, and Salesforce have expanded their Seattle satellite offices to tap into the area’s deep engineering talent pool and high quality of life. >> Demand for space in core urban submarkets remains strong as tech companies leverage prime office space to attract and retain the millennial workforce that has gravitated to living in these areas. As the availability of creative loft-style space has dried up, landlords are modernizing traditional Class A towers; adding amenities such as amenity rich lobbies, fitness centers, and even bicycle lockers in order to compete for the growing demand from tech firms. This competition for space has driven Class A asking rents up 9.7% year-on-year. >> One area of potential concern is the millions of square feet of speculative projects under construction and planned to be delivered over the next 18-36 months into the CBD. Will the fast pace of absorption over the past 24 months continue unabated, or could broader headwinds that face the tech sector slow the pace of expansion plans in Seattle? >> As goes the energy market, so goes the office market in Houston. The sustained low levels in oil pricing have precipitated rounds of layoffs and corporate downsizing as sublease space is flooding the market. The strong correlation between the WTI Spot Price and Class A vacancy rates is undeniable, as $120+ per barrel prices led to sub-10% vacancy in 2008 while the current $30 per barrel prices have driven vacancy up to the 15% range. >> One of the bright spots in the market is a booming petrochemical industry, reaping the rewards of low-priced raw materials. The housing market is also performing well now, as developers barely kept pace with demand during the last boom, and there is not an abundance of excess housing stock. >> Looking forward, vacancy rates are anticipated to rise as major energy firms leave leased space and move into new owner- occupied developments that continue to work through the construction pipeline. This leaves opportunity for firms seeking to upgrade their offices at an affordable price as landlords are renovating many of these vacated buildings to attract new tenants. Copyright © 2015 Colliers International. The information contained herein has been obtained from sources deemed reliable. While every reasonable effort has been made to ensure its accuracy, we cannot guarantee it. No responsibility is assumed for any inaccuracies. Readers are encouraged to consult their professional advisors prior to acting on any of the material contained in this report. Colliers International 666 Fifth Avenue New York, NY 10103 +1 212 716 3500 colliers.com OFFICE SERVICES | contact Cynthia Foster President, National Office Services +1 212 716 3515 cynthia.foster@colliers.com RESEARCH | contact Pete Culliney Director of Research | Global +1 212 716 3698 pete.culliney@colliers.com Michael Roessle Director of National Research | USA +1 212 716 3699 michael.roessle@colliers.com Seattle BostonDallas Houston