The document summarizes lessons learned from analyzing the financial performance of technology, media, and telecommunications (TMT) companies over the past five years (2009-2013). Key points:
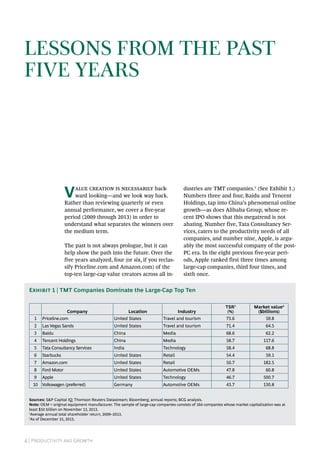
- TMT companies dominated the top ten largest value creators across all industries during this period.
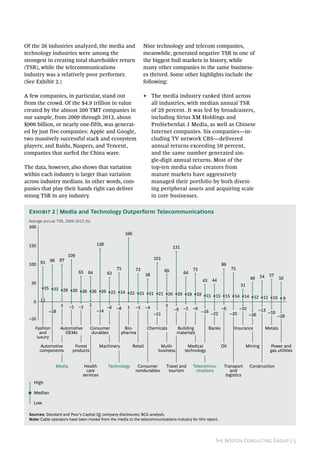
- Media and technology industries outperformed in creating shareholder returns, while telecom performed relatively poorly.
- Variation in performance within each industry was larger than across industries, showing the importance of company strategy.
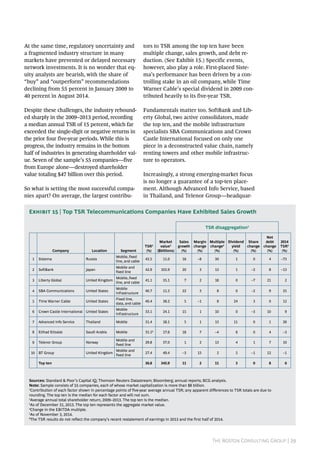
- A small number of companies, like Apple, Google, Baidu, Naspers, and Tencent, created a disproportionate amount of total value.
- Amazon's CTO outlined the case for 'edge computing', where data is processed locally on devices rather than in the cloud, due to laws of physics, economics, and regulations. This validates the growing concept of edge computing.
- Key questions include how Amazon will price its new Greengrass edge computing software over time, and whether it will extend further beyond the cloud.
- Asian appetite for acquiring European tech companies has grown strongly since 2014, with Japan and China driving most deals. The UK is the primary target, though networks between Asia and Europe are still developing.
This regularly-updated collection from Atomico discusses interesting things in tech and VC that may not receive widespread attention. It includes questions about Macron's ability to implement his pro-business agenda in France and boost the country's tech sector. Other items discuss the rise of new internet giants in China called TMD, emerging trends in Europe's investing landscape including more sector-focused funds, and legal and policy issues around law enforcement access to consumer data from IoT devices and tech companies. Recent M&A deals are also summarized, such as Gett acquiring Juno and Cisco purchasing Viptela.
This document summarizes the evolution and maturation of the global outsourcing industry. It discusses how outsourcing is becoming more sophisticated, with providers expanding globally and standardizing processes. The industry is consolidating into large full-service vendors and specialist niche providers. Outsourcing is shifting from simple cost-cutting transactions to helping transform clients' operations. In the future, outsourced services may be purchased à la carte through an interoperable utility model. However, challenges around credibility, workforce management, and talent retention remain.
Social Capital Hedosophia, a venture capital firm, is partnering with another firm to launch a publicly-listed holding company seeking to raise $500 million. The goal is to provide an alternative path for technology companies to go public by acquiring high-growth companies. Key questions around the plan include how investors will respond to the IPO and new models of funding companies, and what types of companies the holding company will seek to acquire.
Global Services Digital Magazine October Issue 2Niketa Chauhan
This issue is all about change; how microtrends will become waves of change or systemic shocks like the recession can reset the economy and the market.
This document provides an overview of trends, drivers, and valuation metrics in the technology, media, and telecommunications (TMT) industry. It discusses how cloud computing, mobile technology, and social networks are converging and transforming the industry. Valuation of TMT companies has changed from using traditional discounted cash flow models to utilizing multiples of metrics like revenues, EBITDA, and free cash flows. The document analyzes sectors like media, communications chips, and storage and discusses company valuations and growth opportunities in these areas driven by developments in cloud, mobile, and social media.
Is the next Uber coming your way?
CxOs are on high alert for competitors coming out of nowhere. Prepare for disruption – read the Global C-suite study.
The document provides an overview of recent tech and venture capital news and events through a series of short summaries:
1) Mobile World Congress saw continued momentum towards 5G but fragmentation in IoT and stagnation in smartphones. FCC may rollback net neutrality regulations.
2) Buyout funds have record dry powder and software deals have significantly outperformed, which could drive increased buyout activity in tech.
3) The UK government outlined its post-Brexit digital strategy focused on connectivity, skills, and making the UK a leader in digital business and data usage.
4) IBM is taking steps to commercialize quantum computing through partnerships to solve currently unsolvable problems in areas like drug discovery, supply
The Global ICT 50: The Supply Side of DigitizationFlorian Gröne
For the top 50 companies providing IT and telecom hardware, software, and services, the world is changing dramatically. How these suppliers respond will transform the world for the rest of us. Based on an analysis of the four factors determining success for digital providers, this article shows why the four different supplier categories—hardware and infrastructure companies, software and Internet companies, IT service providers, and telecom operators—have different growth trajectories and competitive prospects.
The ICT sector is a major industry in Toronto, employing over 175,000 workers and generating $52 billion annually. It faces challenges retaining small innovative firms and ensuring an adequate talent supply. The city supports the sector through initiatives partnering with industry to attract talent, increase affordable space, and support start-ups and incubators. A strong ICT sector is critical to Toronto's economic success.
LinkedIn, office space toronto, toronto commercial office space, toronto executive office space, toronto office space for rent, commercial real estate toronto, toronto commercial real estate, sublease office space toronto
Deloitte is a global network of professional services firms that provides audit, consulting, financial advisory, risk management, and tax services. It operates through individual member firms in various countries, which are separate legal entities. The document provides a brief overview of Deloitte and its legal structure, noting that services may vary by country and rules and regulations. It also contains standard disclaimers regarding the general nature of its content and advising readers to consult professionals regarding specific situations.
The Strategy& Global ICT 50, an annual survey of the 50 most influential technology companies, finds that the battle for the cloud is heating up and every tech company will be affected. For more insights, visit strategy-business.com
Roland berger automotive_landscape_2025_20110314lauri213
The document discusses trends in the global automotive industry out to the year 2025. It finds that sales and production capacity will dramatically shift to Asia, with China becoming a major hub. This shift could put 300,000 automotive jobs in Europe at risk. Electric vehicles may reach 10% market share by 2025, with hybrids capturing 40%, though internal combustion engines will still power half of new vehicles. Connected cars will also increase, though intelligent transportation solutions will still be largely visionary. Established companies must adapt to challenges from low-cost competitors, new technologies, and new business models like mobility services.
As the boundaries blur among hardware, software, services, and telecom, tech sectors become less relevant. Tech companies now distinguish themselves through their strategic identity. This analysis of leading enterprise-oriented information and communications technology (ICT) companies shows them competing for customers -- but setting themselves apart in new ways.
This document summarizes the key findings from a study by the IBM Institute for Business Value on changing competitive dynamics. The study surveyed over 5,000 C-suite executives from various industries. The main findings are:
1) Executives see industry convergence and digital invaders as major threats, as boundaries between industries blur and new entrants disrupt traditional value chains.
2) Technology factors and market changes are transforming the competitive landscape at an unprecedented rate, making it difficult for companies to predict threats.
3) To prepare for disruption, executives plan to focus more on customers as individuals, access external innovation through partnerships, and decentralize decision-making.
This document summarizes the key findings from a study by the IBM Institute for Business Value on changing competitive dynamics. The study surveyed over 5,000 C-suite executives from various industries. The main findings are:
1) Executives see industry convergence and digital invaders as major threats, as boundaries between industries blur and new entrants disrupt traditional value chains.
2) Technology factors and market changes are transforming the competitive landscape at an unprecedented rate, making it difficult for companies to predict threats.
3) To adapt, executives plan to focus more on customers as individuals, access external innovation through partnerships, and decentralize decision-making to respond faster to changes.
Summary of March 2015 BRIE-ETLA Special Issue in the Journal of Industry, Com...Petri Rouvinen
This special issue of the Journal of Industry, Competition and Trade focuses on the digital disruption and its societal impacts. Several articles examine how digitalization and cloud computing are transforming industries and challenging previous leaders. The transition from scarce to abundant computing resources through cloud architectures is disrupting the IT sector. The control point of platforms is shifting from devices to the cloud. While big data has potential, it has not yet led to disruptive new business models at a systemic level. National policies influence how digital changes impact countries, with debates emerging around issues like antitrust regulations.
Online survey of companies → Goal: Understanding the role of
artificial intelligence (AI) and machine learning across countries
and industries
• Evaluation: Which companies are active leaders in adopting or
piloting AI
The document summarizes a presentation given by Bill Barney, CEO of Reliance Communications & Global Cloud Xchange, at the WAN Summit in San Jose on June 14, 2017 about how smart networks are changing the corporate WAN. Some key points from the presentation include: IT and networks have returned to the priority list of CEOs and CIOs globally due to increased use of technology in finance and business; apps have moved from customization for enterprises to customization for users; the cloud can give competitors advantages so enterprises need smart networks and orchestration layers; access will continue through Ethernet and MPLS but new technologies like SD-WAN will be used; and every enterprise will need to build or buy an orchestration
This document provides a summary of recent news and trends in technology and venture capital. It discusses investment levels in various European countries in Q1 2017, with total investment of €4.5B across 856 deals. France saw €0.6B invested, the third highest level after the UK and Germany. Retail challenges from ecommerce are also summarized, with predictions of 3,500 US store closures. The document also covers Facebook's focus on augmented reality at its F8 conference and an EIF report showing most European VC exits are below cost.
According to this year's Global Innovation 1000 study -- an examination of the 1,000 public companies that spend the most on researching and developing products for their markets -- the world's major innovators are shifting more of their R&D to software and services. The shift is being driven by the supercharged pace of improvement in what software can do, the increasing use of embedded software and sensors in products as varied as power turbines and cars, and rising customer expectations. Between 2010 and 2015, the companies in the Global Innovation 1000 study increased their R&D spending on software offerings by 65 percent and their spending on service offerings by 36 percent. As this shift intensifies, companies are facing an array of managerial, organizational, and cultural challenges.
The Internet of Things: The next growth engine for the semiconductor industryPwC
The ongoing explosion of mobile devices---smartphones, tablets, ultramobiles, and wearables---continues to drive growth in the semiconductor industry. But it's the Internet of Things---with sensors in everything from automobiles, to electric meters, to refrigerators---that will drive industry growth over the next five years.
This in-depth report looks at 2015-2019 growth by component, region and application with particular focus on the role of semiconductors in the IoT ecosystem and how companies can capture value from this developing megatrend.
In this study, FABERNOVEL and Ardian Infrastructure combine their expertise to answer a key issue faced by many in the infrastructure world today: in a world that is moving ever forward and finds itself increasingly transformed by the digital, what shapes infrastructure and renders it capable of adapting to and meeting the needs of tomorrow’s economy? How can we boost innovation in infrastructure? And how are we able to add value to infrastructure in tomorrow’s world?
FABERNOVEL and Ardian Infrastructure have developed a scoring model as well as a method aiming to guide future investments in infrastructure, known as “augmented infrastructure”. This method will deliver the tools to help understand key concepts, help succeed in and invest in a whole economy network.
More information here : https://bit.ly/2A4hl41
This document discusses whether Europe can become a global leader in innovation. While Europe has pioneered many technologies, it has struggled to commercialize them, with companies in other regions dominating markets like consumer internet, mobile operating systems, and networking equipment. For Europe to succeed with new digital technologies like AI, it will need to keep talent from moving elsewhere, increase funding throughout the innovation process, overcome market fragmentation, and develop its own strengths in collaboration and industrial sectors rather than mimicking other models. Reasons for optimism include Europe's skilled workforce and potential to leverage data from public services.
The document provides an overview and strategic assessment of the US displays industry in January 2011. It finds that the US industry includes over 130 businesses in the display value chain, with average revenues of $140 million. It identifies several themes for the industry, including that the largest players like 3M and Corning still dominate but face new challenges, and that the US has a strong position in areas like touch technology and microdisplays due to support from the government and military applications. However, the document also notes mixed results for intellectual property and licensing businesses, and questions if more can be done to support equipment manufacturers and novel materials companies in the US.
The document summarizes key findings from BCG's 2018 TMT Value Creators Report. It finds that digital natives and technology giants are creating the most value in the TMT sector, accounting for 37% of total value created. Within industries, technology leads in value creation while media and telecom have dropped in rankings. The document provides a playbook for digital transformation, noting that high-performing companies balance transforming their core with pursuing new growth areas like artificial intelligence, the internet of things, and cybersecurity.
The smac-code-embracing-new-technologies-for-future-business (1)Sumit Roy
Social mobile Analytics and Cloud: How SMAC model is changing and disrupting business across industry. SMAC is not only changing the way markets function , but it also is a pointer that technology today is the biggest tool for innovation,however this is a double edged sword as SMAC is a great enabler. Small companies and the giants both have a level playing field
SMACology i.e. SMAC Technology is the new buzzword reforming the IT industries as well as the skills of technical aspirants. Learn how.
PDF courtesy: KPMG
Three market trends drive collaborative value networks to the next levelARC Advisory Group
Three trends will drive changes in industrial companies over the next decade: 1) the shift in global economic power to emerging markets, 2) increased accessibility and capabilities of information technology, and 3) the rising influence of Millennials in the workforce. These trends will pressure companies to collaborate more extensively with partners throughout their value networks. Advanced IT can enable new forms of collaboration in design, production, and delivery. Leading companies will adapt by increasing information sharing and collaboration with customers and other partners across dynamic value networks.
The document discusses how digital innovation is transforming the innovation strategies and operations of leading companies. Some key points:
- 11 of the top 50 most innovative companies for 2018 according to BCG are digital natives, and most others have incorporated digital technologies into R&D.
- Leading innovators are shifting to make R&D and new product development digital endeavors, requiring changes to innovation strategy, operations, and organization.
- Four types of innovation related to digital - big data analytics, fast adoption of new technologies, mobile products/capabilities, and digital design - have increased most in importance and activity levels in recent years.
- However, an "innovation digital divide" exists, with strong
Financial services institutions recognize that technology will be critical to meeting business goals like efficiency and customer satisfaction, but don't always understand which technologies are relevant or available. A new model from HPE guides FSIs through challenges in deciding where to invest in technology. The HPE FinTech Innovation Model outlines the maturity and adoption levels of technologies like cloud, big data, mobility and security across key areas like customer interaction, operations and payments. It helps FSIs understand where they need to be compared to competitors and assess when technologies are ripe for adoption.
http://www.ericsson.com/thinkingahead/networked_society
Digitalization has unleashed a wave of transformation across a range of industries. The pace of change has been mind boggling and will only continue to accelerate. Everything from business models and product categories to financing and human resources will transform in order to take advantage of the possibilities of the Networked Society.
The document discusses digital business transformation and the disruption of industry logics. It examines the major technological forces driving digital transformation, including hyperconnectivity, the internet of things, commoditized technology, ubiquitous access, converged markets, and the networked society. These forces are disrupting conventional business logic and changing characteristics of digital markets, which are now high-speed, all-embracing yet super-niche, have blurred boundaries, complex business models, and are both hyper-competitive and collaborative. The rise of user-centric ecosystems is shifting industries from ownership models to ones focused on access through streaming, sharing, renting and subscribing. Successful companies must adapt to these changes in how they relate to markets.
iBe A State of Digital Innovation Report 2015Phil Falato
This document discusses drivers of digital innovation based on interviews with executives from various industries. It finds that customer empowerment due to digital technology, ubiquitous digital tools, disruptive new technologies, and new entrants are driving companies to innovate. The report examines how executives are responding to these challenges and proposes that success requires fostering digital advantages, addressing the "smart divide," and adopting new innovation models.
iBe A State of Digital Innovation Report May 2015 issuedRoger Camrass
This document provides an overview of a research report on digital innovation. It discusses:
1) Four key drivers of digital disruption: customer empowerment, digital ubiquity, disruptive technologies, and new players.
2) How game changing technologies like mobility and data analytics present both threats and opportunities for different industries.
3) The emergence of new, disruptive players and differing views among interviewees on the threat they pose.
4) How companies are approaching innovation through a focus on customer behavior, applying technology to new business areas, and defining digital business strategies with emphasis on mobility and data analytics.
A Transformation Roadmap for Media and Entertainment RevitalizationCognizant
By following a five-step plan, media and entertainment companies can optimize human resources, standardize key business processes and revamp aging IT infrastructure to ensure viability over the long term.
Evolving landscape of technology deals: Semiconductor Industry PwC
The document summarizes semiconductor industry M&A trends in 2014-2015. Key factors driving deals include slowing revenue growth from maturing markets and decreasing chip prices. This has increased consolidation as companies seek access to new markets and customers. The summary document also notes that rising development costs and need for hardware-software partnerships have increased complexity and costs for chipmakers.
Unlock your content, FirstSpirit, CMS, e-Spirit AG, Best-of-Breed, Internet, Intranet, Extranet, Management, CIO, CEO, CMO, Digital Marketing, Integration of third part technology, SEO, Analytics, Strategy, Customer Experience
Unlocking the potential_of_the_internet_of_things_executive_summaryOptimediaSpain
The document discusses the potential economic impact of Internet of Things (IoT) applications. It analyzes over 150 IoT use cases across different settings like homes, cities, factories, etc. The key findings are:
1) IoT applications have a total potential economic impact of $3.9-$11.1 trillion per year by 2025, equivalent to 11% of the world's GDP.
2) Interoperability between IoT systems is critical, enabling 40% of potential value on average across settings.
3) Most value will come from business applications rather than consumer applications, estimated to generate nearly 70% of potential value.
4) Developing economies could generate 40% of total
The report analyzes the stock market performance of 126 technology, media, and telecommunications companies from 2005-2009. It finds:
1) The average 5-year annual returns for the sectors were 6.2% for technology, 5.3% for telecom, and 2.5% for media, below the overall market average of 6.6%.
2) Companies from emerging economies dominated the top performers, holding 7 of the top 10 spots in telecom, 5 in media, and 4 in technology.
3) While the sectors as a whole lagged, the top 10 companies in each achieved much higher average annual returns of 23.3% in technology, 26.2% in media
The document summarizes the 2017 Fintech100 report, which lists the top 100 global fintech innovators. It provides details on the selection criteria and breakdown of companies by region, sector, and funding. Key highlights include the continued dominance of Chinese companies, with Ant Financial ranked first. Lending and payments companies make up a large portion of the list. The report also notes the rise of data and analytics companies and the emergence of open banking globally.
The world is being transformed by new technologies, which are redefining customer expectations, enabling businesses to meet these new expectations, and changing
the way people live and work. Digital transformation, as this is commonly called, has immense potential to change consumer lives, create value for business and unlock
broader societal benefits.
The World Economic Forum launched the Digital Transformation Initiative in 2015, in collaboration with Accenture, to serve as the focal point for new opportunities and
themes arising from the latest developments in the digitalization of business and society. It supports the Forum’s broader activity around the theme of the Fourth
Industrial Revolution. Since its inception, the Initiative has analysed the impact of digital transformation across 13 industries and five cross-industry topics, to identify the
key themes that enable the value generated by digitalization to be captured for business and wider society. Drawing on these themes, we have developed a series of
imperatives for business and policy leaders that look to maximize the benefits of digitalization. We have engaged with more than 300 executives (both from leading
global firms and newer technology disruptors), government and policy leaders, and academics.
Every industry has its nuances and contextual differences, but they all share certain inhibitors to change. These include the innovator’s dilemma (the fear of
cannibalizing existing revenue models), low technology adoption rates across organizations, conservative organizational cultures, and regulatory issues. Business and
government leaders should continue to work towards addressing these challenges.
A notable outcome of this work is the development of our distinctive economic framework, which quantifies the impact of digitalization on industry and society. It can be
applied consistently at all levels of business and government to help unlock the estimated $100 trillion of value that digitalization could create over the next decade. We
have already started to leverage this framework for region-specific discussions with some governments.
We are confident that the findings from the Initiative will contribute to improving the state of the world through digital transformation, both for business and wider society.
This document discusses an IMD and Cisco initiative called the Global Center for Digital Business Transformation. The Center conducted a survey of over 900 business leaders from 12 industries to assess the state of digital disruption. Key findings include that digital disruption is occurring faster than ever and displacing incumbent companies, but many companies are not adequately addressing this threat. The document advocates that all industries will experience disruption as innovations become exponential, so companies must assess their vulnerability and either disrupt themselves or risk being displaced by new business models.
This document provides an overview of four potential future scenarios for the TIME (Telecom, IT, Media & Entertainment) industry by 2020, along with the business models that would be suited for each scenario.
The scenarios were developed using a scenario planning methodology that identified likely trends and uncertainties. The four scenarios are: 1) Brands & Pipes, 2) User's Choice, 3) Green Shift, and 4) All-Inclusive. Each scenario describes a different potential future for the industry in terms of user and market perspectives.
Accompanying each scenario are descriptions of sample business models that companies could adopt to be successful in that particular future environment. Common strategies across the scenarios include implementing activity-based costing
Similar to TMT_Value_Creators_Report_Productivity_and_Growth_tcm80-181018 (20)
1. The 2014 TMT Value Creators Report
Productivity and
Growth
winning the Technology Disruption battle
2. The Boston Consulting Group (BCG) is a global management consulting firm and the world’s
leading advisor on business strategy. We partner with clients from the private, public, and not-for-
profit sectors in all regions to identify their highest-value opportunities, address their most critical
challenges, and transform their enterprises. Our customized approach combines deep insight into
the dynamics of companies and markets with close collaboration at all levels of the client
organization. This ensures that our clients achieve sustainable competitive advantage, build more
capable organizations, and secure lasting results. Founded in 1963, BCG is a private company with
81 offices in 45 countries. For more information, please visit bcg.com.
3. December 2014 | The Boston Consulting Group
Productivity and
Growth
winning the Technology Disruption battle
Wolfgang Bock
Philip Evans
Patrick Forth
Fredrik Lind
David Mark
Antonella Mei-Pochtler
Christian Nill
Frank Plaschke
The 2014 TMT Value Creators Report
4. 2 | Productivity and Growth
Contents
3 introduction
4 Lessons From the Past Five Years
7 New Economic Shifts and Fault Lines
10 A Practical Agenda
Understanding Strategic Options
Analyzing Value Creation Scenarios
Aggressively Shifting Capabilities
Focusing on Change Management
14 Technology: A Tale of Two Cities
Using TSR to Shape Strategy
Strengthening the Core
Deciding Where to Play
Increasing Organizational Agility and Capability
22 Media Matters
Developing an Integrated Value-Creation Strategy
Finding Productivity and Growth in the Core
Building New Digital Businesses
28 The Telecom Bounce
Shaping Market Structure and Regulation
Productivity: Radical Changes to the Operating Model
Core Growth
Growth Beyond the Core
36 For Further Reading
37 Note to the Reader
5. The Boston Consulting Group | 3
Disruption surrounds us. There are more mobile devices than
people in the world. By 2020, more than 50 billion connected In-
ternet of Things devices will likely be in service. Smart cities, smart
homes, autonomous vehicles, and cognitive computing are quickly be-
coming realities. New business models built around smart devices,
high-speed networks, cloud computing, and data analytics are rapidly
emerging. Traditional sources of advantage are rupturing, while new
sources of value are forming.
The technology, media, and telecommunications (TMT) sector is at
the vanguard, designing and deploying new technologies and develop-
ing business models across all industries. Unlike start-ups that can sin-
gularly focus on new, disruptive opportunities, however, incumbent
TMT companies must walk a tightrope. Winners must improve pro-
ductivity in their legacy businesses and build growth businesses that
take advantage of disruptions.
Media companies must actively manage the productivity and cash
flows in their traditional businesses while they reinvent themselves
on digital and mobile platforms. Telecom carriers must simplify their
products and operating systems and eliminate legacy networks as
they adopt new technologies and seek fresh growth opportunities.
Software companies must phase out legacy licensing arrangements
and become truly agile while they create cloud, mobile, and anything-
as-a-service (XaaS) business models. And so on.
This report analyzes the past and previews the future through a value
creation lens. We describe how performance among TMT companies
differed widely over the past five years. Companies were not simply
swept up in the tidal movements of the macrotrends. The difference
in value created by winners and laggards shows that leadership and
strategy matter more than ever.
Introduction
6. 4 | Productivity and Growth
Lessons from the Past
Five Years
Value creation is necessarily back-
ward looking—and we look way back.
Rather than reviewing quarterly or even
annual performance, we cover a five-year
period (2009 through 2013) in order to
understand what separates the winners over
the medium term.
The past is not always prologue, but it can
help show the path into the future. Over the
five years analyzed, four (or six, if you reclas-
sify Priceline.com and Amazon.com) of the
top-ten large-cap value creators across all in-
dustries are TMT companies.1
(See Exhibit 1.)
Numbers three and four, Baidu and Tencent
Holdings, tap into China’s phenomenal online
growth—as does Alibaba Group, whose re-
cent IPO shows that this megatrend is not
abating. Number five, Tata Consultancy Ser-
vices, caters to the productivity needs of all
companies, and number nine, Apple, is argu-
ably the most successful company of the post-
PC era. In the eight previous five-year peri-
ods, Apple ranked first three times among
large-cap companies, third four times, and
sixth once.
Exhibit 1 | TMT Companies Dominate the Large-Cap Top Ten
Sources: S&P Capital IQ; Thomson Reuters Datastream; Bloomberg; annual reports; BCG analysis.
Note: OEM = original equipment manufacturer. The sample of large-cap companies consists of 164 companies whose market capitalization was at
least $50 billion on November 13, 2013.
1
Average annual total shareholder return, 2009–2013.
2
As of December 31, 2013.
Company Location Industry
TSR1
(%)
Market value2
($billions)
1 Priceline.com United States Travel and tourism 73.6 59.8
2 Las Vegas Sands United States Travel and tourism 71.4 64.5
3 Baidu China Media 68.6 62.2
4 Tencent Holdings China Media 58.7 117.6
5 Tata Consultancy Services India Technology 58.4 68.8
6 Starbucks United States Retail 54.4 59.1
7 Amazon.com United States Retail 50.7 182.5
8 Ford Motor United States Automotive OEMs 47.8 60.8
9 Apple United States Technology 46.7 500.7
10 Volkswagen (preferred) Germany Automotive OEMs 43.7 130.8
7. The Boston Consulting Group | 5
Of the 26 industries analyzed, the media and
technology industries were among the
strongest in creating total shareholder return
(TSR), while the telecommunications
industry was a relatively poor performer.
(See Exhibit 2.)
A few companies, in particular, stand out
from the crowd. Of the $4.9 trillion in value
created by the almost 200 TMT companies in
our sample, from 2009 through 2013, about
$900 billion, or nearly one-fifth, was generat-
ed by just five companies: Apple and Google,
two massively successful stack and ecosystem
players; and Baidu, Naspers, and Tencent,
companies that surfed the China wave.
The data, however, also shows that variation
within each industry is larger than variation
across industry medians. In other words, com-
panies that play their hands right can deliver
strong TSR in any industry.
Nine technology and telecom companies,
meanwhile, generated negative TSR in one of
the biggest bull markets in history, while
many other companies in the same business-
es thrived. Some other highlights include the
following:
•• The media industry ranked third across
all industries, with median annual TSR
of 29 percent. It was led by broadcasters,
including Sirius XM Holdings and
ProSiebenSat.1 Media, as well as Chinese
Internet companies. Six companies—in-
cluding TV network CBS—delivered
annual returns exceeding 50 percent,
and the same number generated sin-
gle-digit annual returns. Most of the
top-ten media value creators from
mature markets have aggressively
managed their portfolio by both divest-
ing peripheral assets and acquiring scale
in core businesses.
–18
3 –5 –3
–14
–6 –8 1 –5 –4
–21
3
–9 –5 –6
–16 –22
–6
–20
–10
–26
–13
–19
–28
–50
0
50
100
150
200
Average annual TSR, 2009–2013 (%)
High
Low
Median
Chemicals
Mining
Consumer
nondurables
Metals
Media Travel and
tourism
Bio-
pharma
Telecommu-
nications
Fashion
and
luxury
Automotive
OEMs
Technology Construction
Automotive
components
Consumer
durables
Medical
technology
Transport
and
logistics
Machinery Oil
Health
care
services
Multi-
business
Building
materials
Power and
gas utilities
Forest
products
Banks Insurance
Retail
91 96 97
65 64
138
62
75
166
72
58
101
69
131
64
73
43 44
86
75
31
49 54 57
50
109
35 33 29 29 26 26 26 25 24 22 21 21 21 20 20 19 19 15 15 15 14 14 12 11 10 911
2
Sources: Standard and Poor’s Capital IQ; company disclosures; BCG analysis.
Note: Cable operators have been moved from the media to the telecommunications industry for this report.
Exhibit 2 | Media and Technology Outperform Telecommunications
8. 6 | Productivity and Growth
•• The technology industry—which ranked
ninth, with a median TSR of 24 percent—
is powered by a diverse group of small-cap
companies, each of which has a relatively
narrow focus. The number six technology
company, Tata Consultancy Services, is the
only large-cap company in the top ten.
Two large-cap technology companies
generated negative TSR.
•• The telecom industry ranked eighteenth,
with a 15 percent median annual TSR—
better than its twenty-fifth-place perfor-
mance in the five-year period ended in
2012.2
Many telecom stocks have become
yield driven, with dividends behind their
performance. Even so, seven operators
generated negative TSR.
The double-digit returns of all three industries
need to be viewed in light of the starting line.
In 2009—the start of the five years under
analysis—global equity markets had just
bounced off the biggest decline in stock prices
since the Great Depression. (See The 2014 Value
Creators Report: Turnaround—Transforming
Value Creation, BCG report, July 2014.) Over the
next five years, TMT companies will not have
the luxury of generating TSR from a low base.
They need to find ways to create returns
without the uplift from those expanding price-
earnings multiples that occurred for many
companies over the past five years.
Most companies cannot realistically aspire to
become Apple or Tencent. But they all should
strive to reach the top quarter of their indus-
try in generating TSR. As Exhibit 3 shows,
top-quartile companies managed to create
three to seven times the TSR of bottom-quar-
tile companies.
A $1 investment in a top-quartile technology
company over this report’s five-year horizon
would have delivered at least a $4.74 return,
compared with $1.97 for the strongest compa-
ny in the lowest quartile. For media compa-
nies, the comparable range is from $5.53 to
$2.34. For telecommunications companies, it’s
$2.95 to $1.29.
In other words, TMT companies can control
their own destiny by actively managing their
businesses for value creation amid technolo-
gy disruption.
Notes
1. Large-cap companies’ market value exceeds $50
billion.
2. Cable operators, which had media companies in prior
reports, are listed as telecom stocks this year.
Technology Media Telecommunications
TSR index TSR index TSR index
Top quartile Median of total sample Bottom quartile x Difference in value creation
295
237
185
166
137
194
169
129118118121
112100
0
100
200
300
2012
2011
2010
2009
2008
2008 = 100
2013
520
317
232236
177
316
198
234
151135144127100
0
200
400
600
2008 = 100
2013
2012
2011
2010
2009
2008
483
342
265290
214
100
294
209
197
145131157143
0
200
400
600
2008 = 100
2013
2012
2011
2010
2009
2008
x4 x3 x7
Sources: Standard & Poor’s Capital IQ; Thomson Reuters Datastream and Worldscope; Bloomberg; annual reports; BCG analysis.
Note: The index was set to 100 on January 2, 2013. Values for top- and bottom-quartile performance represent the corresponding upper and lower
thresholds.
Exhibit 3 | The Difference in Performance Between Top- and Bottom-Quartile Companies Is
Dramatic
9. The Boston Consulting Group | 7
Technology disruption is an irrepress-
ible force in the economy. A vast and
growing digital ecosystem (smart devices,
pervasive connectivity with high-speed
bandwidth, and cloud and data infrastruc-
ture) is the primary force behind disruption.
This ecosystem is driving two fundamental
shifts in economic and business activity.
Faster Clock Speeds. The iTunes Store
opened in April 2003. The online outlet, then
called the iTunes Music Store, was the
missing piece that allowed Apple to create an
ecosystem of devices, applications, data,
products, and services working together in
fundamentally new ways. It took the iTunes
Store nearly three years to sell 1 billion songs.
By early 2013, when Apple stopped releasing
specific song-download information, the store
was handling that volume in a month.
In the middle of the first decade of the
twenty-first century, Facebook reached 50
million users in 42 months. A few years later,
it took WhatsApp only 12 months, and the
Space edition of the Angry Birds game was
installed on 50 million devices in one month.
(See Exhibit 4.)
Innovation, especially in business models, is
also accelerating, as Netflix has demonstrat-
ed in the media industry. Imagine the disrup-
tion to retailing if, in the next few years, Am-
azon.com were able to supply one-half of
everything its consumers needed and deliver
orders within four hours of consumers hav-
ing made their purchases.
A vast and growing digital
ecosystem is the primary
force behind technology
disruption.
The payments system is another area awash in
innovation. Square, a onetime tech darling, dis-
rupted the field a few years ago with a simple
card reader for mobile devices. But Square it-
self is now facing competition from large eco-
system players such as Apple and Google.
Enablement of Other Technologies. The
digital ecosystem also serves as a platform to
accelerate adoption and enhance the func-
tionality of other technologies. Genomic
medicine, self-driving cars, cognitive comput-
ing, and 3-D printing, for example, would be
far less disruptive as stand-alone technologies.
But the impact becomes exponential when
these technologies combine with the reach
and data analytics power of this digital ecosys-
tem. Take 3-D printing. The digital ecosystem
allows a new spare part for an airplane to be
printed remotely where it is needed. The
ecosystem accelerates innovation by allowing
New Economic Shifts
and Fault Lines
10. 8 | Productivity and Growth
users to access open-source design files and
facilitates ease of use through interoperable
software rather than proprietary CAD systems.
The latest disruptions involve
hyperscaling—scale achieved
beyond the boundaries of
traditional companies.
Technology is also reshaping entire indus-
tries—especially the TMT sector—along fun-
damentally new fault lines. The structure of
many industries is fracturing into interopera-
ble layers of similar activities that collectively
form a stack. The defining characteristic of
the latest phase of disruption is “hyperscal-
ing,” or scale achieved beyond the boundar-
ies of traditional companies and organiza-
tions. Big becomes selectively beautiful.
At the bottom of the stack, commodity and
infrastructure providers have always benefit-
ed from scale. Virtually all layers of network
infrastructure require scale to be efficient.
The business of Crown Castle International,
the number six telecommunications value
creator, for example, is built around scale.
The company acquires cellular towers and
rents space on them to operators.
Now data centers—and even the data itself—
are hyperscaling beyond company boundaries.
Amazon Web Services reportedly has five
times the capacity of its next 14 competitors.
Many companies are starting to combine their
data with other companies in order to create
more value through better inferences. Pharma-
ceutical companies, for example, have contem-
plated sharing basic, nonproprietary research.
Through the creation of a common set of data
standards, tools, and processes, these compa-
nies could increase their ability to work with
outside researchers and partners, saving on
the cost of discovery and drawing better infer-
ences from larger data sets.
At the top of the stack, innovation remains
widely distributed. But the underlying plat-
forms that allow communities of users—such
as Linux coders and Wikipedia authors—to
become creators are sensitive to scale. Face-
book and Salesforce.com are exemplars of
B2C and B2B platforms, respectively. Inte-
grated companies are far from dead, however,
0
1
2
3
4
Time it has taken to reach
50 million users (years)
Angry Birds
Space
Draw
Something
Google+WhatsAppFacebookInternet Twitter
1989 2004 2006 2009 2011 2012 2012Launch year
Sources: United Nations; comScore; Paul Allen; Zynga; Rovi; news reports; BCG analysis.
Note: Data represents users for the Internet; active accounts for Facebook, Twitter, and Google+; estimated active users for WhatsApp; and
installations for Draw Something and Angry Birds Space.
Exhibit 4 | Acceleration: A Defining Characteristic of Disruption
11. The Boston Consulting Group | 9
as proven by successful vertically integrated
“stack builders,” such as Apple and Microsoft.
Finally, a large number of point solution pro-
viders complete the stack, supplying services
and products for both open and proprietary
ecosystems. The focus of these providers is
generally narrow—aimed at specific areas of
the market. Examples include Adobe in soft-
ware, Xerox in services, and Seagate Technol-
ogy in hardware. (See Exhibit 5.)
The broader message is that the legacy posi-
tion of many companies within an industry is
in flux. Start-ups and new entrants with dif-
ferent economics, motivations, and time hori-
zons may be able to attack profit pools that
were once protected.
Devices
Platforms
Applications
Data center
infrastructure
Data
Networks
Scale
Hyperscale
Scale
Small is
beautiful
Platforms for
communities and
services, and data pools
across verticals
Content and
communities
TMT stack layers Strategic options and keys to success
• Comprehensive
integration
• End-to-end
solutions
• Best-of-breed
offering
• Focused portfolio
• Strong partnerships
• Possession of an
essential piece of
the stack
• High operational
efficiency
• Strong R&D
• Flexible production
Commodity and
infrastructure
providers
Stack
orchestrators
and platforms
Stack builders
Print solution
providers
Data centers,
commodity hardware,
and communication
networks
Source: BCG analysis.
Note: Small is beautiful, Scale, and Hyperscale describe key value drivers within a layer.
Exhibit 5 | Four Distinct Strategic Responses to the Industry Stacking
12. 10 | Productivity and Growth
A Practical Agenda
TMT companies need a comprehensive
response to the competitive threats and
opportunities driven by technology disruption
and shifts in industry architecture. They also
need to be even bolder and to act faster than
in the past.
Understanding Strategic Options
During the global financial meltdown six
years ago, many companies adopted the
stance that a crisis is a terrible thing to waste.
In an era with constant technological disrup-
tion, leaders need to adopt that same stance.
They should seek to understand the vulnera-
bilities and opportunities presented by their
evolving industries.
Threats abound. Traditional media compa-
nies are losing ground to players that use
data and analytics to more effectively target
advertising. Regulation may prevent tele-
com operators from acquiring scale to com-
pete at the bottom of the stack, and the mi-
gration of customers to over-the-top (OTT)
players is gaining speed. The hardware sides
of technology companies are becoming com-
modity businesses. On the software side,
fast-moving cloud companies are capturing
market share and driving down margins.
Opportunities also abound: media compa-
nies can embrace OTT delivery, telecom op-
erators can leverage data and strong custom-
er relationships and enter cloud and data
analytics businesses, and technology compa-
nies can orchestrate ecosystems in areas such
as smart energy, home automation, and
smart cities.
Evidence abounds that companies are re-
thinking strategies and portfolios. Several
companies, such as Hewlett-Packard, Syman-
tec, eBay, Gannett, and Fox Broadcasting, are
breaking up in order to sharpen their focus
and realize the underlying value that diversi-
fication had masked. IBM, Microsoft, and oth-
er technology companies are making big bets
on cloud computing. Media companies are ex-
perimenting with new product configurations
that appeal to consumers unaccustomed to
paying for content. Within telecommunica-
tions, consolidation, especially in Europe, is
picking up pace
Analyzing Value Creation
Scenarios
The reality is stark. Without making a series
of productivity and growth moves within
their core businesses and bold and disrup-
tive strategic bets beyond the core, incum-
bent TMT companies will struggle to gener-
ate top-quartile shareholder returns in the
future.
Established companies must have a strong,
clear productivity agenda that can generate
13. The Boston Consulting Group | 11
TSR and fund the journey of longer-term
portfolio transformation. Companies should
carefully choose the scope, level of aggres-
sion, and execution risk of productivity initia-
tives, such as better use of data and analytics,
digitization of channels, agile software and
product development, and simplification of
product portfolios, operating models, and de-
cision rights.
At the same time, companies should be
looking for opportunities to extract more
growth from the core businesses. Mobile
and video platforms, fixed-mobile conver-
gence offers, pricing-improvement programs,
and low-cost devices are all promising ave-
nues to pursue.
These measures are certainly necessary but
may be insufficient for top-quartile perfor-
mance over the next five years. TMT compa-
nies must also think about capturing growth
from new markets, such as health care and
education verticals, as well as the Internet of
Things. Such initiatives may involve acquisi-
tions and the creation of new businesses,
which will certainly entail risk—but the
greater risk is inertia.
TMT companies should care-
fully choose the scope, level
of aggression, and execution
risk of productivity initiatives.
Growth, either from the core or new business-
es, is the single most important source of val-
ue for successful companies. Over the past ten
years, sales growth contributed 9 to 17 per-
centage points of shareholder return to the
top-quartile of the three TMT industries, the
single largest contributor. (See Exhibit 6.) (Al-
though the focus of this report is a five-year
analysis, a ten-year view helps to smooth out
the surge in earnings multiples that occurred
in the bounce back from the global financial
crisis.)
Median contribution to TSR for top-quartile companies Median contribution to TSR across entire sample
EBITDA
multiple
EBITDA
marginSales growth Cash flow
Multiple changeProfit growth Cash flow contribution
Telecommunications
Media
Technology
(%)
4
(%)
1
(%)
–1
(%)
1
(%)
0
(%)
3
(%)
17
(%)
9
(%)
14
(%)
3
(%)
2
(%)
2
Sources: S&P Capital IQ; BCG analysis.
Note: Disaggregation is multiplicative but converted and shown here as additive, with remainders assigned to the margin and multiple change
fields.
Exhibit 6 | Sales Growth Is the Primary Source of TSR over a Ten-Year Period
14. 12 | Productivity and Growth
Growth, of course, is not the only way to
generate value. Many companies have
strong cash flow that can be applied to
share buybacks or dividends. Historically, as
Exhibit 6 shows, telecommunications and
media companies have been more likely
than technology companies to pay out divi-
dends. But as business in the core portfolio
slows, even technology companies should
consider returning cash to their sharehold-
ers—in addition to, not instead of, seeking
growth.
If companies start to rely on dividends and
buybacks for value creation, however, they
need to manage the expectations of their cur-
rent investor base. Through better investor
communications and recruitment of new
types of investors, TMT companies can ac-
tively address discounts embedded in their
stock price. (See Exhibit 7.)
Shareholders, especially in the technology in-
dustry, are playing an increasingly activist
role in encouraging portfolio transforma-
tions, changes in leadership, and the return
of cash. Companies need to assess their fu-
ture in the way that their shareholders evalu-
ate them—and the TSR lens enables them to
do just that.
Aggressively Shifting Capabilities
Successful execution of these strategies will
require new skills in business model innova-
tion, software, data and analytics, mobile, and
digital. The strongest value creators actively
manage the development and acquisition of
these skills. They conduct strategic workforce
analyses to determine the skills they need. In
resource-scarce domains such as data science,
software development in specific languages,
and user experience design, they develop fo-
cused recruitment and skills-development
strategies. In areas of surplus, they either re-
train people or conduct fast and fair out-
placement.
Agile corporate-development and adap-
tive-strategy skills will also play elevated
roles as companies resize and reshape their
organizations. In recent years, many TMT
companies have understandably focused on
running lean businesses. Disruption will
force them to ask whether they are in the
right businesses.
Business strategy
Growth, margins, portfolio,
targets, and risk
Optimal TSR
Investor strategy Financial strategy
• What is the balance between
dividends and buybacks?
• What are the right dividend
payout ratio and yield?
• What is the right amount of
debt to optimize TSR and
the P/E ratio?
• What investor type should be
targeted?
• What are investors’ current
expectations?
• What are the drivers of relative
valuation multiples?
• What is the right messaging?
• What is the right portfolio shape
and how might acquisitions and
divestitures affect TSR?
• What are the most important
measures to focus on?
• What is the right risk tolerance?
• Messaging
• Transparency
• Investor type
• Sources and uses of
cash and capital
• Dividends and
buybacks
• What is the company’s TSR
aspiration? Is it sustainably
above average or top quartile?
Source: BCG analysis.
Exhibit 7 | Optimizing TSR Requires an Integrated Approach to Strategy
15. The Boston Consulting Group | 13
At the strongest TMT companies, HR is play-
ing a sophisticated activist role. These compa-
nies apply state-of-the-art analytics and evi-
dence-based approaches to maximize the
value of their people. It’s no wonder that
about one-third of Google HR staff have ad-
vanced degrees in various analytic fields—
PhDs and master’s degrees in operations,
physics, statistics, and psychology.
The skills mix is where the rubber hits the
road. An exciting new strategy—from prod-
ucts to services, for example, or building
ecosystems in specific industry verticals—
that promises strong value creation is just a
good idea if the company does not have the
right people and capabilities to deliver.
Why, for example, do most technology and
telecommunications companies have a
smaller share of online sales than airlines or
banks? In many cases, it is because the tal-
ent and organizational center of gravity still
rests in physical channels. The sooner that
changes, the better.
Focusing on Change Management
Change management capabilities are what
allow companies to tie together their strate-
gic, value-creation, and people agendas into
an overall program that will be effective,
low risk, scalable, and, above all, accelerat-
ed. Change is always difficult, but it is espe-
cially so given the uncertainty and rapid
clock speed associated with technology dis-
ruption. Many of today’s leaders are not dig-
ital natives. They may lack experience with
new technologies and business models and
may be risk averse, relying on what is famil-
iar to them.
One of the best ways to break old patterns is
for CEOs to appoint members of the senior
leadership team who have knowledge of dis-
ruptive technologies—and then give those
executives meaningful authority. It’s not
good enough to have a chief digital officer
who has little influence over important busi-
ness and strategic decisions.
In addition, organizations tend to reward the
delivery of today’s results rather than the
building of capabilities that promise better
results tomorrow. Organizational inertia can
smother new initiatives. The strongest lead-
ers are able to get their teams and their orga-
nizations to focus on both time horizons si-
multaneously.
The specific challenges operating for today
and for tomorrow—for productivity and for
growth—differ across the TMT industries. In
the remaining chapters, we examine each sec-
tor at a more detailed level.
16. 14 | Productivity and Growth
Technology
A Tale of Two Cities
The current wave of disruption is
dividing the technology industry in
two—literally in the case of some companies.
On one side, stack builders and orchestrators
have created profitable ecosystems and are
expanding into growth markets such as smart
homes, cities, and energy; wearables; and the
Internet of Things.
On the other side, large segments of the in-
dustry are undergoing commoditization. This
trend is especially evident at the bottom of
the stack and is largely driven by modulariza-
tion, standardization, and a need to reach the
masses. Cloud companies, for example, are
using their purchasing power to push down
the price of servers, storage, and network
equipment. As a result, revenue growth for
hardware is flat or declining, despite the solid
growth in public and private cloud services,
which rely on those components. (See Exhibit
8.) Commoditization is also gaining grip high-
er in the stack, where open-source standards
allow new entrants to put downward pressure
on prices.
Several companies within a third group—the
point solution players—are benefiting from
this bifurcation by providing focused prod-
ucts and services to both the stack builders
and the commodity companies.
Companies from either side of the divide—
and those that supply solutions to both—can
earn superior returns. A stack builder such as
Apple narrowly missed the top-ten list of
technology value creators this year but made
it the past four years on the strength of creat-
ing what is possibly the most successful eco-
system of mobile and digital services. Sales-
force.com, an ecosystem orchestrator, also
narrowly missed the cut but made the top ten
in the past three reports.
Companies operating in the commodi-
ty-heavy layers of the stack can do well if
they have strong sales, low costs, innovative
technologies, and strategies aligned with ma-
turing markets. Six data-storage and semi-
conductor companies are in the top ten, led
by number two, Seagate Technology. (See
Exhibit 9.) ARM, which sells semiconductor
designs for mobile devices, has a long histo-
ry of success in creating TSR as a point solu-
tion provider for the commoditizing layers
of the stack. It is the number-three technolo-
gy value creator in this year’s report.
Technology has consistently finished in the
top half of industries in TSR performance,
so its overall showing in this year’s report is
unsurprising. But one of the big lessons in
this year’s rankings is that diversity general-
ly does not pay. Companies that focus on
only a few opportunities outperform those
that spread their bets around. (See Exhibit
10.) In fact, only 3 of the 13 large-cap tech-
nology companies, which are more diverse,
17. The Boston Consulting Group | 15
Expected
20162014
20
10
0
–10
20182012
Servers
PCs
Storage
Enterprise networking
20142012 20182016
20
10
0
–10
Cloud computing Enterprise soware
Revenue growth for commodity hardware (%) Revenue growth for soware and cloud computing (%)
Expected
Sources: Gartner; IDC; BCG analysis.
Note: PCs include laptops and desktops; storage refers to external controller-based storage; cloud computing refers to public cloud services only.
Exhibit 8 | Growth Rates for Commodity Hardware Are Flat or Declining
Exhibit 9 | Small-Cap Companies Dominate the Top Ten Technology Companies
TSR disaggregation1
Company Location Segment
TSR2
(%)
Market
value3
($billions)
Sales
growth
(%)
Margin
change
(%)
Multiple
change4
(%)
Dividend
yield
(%)
Share
change
(%)
Net
debt
change
(%)
2014
TSR5
(%)
1 GoerTek China
Consumer
devices
74.7 8.8 58 –3 23 1 –3 –1 –21
2 Seagate Technology United States
Data storage
products
70.3 18.3 7 23 20 4 9 8 17
3 ARM United Kingdom Semiconductors 67.8 25.5 19 10 40 2 –2 –1 –19
4 HCL Technologies India
Software and IT
services
64.4 16.2 26 5 27 3 –1 4 27
5 Infineon Germany Semiconductors 59.2 11.5 –2 6 32 7 –7 23 2
6 Tata Consultancy Services India
Software and IT
services
58.4 68.8 24 4 29 3 0 –1 23
7 Catamaran United States
Software and IT
services
54.7 9.8 70 –1 1 0 –14 –2 0
8 Micron Technology United States Semiconductors 52.5 23.0 14 15 8 0 –6 23 54
9 Western Digital United States
Data storage
products
49.8 19.8 15 9 37 1 –1 –11 22
10 SanDisk United States
Data storage
products
49.2 15.9 n/a6
36
Top ten 58.8 217.6 19 6 27 2 –2 –1 19
Sources: Standard & Poor’s Capital IQ; Thomson Reuters Datastream; Bloomberg; annual reports; BCG analysis.
Note: Sample is 80 companies, each of whose market valuation is greater than $9 billion.
1
Contribution of each factor is shown in percentage points of the five-year average annual TSR; any differences in TSR totals are due to rounding.
Each top-ten number is the median for its factor, not a sum.
2
Average annual total shareholder return, 2009–2013. The top ten is the median.
3
As of December 31, 2013. The top ten represent aggregate market value.
4
Change in the EBITDA multiple.
5
As of November 3, 2014.
6
TSR disaggregation is not available owing to negative EBITDA in the starting or ending year.
18. 16 | Productivity and Growth
finished in the top half of value creation.
(See Exhibit 11.)
How can technology companies, even those
that have done well over the past five years,
further improve their performance? First,
TSR creation is an often-overlooked but pow-
erful lens into business planning, and it can
be used to evaluate specific initiatives, prod-
uct launches, and M&A activity. Second, a
company needs to strengthen its core through
productivity and growth measures. Third, it
needs to understand whether it is a stack
builder, an orchestrator, a commodity player,
or a point solution provider and pursue adja-
cent growth based on its starting position. Fi-
nally, it will need to dramatically reshape its
capabilities to become more agile.
Using TSR to Shape Strategy
More than ever, increasing TSR requires com-
panies to align their business, financial, and
investor strategies. They need to make sophis-
ticated trade-offs regarding how much to in-
vest in future rather than current perfor-
mance, how much capital to devote to
particular businesses, how much value to re-
turn to shareholders, and how to appeal to
their target investor groups.
The proposed breakups of Hewlett-Packard
and Symantec, as well as eBay’s spinoff of
PayPal, are examples of strategies designed to
increase organizational focus and TSR. It is
not surprising that these are the same goals
of activist investors, who have increasingly
been targeting the technology sector.
Even if they are not the targets of investor ac-
tivism, all technology companies should take
the opportunity to make fundamental choices
about strategy. Many have historically focused
on the P&L statement more than they have on
the balance sheet. Value creation is a great
way to help them understand whether their
portfolio of businesses and capital allocations
to those businesses make sense. It can also
help companies analyze whether their best
use of a portion of their free cash flow may be
to reward shareholders with dividends and
stock buybacks. This is not a typical move for
technology companies. (See the sidebar “Cre-
ating Value the Seagate Way.”)
80
60
40
20
3050
–20
100 75
0
TSR, 2009–2013 (%)
Share of revenues from the largest segment (%)
2013 revenues ($billions)
Low diversity High diversity
20–691–19 70+
Smaller companies perform
better when focused
Sources: BCG ValueScience Center; BCG analysis.
Note: Based on a representative sample of technology companies with more than $1 billion in 2013 revenues.
Exhibit 10 | In the Technology Industry, Diversity Generally Does Not Pay
19. The Boston Consulting Group | 17
Divestiture is not the answer for all compa-
nies. Amazon.com, for example, runs its sep-
arate retailing, cloud, and logistics businesses
almost independently as loosely joined and
interoperable platforms. But if companies re-
main diverse, they need to organize in new
ways to create agility and responsiveness and
to avoid excessive coordination costs. In
nearly all cases, they will need to be bolder
and more aggressive than they have been in
the past. Playing it safe or aiming for incre-
mental change may well be the riskiest op-
tion of all.
Strengthening the Core
Strengthening the core requires introspection.
Companies, particularly those operating fur-
ther down in the commodity-heavy layers of
the stack, have to closely scrutinize their
costs—and not just through short-term mea-
sures such as squeezing suppliers, closing fa-
cilities, and reducing head count.
For many companies, those kinds of actions
will yield incremental improvements that en-
able them only to chase a downward spiral of
prices and margins. Their market position
will become weak, and they will be unable to
fund investments in innovation. Instead, they
need bold actions to unlock dramatic im-
provements in productivity.
Companies need to look at their organiza-
tions and find ways to simplify them dramat-
ically. This can mean removing unnecessary
and often excessive levels of management
that add cost and complexity and that slow
down decision making. They also need to de-
velop and implement new ways of working
that take out cost and improve productivity,
such as leveraging enterprise and market
data and technology.
Perhaps the highest hurdle in strengthening
the core is the willingness to take on this
challenge at scale and speed. Leaders must
be willing to embrace change and stick with
it and empower line managers and teams
with the tools, structure, and support needed
to succeed.
Strengthening the core is about growth as
well as productivity. Even if their core mar-
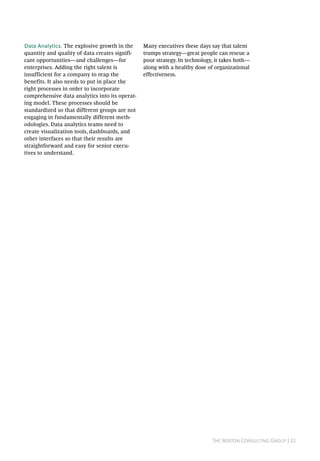
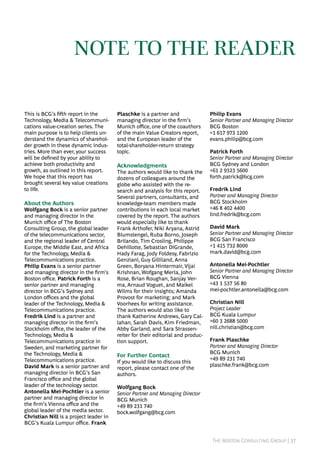
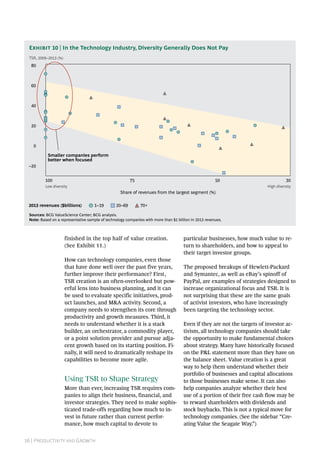
Large-cap
companies
Small-cap
companies
Top half
Bottom half
3 companies
(23%)
10 companies
(77%)
37 companies
(55%)
30 companies
(45%)
Top half
Bottom half
Companies in the top and
bottom halves of TSR ranking
Combined value
creation ($billions)
844 companies
(57%)
634 companies
(43%)
239 companies
(29%)
590 companies
(71%)
Sources: BCG ValueScience Center; BCG analysis.
Note: Value is calculated as (market capitalization on 12/31/08) x [(1 + TSR (from 12/31/2008 through 12/31/2013))^5–1]. Large-cap companies’
market capitalization exceeds $50 billion.
Exhibit 11 | Only 3 of 13 Large-Cap Technology Companies Finished in the Top Half for All TMT
Companies
20. 18 | Productivity and Growth
kets are mature, technology companies have
several opportunities to increase revenues
through smart and diligent execution of go-
to-market strategies and the adoption of ad-
vanced technologies:
•• Pricing. Pricing is often an underused
value-creation tool. Pricing at technology
companies today is about picking the right
model and executing with rigor. As XaaS
pricing becomes more common, compa-
nies must decide how to integrate this
approach into their go-to-market model.
This is not an easy transition since
short-term cash flow is often lower when
solutions are priced as services rather
than licensed or sold.
Pricing is also about effectiveness. If
companies understand the distinct value
that different segments of end users
derive from their services—in other
words, what makes those services sticky—
they can price more effectively. However,
companies often discount indiscriminately
to win or retain customers since the cost
of serving a customer is next to nothing.
By pricing more effectively, companies can
generate revenue gains of 2 to 8 percent
within 18 months.
•• Sales Strategy and Effectiveness. Another way
for technology companies to generate an
immediate and sustainable revenue boost
is to focus on getting more from the current
customer base, from product and service
offerings, and from the sales organization.
These assets often have significant un-
tapped profit potential.
•• Small and Medium-Size Enterprises (SMEs).
Large technology companies have not
always actively pursued the SME market,
even though the payback for these
Even companies that are unlikely to grow
swiftly can generate strong TSR
performance. Seagate Technology’s
consistent focus on TSR helped the
company navigate an extremely turbulent
business environment.
Founded in 1979 by five technology
entrepreneurs and executives who had
played a key role in the early development
of hard-disk drives, Seagate is a first-gener-
ation Silicon Valley company. By 2007, it
was facing several challenges. The sector
was consolidating, with fewer players and
fewer and bigger customers. Innovation
was slowing, and product cycles were
getting longer. Meanwhile, new disruptive
technologies, such as solid-state drives,
were entering the storage space. Seagate
was trading at a low multiple of roughly
two to four times earnings. Both margins
and market share were declining, and the
company’s estimates for future profits were
moving into the red. Executives were
convinced that new business trends, such
as cloud computing, would continue to
drive further growth in the disk drive
market. But it would require major new
investments in core technology to improve
the company’s competitive position. By
2008, those investments were well under
way but were having little positive impact
on the company’s stock price.
The global financial crisis of 2008 forced the
company to cut costs, shore up its balance
sheet, and eliminate dividends. Seagate
also restored its original functional struc-
ture in order to refocus on execution and
innovation in the core business. Seagate’s
gross margins grew nearly fourfold, from a
low point of 7.5 percent in April 2009 to 27
percent by the end of the year, greatly
improving its cash flow. But Seagate’s stock,
which rebounded in 2009, gave up a large
part of those gains the following year.
Senior leaders began to realize that they
could improve the company’s valuation by
changing the conversation. The maturation
of the industry made the stock unappeal-
ing to traditional growth investors. But
Seagate’s strong cash flow would be
appealing to another group of investors—
Creating Value the Seagate Way
21. The Boston Consulting Group | 19
companies on technology investments can
be substantial. In 2013, we surveyed more
than 4,000 SMEs in five countries—the
U.S., Germany, China, India, and Brazil.
The leaders in technology adoption from
2010 through 2012, across all industry
sectors, created jobs almost twice as fast
as other small businesses. Technology
leaders also increased their annual
revenues 15 percentage points faster than
did companies with lower levels of
technology adoption.
•• Business Model Innovation. Business model
innovation is especially valuable in times
of instability. It can provide companies
with a way to break out of intense
competition, under which product or
process innovations are easily imitated,
competitors’ strategies have converged,
and sustained advantage is elusive. It can
help address disruptions—such as
regulatory or technological shifts—that
demand fundamentally new competitive
approaches.
Business model innovation can also help
address specific opportunities, enabling
companies to lower prices, for example, or
to reduce the risks and costs of ownership
for customers. In our experience, many of
the companies that flourish during
disruptions have reinvented themselves
rather than simply deploying defensive
financial and operational tactics. They
often find it easier to gain consensus
about the bold moves required to recon-
figure an existing business.
•• Deep Consumer Insight. As product bets
become bigger and risks loom larger in
volatile markets, a deep understanding of
customer needs and engagement becomes
increasingly valuable. New techniques and
so-called growth-at-a-reasonable-price, or
GARP, investors. The challenge was to
attract greater numbers of these investors
to the company’s stock.
In early April 2011, Seagate announced
that it would pay an annual dividend of
86 cents per share, creating an initial
dividend yield of 5.4 percent. In the first
two weeks after the dividend announce-
ment, Seagate’s stock price increased by
nearly 25 percent. The combination of the
dividend announcement and the new
focus on GARP investors began to pay off.
Capital Research and Management, the
largest family of GARP funds in the U.S.,
with more than $1 trillion in assets under
management, started buying Seagate and
became an important investor. Since then,
the company has continued to increase
its dividend. In 2014, it will pay out $1.72
per share, double the dividend it paid in
2011. At the same time, Seagate has
completed several large and moder-
ate-size acquisitions and has continued to
invest heavily in core technologies. By the
end of 2013, these combined moves had
helped increase Seagate’s price-to-earn-
ings multiple to 11.
The TSR lens has also led the company’s
senior executives to reinvent their mind-set
about the business and how best to drive
value. “We were forced to take a TSR
perspective,” says Patrick O’Malley, Sea-
gate’s CFO. “In 2009, our balance sheet was
the albatross around our neck. Now, it’s a
phoenix. We are focused on how we can use
this balance sheet to do what we need to do.
Today, we look at everything on that balance
sheet as a potential source of TSR. We are
determined to be good stewards of capital.”
In 2011, Seagate acquired Samsung
Group’s hard-drive business for about
$1.4 billion. M&A is also an important
vehicle for entering new areas of future
growth in adjacent businesses. “But we
don’t just let the desire for revenue growth
drive it,” says O’Malley. “Every acquisition
has got to deliver TSR. We have turned
away from some seemingly high-flying
opportunities because of that.”
22. 20 | Productivity and Growth
expertise are required to integrate and
draw insights from the unprecedented
amount of customer data available. This is
where data analytics—an umbrella term
for technologies such as recommendation
engines and machine learning along with
the near-limitless computing power of the
cloud—can help companies retain existing
customers, target new ones, and identify
new opportunities. Consumer insight is an
important input at every stage of the
value chain—whether it is in reponse to
better inventory management in the
supply chain, matching of product fea-
tures to customer needs during R&D,
effective targeting of marketing messages,
or alignment of pricing with customer
willingness to pay.
Deciding Where to Play
Before deciding where to pursue adjacent
growth, technology companies must decide
on what side of the industry divide they fall.
Adjacent growth for a commodity player
looks very different from what an ecosystem
orchestrator sees. For commodity players, for
example, M&A should aim for scale and con-
solidation. For an orchestrator, it should fill
gaps in the ecosystem.
This analysis is critical. Commodity players
can find adjacent growth but not in the same
way that an orchestrator or a point solution
player can. Although the temptation to try to
become an orchestrator may be strong, many
technology companies are better off focusing
their ambitions on competencies and adja-
cencies closer to their core.
Increasing Organizational Agility
and Capability
None of the initiatives outlined above will
bear fruit without adequate changes in the
organization to support them.
Organization Setup. In a time of increasing
clock speeds and accelerating innovation,
companies must transform how they work.
Many traditional software companies still
produce software through the “waterfall”
method. Separate groups are responsible for
conceiving, designing, building, testing,
operationalizing, and maintaining software.
Participants can spend more time in meet-
ings and managing handoffs across organiza-
tional boundaries than on writing and
testing code.
Consumer insight is an
important input at every
stage of the value chain.
Leading-edge companies do away with the
waterfall. They create flat organizations in
which development and testing both report
to the same manager. Individual contribu-
tors have a better sense of how their deci-
sions affect the overall development and re-
lease of software, so there are fewer
slowdowns and do-overs. The advantages of
this way of working are faster time to mar-
ket and stronger customer involvement in
product design.
Talent. Technology companies that aim to
grow, both inside and outside their core, also
need new talent. For example, Google paid
more than $500 million to buy DeepMind, a
London-based company that specializes in
algorithm-based “deep learning.” Industry
experts have hypothesized that the main
purpose was to add talent.
Smart companies have strategies, programs,
and measures designed to recruit, develop,
and retain their top employees and keep
them motivated at the same time—not an
easy task. This is especially critical for compa-
nies making large and frequent acquisitions.
The saying that a company’s most important
assets ride the elevator is especially true for
technology companies.
Companies need a strong HR brand in order
to hire people for areas with severe skills
shortages such as data security and analyt-
ics. At the same time, they will need to hire
and retain employees who can make incre-
mental improvements to mature prod-
ucts—a very different skill set from that re-
quired to ignite proprietary innovation in
high-growth areas.
23. The Boston Consulting Group | 21
Data Analytics. The explosive growth in the
quantity and quality of data creates signifi-
cant opportunities—and challenges—for
enterprises. Adding the right talent is
insufficient for a company to reap the
benefits. It also needs to put in place the
right processes in order to incorporate
comprehensive data analytics into its operat-
ing model. These processes should be
standardized so that different groups are not
engaging in fundamentally different meth-
odologies. Data analytics teams need to
create visualization tools, dashboards, and
other interfaces so that their results are
straightforward and easy for senior execu-
tives to understand.
Many executives these days say that talent
trumps strategy—great people can rescue a
poor strategy. In technology, it takes both—
along with a healthy dose of organizational
effectiveness.
24. 22 | Productivity and Growth
Media Matters
The media landscape is changing so
swiftly that you had better not blink.
Disruption takes two primary forms in the
media industry:
•• The Shift in Content Consumption and Value.
Consumers have been rapidly shifting how
and where they consume and, increasing-
ly, create content. This trend, well known
at a macro level, is also fascinating on a
micro level. In the next minute, 216,000
photographs will be posted on Instagram,
80,000 posts will appear on Tumblr, 2.5
million pieces of content will be shared on
Facebook, and the equivalent of 61,000
hours of music will be streamed on
Pandora. Traditional media companies
are following their customers into these
new channels but are playing catch-up.
Parenthetically, despite the increasing pop-
ularity of user-generated content, the
value of professional video content has
never been higher, as underscored by the
popularity of live sporting events, Netflix,
Amazon Prime Instant Video, and other
OTT services. Netflix alone spent $2.1 bil-
lion on content in 2013, mostly purchased
from major media conglomerates. U.S.
networks spent about $30 billion last year
on the right to broadcast sporting events.
•• The Shift of Ad Dollars. Advertisers are
following consumers to digital and mobile
platforms and to video formats. From
2013 through 2018, spending on mobile
and online video ads is expected to grow
by 35 and 28 percent, respectively. New
players such as Facebook, Google, and
Twitter are capturing 70 percent of mobile
ad spending. This shift is coming at the
expense of traditional media. Magazines
and newspapers capture only about 20
percent of global ad spending, compared
with 40 percent in 2004.
Despite these steep growth rates, mobile
advertising still has room to grow. Consum-
ers spend about 20 percent of their media
time on mobile devices, yet advertisers
devote only 4 percent of their ad budget to
the channel. (See Exhibit 12.) It’s not
simply that advertisers are reluctant to
spend on mobile. Print continues to have
higher engagement levels than many
newer channels do. In addition, media com-
panies (except for search companies) have
not yet created business models that
optimize mobile ad creation and place-
ment, nor have they trained their sales
forces to capitalize on the mobile explosion.
Against that kaleidoscopic backdrop, it is
hardly surprising that, over the past five
years, the top-ten lists of media value creators
have been a roulette of changing names. Oth-
er than those based in emerging markets, no-
tably Tencent, Naspers, and Baidu, only one
25. The Boston Consulting Group | 23
company has made the top-ten list more than
twice—and that company, Pearson, a publish-
er and education outfit based in the UK, has
not appeared since 2012.
The media industry’s median 29 percent an-
nual TSR over the five years analyzed in this
report is encouraging. Many of this year’s top
value creators based in mature markets have
pursued clear, identifiable strategies. (See Ex-
hibit 13.)
Number one Sirius XM, with average annual
TSR of 97 percent, is the product of a 2008
merger of two satellite radio stations that was
criticized at the time as anticompetitive. The
combined entity has successfully exploited its
scale to increase revenues, margins, and sub-
scribers—despite radio being a challenged
medium. Sirius XM has relied heavily on ce-
lebrity on-air personalities, strong relation-
ships with car manufacturers, and expansion
into digital and online channels.
Number five, CBS, with an average annual
TSR of 53 percent, went in the opposite direc-
tion. CBS split off from Viacom in 2005, al-
lowing the broadcaster to focus on develop-
ing original programming and airing live
sports events. In October, CBS announced it
would launch a $6 monthly OTT video ser-
vice that would air both current shows and
titles from its library, including every episode
of Star Trek and Cheers. This move creates a
new delivery platform for CBS’s content and
builds direct relationships with customers.
If Sirius and CBS are products of M&A activi-
ty, number eight, Schibsted Media Group,
with an annual TSR of 46 percent, has creat-
ed value through portfolio transformation.
Based in Norway, the publisher developed a
strong online classified business in both ma-
ture and emerging markets, generating more
than one-half of its revenues from online
channels. Schibsted Growth is an in-house
venture fund that invests in digital properties
such as Prisjakt, Hitta, TV.nu, Let’s Deal, and
Lendo. At the same time, Schibsted has been
introducing digital and mobile capabilities
and services into its traditional print busi-
nesses.
Several common lessons emerge from the
successes of the top media value creators.
Developing an Integrated Value-
Creation Strategy
Despite overall flat revenues or even reve-
nues that are declining, many media compa-
nies are still generating strong cash flow that
can help finance dividend payouts and stock
repurchases—and buy time with investors.
10
19
22
45
20
12
5
25
38
0
15
30
45
MobileRadioPrintWebTV
Share of consumer time spentShare of advertising spending
%
4
Sources: Business Insider via Mary Meeker; IAB; eMarketer; BCG analysis.
Note: Includes U.S. data from 2013.
Exhibit 12 | Mobile Remains an Underpenetrated Ad Channel
26. 24 | Productivity and Growth
Many of today’s media investors are “deep
value” investors. We recently interviewed in-
vestors of two traditional media clients. The
individual portfolios of a significant segment
of this group held only one media stock.
These investors said that they were buying
“cheap” cash flow, and many would sell as
soon as the market recognized the arbitrage
opportunity. Few were committed to the com-
panies’ futures or the future of the indus-
try—a significant change from the historic
profile of media investors.
Many media companies are allowing them-
selves to be defined by these deep-value in-
vestors. But by adopting a comprehensive
TSR approach, they can start to frame their
own stories and attract long-term investors
who both understand the fundamentals of
the industry and are willing to earn steady re-
turns while media companies reconfigure
their business for the digital era.
Most media companies acknowledge that
they need to transform their business but
don’t fully incorporate business, financial,
and investor strategies, as depicted in Exhibit
7. By taking a comprehensive approach, me-
dia companies can remove a 10 to 15 percent
discount from their stocks.
Finding Productivity and Growth
in the Core
Although traditional media properties are in
varying degrees of health, they could all ben-
efit from a fresh look at costs, efficiency, ef-
fectiveness, and purpose. It may be difficult
to generalize across disciplines as different as
daily newspapers and movie studios, but sev-
eral areas are worth exploring.
Cultural Change in Creative and Editorial
Functions. In the past, many media compa-
nies were run by creative executives for
Exhibit 13 | Sales Growth Matters in Media
Sources: Standard & Poor’s Capital IQ; Thomson Reuters Datastream; Bloomberg; annual reports; BCG analysis.
Note: Sample consists of 59 companies, each of whose market valuation is greater than $4 billion.
1
Contribution of each factor shown in percentage points of five-year average annual TSR; any apparent differences to TSR totals are due to
rounding. The top ten is the median for each factor and will not sum.
2
Average annual total shareholder return, 2009–2013. The top ten is the median excluding Sirius XM.
3
As of December 31, 2013. The top ten represents aggregate market value.
4
Change in EBITDA multiple.
5
As of November 3, 2014.
6
TSR disaggregation is not available due to negative EBITDA at the start of the previous year.
TSR disaggregation1
Company Location Segment
TSR2
(%)
Market
value3
($billions)
Sales
growth
(%)
Margin
change
(%)
Multiple
change4
(%)
Dividend
yield
(%)
Share
change
(%)
Net
debt
change
(%)
2014
TSR5
(%)
1 Sirius XM Holdings United States Radio broadcast 96.9 21.4 n/a6
0
2 ProSiebenSat.1 Media Germany
Broadcast and
entertainment
83.3 10.6 –3 8 22 11 0 45 –7
3 Rightmove United Kingdom Internet 76.1 4.4 13 7 49 3 2 2 –21
4 Baidu China Internet 68.6 62.2 62 0 7 0 –0 –1 34
5 Tencent Holdings China Internet 58.7 117.6 57 –9 12 1 –1 –1 28
6 CBS United States
Broadcast and
entertainment
53.1 38.2 2 5 26 2 2 16 –14
7 Naspers South Africa
Broadcast and
entertainment
46.8 41.4 19 –14 41 1 –1 1 26
8 Schibsted Media Group Norway
Internet and
publishing
46.2 7.1 2 –2 30 9 –10 17 –10
9 Dish Network United States
Broadcast and
entertainment
45.0 26.5 4 –5 30 6 0 11 10
10
Discovery
Communications
United States
Broadcast and
entertainment
44.9 31.5 10 1 22 0 4 6 –21
Top ten 53.1 374.3 10 0 26 2 0 6 –4
27. The Boston Consulting Group | 25
whom spreadsheets and management skills
were not necessarily second nature. That
approach no longer works in an era of 24-7
news coverage, digital disruption, and falling
margins. The challenge today is to preserve
the creative edge of media companies while
injecting business acumen and developing
more standardized and efficient processes.
Some media companies have installed
number two executives with strong business
skills, while many have begun to rely more
heavily on data to complement editorial and
creative judgments.
A European television studio recently recog-
nized the need to make fundamental changes
in its creative operations in order to grow. A
new strategy, which focused on better exploit-
ing the creative output of the company’s pro-
duction business, required much closer col-
laboration among creative and business
executives. The company needed stronger
commercial acumen in the studios in order to
uncover and exploit new revenue sources. It
also needed people experienced in develop-
ing content that would appeal to overseas
markets—a principal source of future growth.
Finally, it needed leaders comfortable manag-
ing both the creative and business sides of
production. Historically, leaders were promot-
ed on the basis of their creative judgment
rather than their business skills. The growth
strategy required new organization structures
and a shift in culture. Together, these changes
have helped the studio boost revenues, em-
ployee engagement, and shareholder return.
Product Redesign. Media companies must
also reexamine their portfolio of products in
light of changing consumer behaviors, which
are gravitating toward, as just one example,
the simple and streamlined offers of OTT
providers. Foxtel, a cable and satellite TV
company in Australia, revamped its entire
pricing and packaging in early November
2014. The company lowered the cost of its
entry-level package significantly in order to
win new customers, including illegal down-
loaders. It also reshaped its premium and
on-demand offerings by providing a stream-
ing on-demand option.
Newspapers are similarly experimenting with
new ways to bundle content across physical
and online channels. Research by several U.S.
newspaper chains has shown that they can
increase subscription rates by 20 to 40 per-
cent without appreciable volume loss by de-
veloping customized combinations of physi-
cal product and digital access.
The challenge is to preserve
the creative edge while
developing business acumen.
Pricing. Even in slow-growth or no-growth
markets, pricing remains an often-overlooked
opportunity for growth. Research by a maga-
zine publisher in Europe showed that consum-
ers valued its properties so highly it was able to
raise subscription prices for its principal titles
by 5 to 15 percent. The potential to raise prices
depends on the competitive positioning of the
brands, of course, as well as on whether they
are offering unique and differentiated content.
Sales Force Effectiveness. A close cousin of
pricing is sales force effectiveness, a proven
way to boost revenues and cut costs. An
Asian print-oriented media company whose
advertisers were putting more money into
digital properties turned the odds in its favor
by taking a fresh look at its sales process.
The company broke down what had been a
siloed sales organization through consolida-
tion and the creation of shared services. It
built new functions that delivered market in-
sights to the sales team and freed them from
administrative functions. And it invested
heavily in training and developing a national
approach to pricing. Collectively, these chang-
es helped reduce costs by 15 percent and
drive revenue growth of 5 to 10 percent.
Resizing and Reshaping the Portfolio. The
media industry is simultaneously breaking
apart and reconsolidating. Traditional
multisector media conglomerates, such as
Gannett, Time Warner Cable, and News
Corporation, have been splitting in two in
order to separate their print businesses from
TV and other properties. (See the sidebar
“Gannett’s Transformation.”) At the same
28. 26 | Productivity and Growth
One of the most successful media transfor-
mations has occurred at Gannett. This
transformation culminated in an announce-
ment in August that it would peel away its
publishing business from its faster-growing
digital and broadcasting businesses.
This split of the company would likely not
have been possible without a series of
earlier moves that improved the fortunes of
the print and broadcast as well as the
digital sides of the business. Gannett
increased performance by transforming its
core business and buying the Belo broad-
casting group of TV stations for $2.2 billion.
This acquisition helped Gannett achieve
scale in its broadcasting business and
rebalance its overall portfolio. Gannett also
built a new platform to sell advertising to
small and medium-size businesses in
multiple channels. In addition, Gannett
acquired full ownership of Cars.com.
Combined with its majority ownership of
CareerBuilder, the acquisition created a
financially meaningful digital business
adjacent to its core.
Along the way, Gannett provided incremen-
tal shareholder value that was based on its
strong cash flow by increasing dividends
and stock buybacks. Since announcing its
transformation at its first-ever investor day
in March 2012, the company has tripled its
share price and been one of the top value
creators in the S&P 500 index. (See the
exhibit below.) In 2012, the company
posted its first year-over-year revenue
growth since 2006.
0
100
200
300
400
500
Global market average1
= 200
Return index
2009 2010
S&P 500 average = 228Gannett = 432
2014201320122011
Sources: S&P Capital IQ; Thomson Reuters Datastream; BCG analysis.
1
MSCI All-Country World Index.
Gannett’s Strategic and Financial Moves Have Paid Off
Gannett’S Transformation
29. The Boston Consulting Group | 27
time, many of these companies are using
acquisitions to achieve scale in their more
narrowly focused businesses. Journal Media
Group and E.W. Scripps, for example, are
merging their broadcasting companies and
spinning out their collective newspaper
assets. In effect, they are creating two larger
companies: one focused on broadcasting and
one on newspapers.
Building New Digital Businesses
By fixing their legacy operations, traditional
media companies can free up resources to
invest in adjacent higher-growth businesses,
particularly digital ones. Creating a new
business within a traditional media busi-
ness, however, is not an easy task. It will
likely compete with the parent’s traditional
business and cannibalize sales. Leaders will
have to make strategic and organizational
choices about whether to integrate their dig-
ital and legacy businesses or build a sepa-
rate “attacker” digital business.
A stand-alone business should be run inde-
pendently with aggressive goals, along with
different hiring practices and a distinct cul-
ture and operating rhythm. The parent com-
pany needs to be supportive but not meddle-
some. Schibsted has largely followed this
model in creating new businesses. In 2007,
Kjell Aamot, then chief executive of Schibst-
ed, told the New York Times that the company
had recognized a decade earlier that “being a
traditional Norwegian newspaper company
would not be sustainable over time…. We
changed from a defensive stance at the begin-
ning of the Internet age to a very offensive
one.”
That is a stance that all traditional media
companies should adopt.
30. 28 | Productivity and Growth
The Telecom Bounce
The challenges facing incumbent
telecom operators are well known. Mobile
revenues in mature markets are falling or flat,
and growth in emerging markets is flattening
rapidly. Mobile data traffic has been doubling
every year since 2009, but operators have not
benefited from that growth nearly as much as
have the OTT players whose services are
partly responsible for straining network
capacity. (See Exhibit 14.)
Mobile data traffic has doubled every year Telecom operators have not
captured the value
1,057
961967
1,882
1,196
776
0
500
1,000
1,500
2,000
Cumulative market caps ($billions)
201320112009
500
1,000
1,500
2,000
Q4Q2Q4Q2 Q2Q4Q2
Global monthly mobile traffic (petabytes)
Top-ten over-the-top players2
Top-ten telecom operators1
Voice
Data
2009 2010 2011 2012 2013
CAGR,
2009–2013
+109%
+14%
Q1 Q3Q3Q1Q4Q3 Q3Q1Q3Q1
0
Sources: Cisco Visual Networking Index 2013; Thomson; Standard & Poor’s Capital IQ; annual reports.
1
The top ten telecom operators are China Mobile, AT&T, Telefónica, Vodafone Group, Verizon, France Télécom, Deutsche Telekom, NTT, NTT
DoCoMo, and América Móvil.
2
The top ten over-the-top players are Apple, Microsoft, Google, Amazon.com, Facebook, eBay, Yahoo, Baidu, Tencent Holdings, and Priceline.com.
Exhibit 14 | Telecom Operators Have Not Captured Value Commensurate with the Growth
in Mobile Data Traffic
31. The Boston Consulting Group | 29
At the same time, regulatory uncertainty and
a fragmented industry structure in many
markets have prevented or delayed necessary
network investments. It is no wonder that eq-
uity analysts are bearish, with the share of
“buy” and “outperform” recommendations
declining from 55 percent in January 2009 to
40 percent in August 2014.
Despite these challenges, the industry rebound-
ed sharply in the 2009–2013 period, recording
a median annual TSR of 15 percent, which far
exceeded the single-digit or negative returns in
the prior four five-year periods. While this is
progress, the industry remains in the bottom
half of industries in generating shareholder val-
ue. Seven of the sample’s 55 companies—five
from Europe alone—destroyed shareholder
value totaling $47 billion over this period.
So what is setting the most successful compa-
nies apart? On average, the largest contribu-
tors to TSR among the top ten have been
multiple change, sales growth, and debt re-
duction. (See Exhibit 15.) Specific events,
however, also play a role. First-placed Siste-
ma’s performance has been driven by a con-
trolling stake in an oil company, while Time
Warner Cable’s special dividend in 2009 con-
tributed heavily to its five-year TSR.
Fundamentals matter too. SoftBank and Lib-
erty Global, two active consolidators, made
the top ten, and the mobile infrastructure
specialists SBA Communications and Crown
Castle International focused on only one
piece in a deconstructed value chain, namely
renting towers and other mobile infrastruc-
ture to operators.
Increasingly, a strong emerging-market focus
is no longer a guarantee of a top-ten place-
ment. Although Advanced Info Service, based
in Thailand, and Telenor Group—headquar-
Exhibit 15 | Top TSR Telecommunications Companies Have Exhibited Sales Growth
Sources: Standard & Poor’s Capital IQ; Thomson Reuters Datastream; Bloomberg; annual reports; BCG analysis.
Note: Sample consists of 55 companies, each of whose market capitalization is more than $8 billion.
1
Contribution of each factor shown in percentage points of five-year average annual TSR; any apparent differences to TSR totals are due to
rounding. The top ten is the median for each factor and will not sum.
2
Average annual total shareholder return, 2009–2013. The top ten is the median.
3
As of December 31, 2013. The top ten represents the aggregate market value.
4
Change in the EBITDA multiple.
5
As of November 3, 2014.
6
The TSR results do not reflect the company’s recent restatement of earnings in 2013 and the first half of 2014.
TSR disaggregation1
Company Location Segment
TSR2
(%)
Market
value3
($billions)
Sales
growth
(%)
Margin
change
(%)
Multiple
change4
(%)
Dividend
yield
(%)
Share
change
(%)
Net
debt
change
(%)
2014
TSR5
(%)
1 Sistema Russia
Mobile, fixed
line, and cable
43.5 11.0 16 –8 30 1 0 4 –73
2 SoftBank Japan
Mobile and
fixed line
42.9 103.9 20 3 13 1 –2 8 –13
3 Liberty Global United Kingdom
Mobile, fixed
line, and cable
41.1 35.1 7 2 18 0 –7 21 2
4 SBA Communications United States
Mobile
infrastructure
40.7 11.5 22 3 8 0 –2 9 25
5 Time Warner Cable United States
Fixed line,
data, and cable
40.4 38.2 5 –1 8 24 3 0 12
6 Crown Castle International United States
Mobile
infrastructure
33.1 24.1 15 1 10 0 –3 10 9
7 Advanced Info Service Thailand Mobile 31.4 18.1 5 1 13 11 0 1 26
8 Etihad Etisalat Saudi Arabia Mobile 31.16
17.6 18 7 –4 6 0 4 –3
9 Telenor Group Norway
Mobile and
fixed line
29.8 37.0 1 2 13 4 1 7 10
10 BT Group United Kingdom
Mobile and
fixed line
27.4 49.4 –3 13 2 5 –1 12 –1
Top ten 36.8 345.9 11 2 11 3 0 8 6
32. 30 | Productivity and Growth
tered in Norway with strong presences in
Eastern Europe and Asia—both thrived on
the dynamism of their respective markets,
just as many emerging-market players placed
in the bottom half as in the top half of TSR
returns.
Among the top ten large-cap telecom
companies, the value creation dynamic shifts
dramatically. They are going back to their
future as utility stocks. Dividends and stock
repurchases provided the most TSR uplift,
responsible for 5 percentage points of their
13 percent annual TSR, while sales growth
contributed just 2 percentage points. (See
Exhibit 16.)
So what does this mean for future value cre-
ation? In short, a business-as-usual momen-
tum case for operators is bleak. First, they
should take an active role in shaping industry
structure and regulation and driving consoli-
dation within their markets. Second, like their
peers in the tech and media industries, future
top performers must generate value through
productivity measures, create growth initia-
tives within their core business, and pursue
attractive growth opportunities outside their
comfort zone. (See Exhibit 17.)
Shaping Market Structure and
Regulation
Capital-intensive infrastructure investments
have been slow in Europe. Current regula-
tions often restrict carriers from pricing their
services adequately or with certainty, putting
a brake on investments that could help both
the industry and national economies. The re-
sponse in Australia and Singapore has been
state-driven deployment of infrastructure. In
other regions and where regulation allows,
in-market consolidation has occurred, such as
KPN’s sale of E-Plus to Telefónica’s O2 in Ger-
many or the ongoing consolidation activities
in Brazil.
TSR disaggregation1
Company Location Segment
TSR2
(%)
Market
value3
($billions)
Sales
growth
(%)
Margin
change
(%)
Multiple
change4
(%)
Dividend
yield
(%)
Share
change
(%)
Net
debt
change
(%)
2014
TSR5
(%)
1 SoftBank Japan
Mobile and
fixed line
42.9 103.9 20 3 13 1 –2 8 –13
2 Liberty Global United Kingdom
Mobile, fixed
line, and cable
41.1 35.1 7 2 18 0 –7 21 2
3 Time Warner Cable United States
Fixed line, data,
and cable
40.4 38.2 5 –1 8 24 3 0 12
4 Telenor Group Norway
Mobile and
fixed line
29.8 37.0 1 2 13 4 1 7 10
5 BT Group United Kingdom
Mobile and
fixed line
27.4 49.4 –3 13 2 5 –1 12 –1
6 American Tower United States
Mobile
infrastructure
23.0 31.5 16 –1 8 1 0 –1 23
7 MTN Group South Africa Mobile 19.5 37.9 6 0 8 5 0 1 19
8 BCE Canada
Mobile and
fixed line
19.1 33.6 3 –1 9 6 1 1 13
9 Vodafone Group United Kingdom Mobile 18.4 190.3 –1 –6 11 7 2 5 –18
10 KDDI Japan
Mobile and
fixed line
17.9 51.4 4 1 7 3 1 1 14
Total large cap (25 companies) 13.3 1,790.7 2 –1 4 5 0 1 11
Sources: Standard & Poor’s Capital IQ; Thomson Reuters Datastream; Bloomberg; annual reports; BCG analysis.
Note: Sample consists of 25 companies, each of whose market capitalization is more than $25 billion.
1
Contribution of each factor shown in percentage points of five-year average annual TSR; any apparent differences to TSR totals are due to
rounding. The top ten is the median for each factor and will not sum.
2
Average annual total shareholder return, 2009–2013. The total large cap is the median TSR of the sample.
3
As of December 31, 2013. The total large cap represents aggregate market value.
4
Change in the EBITDA multiple.
5
As of November 3, 2014.
Exhibit 16 | Many Large-Cap Telecommunications Companies Rely on Dividends
33. The Boston Consulting Group | 31
Authorities increasingly recognize that ade-
quate market structure and regulation are
critical not only for carriers but also for the
overall economy. But there is still more to do.
Carriers should continue to press for both
in-country consolidation and regulatory cer-
tainty that permits steady returns commensu-
rate with risks.
In advocating for stable and investment-
friendly regulation, carriers will have to think
creatively about how to price separately for
services that run on legacy networks and
those that run on new networks that have
been deployed at higher economic risk.
Productivity: Radical Changes
to the Operating Model
Telecom operators have been cutting back.
The key European companies, for example,
are reducing spending by more than 5 per-
cent annually year over year. But few of them
are making the structural changes that will
generate further savings.
Simplified Product Portfolio. Operators with
complex tariffs can take a lesson from a few
new entrants that have gone to market with
simple offers. In France, broadband provider
Free entered the mobile market two years
ago with a low-cost offer of €2 a month for 60
voice minutes and 60 text messages and a
premium offer at €19.99 a month for unlimit-
ed calls and texts and three gigabytes of data
usage. (The only subsequent changes have
been to add free roaming and additional
data.) This simple retail offer enables lean
operations, such as online sales and fulfill-
ment, the recent rollout of interactive
SIM-card dispensers, and an overall lower
cost structure. This business model has
allowed Free to capture a 12 percent market
share.
Simple offers also work in markets—such as
the U.S.—where regulation is not as favorable
to so-called mobile virtual-network operators
like Free. U.S.-based T-Mobile’s Un-carrier
Strategy provides an easy-to-understand port-
folio of products and an end to the practice of
subsidizing handsets in return for long com-
mitments. After a year of these offerings, sub-
scriber growth rose by 15 percent and reve-
nues increased by 8 percent. Although
EBITDA margins still trailed industry averag-
es, they had stabilized at 20 percent.
Low-Cost Networks. Mobile networks general-
ly receive the most press, but fixed-network
traffic is also rising exponentially—by about
50 percent annually, according to Cisco. In
TSR, 2019–2023TSR, 2014–2018Historical five-year TSR
Growth outside the core
Fundamental levers to generate TSR
Market momentum (as is) Productivity increases Core growth
Source: BCG analysis.
Exhibit 17 | Top-Performing Telecom Operators Cannot Rely on Momentum and
Productivity
34. 32 | Productivity and Growth
this environment, network efficiency and
careful capital allocation are critical.
Removing the legacy remnants of a network
can be an operator’s most effective efficiency
measure. Moving to a fully IP-enabled net-
work can save up to 40 percent in operating
costs by cutting energy bills and terminating
maintenance contracts for legacy hardware.
The implementation of software-defined net-
works also adds to cost efficiency and flexibil-
ity by centralizing routing decisions. Such
modernized networks also accelerate revenue
growth through the faster introduction of
new services.
The traditional method of upgrading net-
works through national, one-size-fits-all roll-
outs also requires an overhaul. Different re-
gions within a national rollout area have
different characteristics and variable market
potentials—so a solution that works well in
one region may not produce optimal results
in another.
Despite the stiff headwinds,
operators can grow through
several measures.
Fiber to the home, for example, fares best in
high-density, affluent areas but is hard-pressed
to turn a profit in more spread-out regions.
One operator conducting a fiber-to-the-home,
fiber-to-the-curb rollout was able to avoid
more than $1 billion in capital expenditures
that would not have earned a return. The car-
rier then redirected some of that savings to ar-
eas that were more commercially attractive.
Another carrier analyzed more than 1 billion
voice and data entries of 70 million subscrib-
ers to decide which were the most commer-
cially attractive sites to upgrade to 4G ser-
vices. As a result, average revenues generated
per user on upgraded sites were more than
five times the revenues of sites that had not
been upgraded.
Full-Scale Transformation. A simpler product
portfolio and network, accompanied by new
processes and service platforms, creates a
virtuous cycle of strong customer experience,
increased revenues, lower operating costs,
and more efficient use of capital.
By following many of the steps outlined
above, a telecom operator recently reduced
its customer-service workload by 40 to 90 per-
cent, depending on the type of request, and
improved customer advocacy. The client ex-
pects these improvements will stabilize reve-
nues, reduce operating expenses, and free up
10 percent of capital spending.
Core Growth
Despite the stiff headwinds, operators still
have opportunities to grow through several
measures, such as consolidation, convergence,
pricing, and customer services.
Consolidation. M&A activity is picking up in
the telecom sector in order to achieve scale
and fixed-mobile convergence. (See Exhibit
18.) Many of the recently announced deals,
such as Telefónica’s acquisition of E-Plus, will
lead to significant cost savings if the compa-
nies are carefully integrated. Revenues will
also rise if carriers are allowed to operate
freely. In addition, there are opportunities to
increase revenues by creating smart fixed-
mobile convergence offers that increase
cross- and up-selling—and reduce churn.
Vodafone Group’s acquisitions of cable
operators Kabel Deutschland in Germany
and of ONO in Spain, as well as Telekom
Malaysia’s acquisition of Packet One Net-
works, fit into this mold. Operators with
mobile-only or fixed-only operations need to
evaluate their options.
Convergence. Winning through convergence
is not easy. Traditionally, most convergence
offers have been built around simple dis-
counted bundles that prompted customers to
buy more and save. Operators would slap
together their existing fixed and mobile plans
and shave a few dollars off the price. But
competitors could easily replicate such
bundles, shaving still more off the cost. The
resulting price war eroded margins.
Some offers work better than others. The key
is that simple discounts should not be the
35. The Boston Consulting Group | 33
centerpiece. Instead, an operator’s assets
should be combined in ways that offer
unique, compelling services and have a clear
“better together” value proposition. In our
work with leading providers, we have identi-
fied three key approaches:
•• Focus on families. In most markets, families
are particularly high-value customers.
They are also likely to be attracted to
features and services that make for
positive discounts. Positive discounts are
features or plan attributes that consumers
perceive as valuable but that telecom
operators can provide for limited cost—or
even no cost at all. They allow operators
to provide unique offerings in their
fixed-mobile packages without cannibaliz-
ing existing revenues. Free calls between
members of the same household and
collective access to video- and mu-
sic-streaming services are examples of
positive discounts.
•• Expand the reach of traditional features.
Operators can offer services such as video
on several devices at no extra cost to the
customer. In the Swiss market, for exam-
ple, subscribers can store TV recordings in
the cloud and access them on any device,
and they can program their set-top box
with their smartphones or tablets.
•• Rely on bandwidth-intensive value-added
services. Features such as multidevice
video streaming and online game playing
can drive usage. If they are included in the
right bundle, consumers will often trade
up to more costly data plans in order to
enjoy the services.
The early results from this new wave of con-
vergence offers are encouraging. In France,
Orange’s Open, Telefónica’s Movistar Fusión
in Spain, and Portugal Telecom’s M4O plans
have achieved up to 40 percent penetration
among broadband subscribers.
Pricing. Only a few carriers outside the U.S.
have managed to follow the likes of Verizon
in tying pricing tightly to mobile data usage.
(See the sidebar “Verizon’s Growth.”) Telia of
0
200
600
400
2005
181
156
306
214
2003 20062004
70
115
2002
120
2001
175
2000
521
2009
Deal volume ($billions)
2013
98
2012
118
2011
146
2010
127
1999
156
1998
111
2007
94
2008 2014
205
Number
of deals
109 153 237 210 165 187 245 301 369 389 332 196 221 203 185 167 96
Wave 1 Wave 2 Wave 3
Empire building:
achieving scale in
the developed world
Market consolidation:
achieving scale in the
Americas and Japan
Empire building:
achieving scale in
emerging markets
Market
consolidation:
achieving
scale locally
and scope
globally
Sources: Standard & Poor’s Capital IQ; BCG analysis.
Note: 2014 deals are through October 31.
Exhibit 18 | Telecom M&A Activity Picks Up
36. 34 | Productivity and Growth
Sweden slightly increased postpaid average
revenues per user (ARPU) within a year of
launching a tiered data plan that allows
consumers to share usage among devices.
Competitor Telenor quickly followed suit,
and recent data shows a reversing trend in
average mobile-broadband prices in Sweden
overall.
Changing tariffs alone, of course, will not
lead to a sustainably increasing ARPU. Strong
network performance and the corresponding
willingness (and ability) of customers to pay
are closely related. Recent studies show that
in mature markets—and particularly for
higher-value customers—network perfor-
mance is the most important factor in cus-
tomer loyalty, allowing operators with top-rat-
ed networks to charge premiums.
Customer Service and Advocacy. Customer
service pays. O2 in the UK has established a
reputation for great customer service. It now
receives up to six times fewer complaints
from customers than its competitors do,
reducing cost to serve and churn and creating
revenue potential through lower price
sensitivity and viral marketing. Recent BCG
estimates show the investments in customer
service pay for themselves four times over
within five years.
Growth Beyond the Core
To generate long-term value for shareholders,
operators also need to find ways to grow prof-
itably in new areas. Growth does not neces-
sarily generate shareholder value, so this is
high-stakes strategic work.
Among large-cap companies, Verizon is one
of the few operators to create shareholder
value from both revenue and margin
growth. Those two factors contributed a
little more than half of its 15 percent
annual TSR over the past five years, with
most of the rest coming from dividends.
Verizon’s stock, which traded below $30 for
most of 2008 through 2010, had settled in
the $50 range in late 2014.
Verizon’s fundamentals have been an-
chored in steady mobile-subscriber
growth—from 78 million subscribers at the
end of 2008 to 121 million by the end of
2013—paired with price discipline and
innovation. The company led the U.S.
market with the introduction of data-shar-
ing plans in 2012.
Further, Verizon has aggressively deployed
its LTE network, reducing network operat-
ing costs, avoiding short-sighted spending
on 3G infrastructure, and strengthening its
pricing power through a high-quality
network. These moves have enabled
Verizon to achieve 50 percent margins in
its wireless business. Unlike many other
carriers, it reports that average revenues
per user have been growing by 1.5 to 2
percent annually over the past four years.
But as Verizon has pushed revenue growth,
it has also aggressively taken out costs,
especially in its wireline division.
Investors have also been encouraged by
several of Verizon’s strategic moves.
Notably, Verizon acquired the remaining 45
percent stake in Verizon Wireless from
Vodafone Group with low-cost financing.
Verizon also invested heavily in its fiber-to-
the-home FiOS network across 16 states,
creating a viable wireline-growth platform.
Verizon has also appealed to dividend-
oriented investors by stating its intention
to pay down debt and create further growth
platforms, including a likely OTT video
offering in 2015 and a relaunch of the
company’s enterprise cloud offer. Against
this backdrop, the consensus view of
analysts is that Verizon will generate a
momentum-based annual TSR of 8 percent
with additional growth kicking up returns
to 12 percent through 2016. In order to
maintain its 15 percent annualized
five-year TSR—as forecast by the most
bullish quartile of analysts—Verizon will
have to deliver on its promises flawlessly.
Verizon’S Growth
37. The Boston Consulting Group | 35
•• Adjacencies. Several telecom operators
have recently made large bets in adjacent
businesses. Telstra, BT, and others have
invested in expanding their information
and communications technologies (ICT)
businesses on the back of existing
corporate relationships. Verizon, with its
$1.4 billion acquisition of Terremark in
2011, entered the enterprise cloud
market. Yet many telecom operators
struggle to participate meaningfully in
the $800 billion ICT market—which is
growing 5 percent a year—as they need a
compelling offer to compete against IBM,
Accenture, and other market leaders.
•• Up the Stack. Several telecom operators
have created vehicles to make invest-
ments in high-growth digital areas higher
up the stack. Deutsche Telekom’s T-Ven-
ture has invested in a broad spectrum of
online, media, and mobile services.
Orange, formerly France Télécom, has
focused on TV and online video hosting
and music streaming, while Telefónica
invested in a social-networking site. A
partnerships is often a viable alternative
when the carrier is able to leverage its
distribution strength to reach a mass
market with a popular service, as in
Deutsche Telekom’s music-streaming deal
with Spotify or Vodafone Group’s venture
with Netflix. In the most successful cases,
customers become accustomed to the
service, data usage increases, and churn
decreases.
•• Verticals. Some telcos leverage their
network and ICT assets to become stack
orchestrators in specific verticals. NTT
DoCoMo supports financial institutions in
reducing costs by providing integrated
services ranging from near-field communi-
cations to payment network interfaces. It
has made eight acquisitions to build this
payments-oriented ecosystem. Both NTT
DoCoMo and Singapore Telecommunica-
tions have made advertising acquisitions,
SK Telecom has bought semiconductor
and nanobiotech device manufacturers,
and AT&T has entered the health care ver-
tical by offering emergency calls, geoloca-
tion capabilities, and remote monitoring
as an integrated service.
These opportunities will not make sense for
some telecom operators. When it comes to
finding new value-creation levers, imitation is
not a form of flattery. Doing the hard work of
setting strategy and being adaptive is the
winning move. Playing follow the leader, with
inadequate capabilities, is not.
38. 36 | Productivity and Growth
The following publications by The
Boston Consulting Group will help
readers who want to explore several
of the topics in this report more
closely.
Connecting Rural Markets: How
Fixed Wireless Is Unlocking
Digital—Everywhere
A Focus by The Boston Consulting
Group, October 2014
Making More Money from Data:
Five Pricing Secrets of B2B
Information-Services Companies
An article by The Boston Consulting
Group, October 2014
The Most Innovative Companies
2014: Breaking Through Is Hard
to Do
A report by The Boston Consulting
Group, October 2014
Improving Engagement
and Performance in Digital
Advertising: Adding Data,
Boosting Impact
A Focus by The Boston Consulting
Group, September 2014
The New Rules for Designing
Fixed-Mobile Bundles: Winning
with Convergence
An article by The Boston Consulting
Group, August 2014
Pathways Conjoint: A New
Approach to Pricing Mobile
An article by The Boston Consulting
Group, June 2014
Code Wars: The All-Industry
Competition for Software Talent
A Focus by The Boston Consulting
Group, May 2014
Enabling Big Data: Building the
Capabilities That Really Matter
A Focus by The Boston Consulting
Group, May 2014
A New Business Cycle for Telcos:
Time to Invest Again
An article by The Boston Consulting
Group, May 2014
New Uses for Telcos’ Core Assets
in a Digital World
An article by The Boston Consulting
Group, March 2014
A Playbook for Developing-
Market Mobility Carriers:
Reigniting Performance
A Focus by The Boston Consulting
Group, February 2014
The 2013 TMT Value Creators
Report: The Great Software
Transformation
A report by The Boston Consulting
Group, December 2013
for further reading
39. The Boston Consulting Group | 37
This is BCG’s fifth report in the
Technology, Media & Telecommuni-
cations value-creation series. The
main purpose is to help clients un-
derstand the dynamics of sharehol-
der growth in these dynamic indus-
tries. More than ever, your success
will be defined by your ability to
achieve both productivity and
growth, as outlined in this report.
We hope that this report has
brought several key value creations
to life.
About the Authors
Wolfgang Bock is a senior partner
and managing director in the
Munich office of The Boston
Consulting Group, the global leader
of the telecommunications sector,
and the regional leader of Central
Europe, the Middle East, and Africa
for the Technology, Media &
Telecommunications practice.
Philip Evans is a senior partner
and managing director in the firm’s
Boston office. Patrick Forth is a
senior partner and managing
director in BCG’s Sydney and
London offices and the global
leader of the Technology, Media &
Telecommunications practice.
Fredrik Lind is a partner and
managing director in the firm’s
Stockholm office, the leader of the
Technology, Media &
Telecommunications practice in
Sweden, and marketing partner for
the Technology, Media &
Telecommunications practice.
David Mark is a senior partner and
managing director in BCG’s San
Francisco office and the global
leader of the technology sector.
Antonella Mei-Pochtler is a senior
partner and managing director in
the firm’s Vienna office and the
global leader of the media sector.
Christian Nill is a project leader in
BCG’s Kuala Lumpur office. Frank
Plaschke is a partner and
managing director in the firm’s
Munich office, one of the coauthors
of the main Value Creators report,
and the European leader of the
total-shareholder-return strategy
topic.
Acknowledgments
The authors would like to thank the
dozens of colleagues around the
globe who assisted with the re
search and analysis for this report.
Several partners, consultants, and
knowledge-team members made
contributions in each local market
covered by the report. The authors
would especially like to thank
Frank Arthofer, Niki Aryana, Astrid
Blumstengel, Ruba Borno, Joseph
Brilando, Tim Crosling, Philippe
Dehillotte, Sebastian DiGrande,
Hady Farag, Jody Foldesy, Fabrizio
Genziani, Guy Gilliland, Anna
Green, Boryana Hintermair, Vijai
Krishnan, Wofgang Merla, John
Rose, Brian Roughan, Sanjay Ver-
ma, Arnaud Voguet, and Maikel
Wilms for their insights; Amanda
Provost for marketing; and Mark
Voorhees for writing assistance.
The authors would also like to
thank Katherine Andrews, Gary Cal-
lahan, Sarah Davis, Kim Friedman,
Abby Garland, and Sara Strassen-
reiter for their editorial and produc-
tion support.
For Further Contact
If you would like to discuss this
report, please contact one of the
authors.
Wolfgang Bock
Senior Partner and Managing Director
BCG Munich
+49 89 231 740
bock.wolfgang@bcg.com
Philip Evans
Senior Partner and Managing Director
BCG Boston
+1 617 973 1200
evans.philip@bcg.com
Patrick Forth
Senior Partner and Managing Director
BCG Sydney and London
+61 2 9323 5600
forth.patrick@bcg.com
Fredrik Lind
Partner and Managing Director
BCG Stockholm
+46 8 402 4400
lind.fredrik@bcg.com
David Mark
Senior Partner and Managing Director
BCG San Francisco
+1 415 732 8000
mark.david@bcg.com
Antonella Mei-Pochtler
Senior Partner and Managing Director
BCG Vienna
+43 1 537 56 80
mei-pochtler.antonella@bcg.com
Christian Nill
Project Leader
BCG Kuala Lumpur
+60 3 2688 5000
nill.christian@bcg.com
Frank Plaschke
Partner and Managing Director
BCG Munich
+49 89 231 740
plaschke.frank@bcg.com
note to the reader