North American Office Highlights Q4 2014
•
1 like•504 views

North American Office Market Research from Colliers International

Recommended
Recommended
More Related Content
What's hot
What's hot (12)
Similar to North American Office Highlights Q4 2014
Similar to North American Office Highlights Q4 2014 (20)
More from Coy Davidson
More from Coy Davidson (11)
Recently uploaded
Recently uploaded (20)
North American Office Highlights Q4 2014
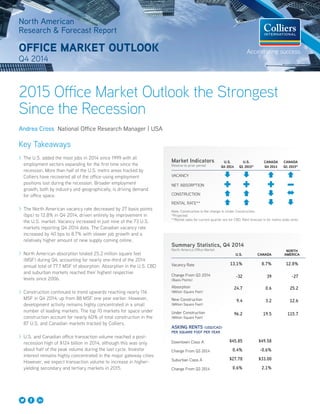
- 1. North American Research & Forecast Report OFFICE MARKET OUTLOOK Q4 2014 Key Takeaways >> The U.S. added the most jobs in 2014 since 1999 with all employment sectors expanding for the first time since the recession. More than half of the U.S. metro areas tracked by Colliers have recovered all of the office-using employment positions lost during the recession. Broader employment growth, both by industry and geographically, is driving demand for office space. >> The North American vacancy rate decreased by 27 basis points (bps) to 12.8% in Q4 2014, driven entirely by improvement in the U.S. market. Vacancy increased in just nine of the 73 U.S. markets reporting Q4 2014 data. The Canadian vacancy rate increased by 40 bps to 8.7% with slower job growth and a relatively higher amount of new supply coming online. >> North American absorption totaled 25.2 million square feet (MSF) during Q4, accounting for nearly one-third of the 2014 annual total of 77.7 MSF of absorption. Absorption in the U.S. CBD and suburban markets reached their highest respective levels since 2006. >> Construction continued to trend upwards reaching nearly 116 MSF in Q4 2014, up from 88 MSF one year earlier. However, development activity remains highly concentrated in a small number of leading markets. The top 10 markets for space under construction account for nearly 60% of total construction in the 87 U.S. and Canadian markets tracked by Colliers. >> U.S. and Canadian office transaction volume reached a post- recession high of $124 billion in 2014, although this was only about half of the peak volume during the last cycle. Investor interest remains highly concentrated in the major gateway cities. However, we expect transaction volume to increase in higher- yielding secondary and tertiary markets in 2015. 2015 Office Market Outlook the Strongest Since the Recession Andrea Cross National Office Research Manager | USA Summary Statistics, Q4 2014 North America Office Market U.S. CANADA NORTH AMERICA Vacancy Rate 13.1% 8.7% 12.8% Change From Q3 2014 (Basis Points) -32 39 -27 Absorption (Million Square Feet) 24.7 0.6 25.2 New Construction (Million Square Feet) 9.4 3.2 12.6 Under Construction (Million Square Feet) 96.2 19.5 115.7 ASKING RENTS (USD/CAD) PER SQUARE FOOT PER YEAR Downtown Class A $45.85 $49.58 Change From Q3 2014 0.4% -0.6% Suburban Class A $27.78 $33.00 Change From Q3 2014 0.6% 2.1% Market Indicators Relative to prior period U.S. Q4 2014 U.S. Q1 2015* CANADA Q4 2014 CANADA Q1 2015* VACANCY NET ABSORPTION CONSTRUCTION RENTAL RATE** Note: Construction is the change in Under Construction. *Projected **Rental rates for current quarter are for CBD. Rent forecast is for metro-wide rents.
- 2. SF By Region Absorption Per Market (SF) q3 '14 - q4 '14 2,200,000 1,100,000 220,000 -220,000 -1,100,000 -2,200,000 2 billion 1 billion 200 mil. Occupied SF Vacant SF 2 North American Research & Forecast Report | Q4 2014 | Office Market Outlook | Colliers International U.S. Economic Trends The U.S. economy fired on nearly all cylinders in 2014, adding the most jobs since 1999. Moreover, the recovery has broadened significantly, both geographically and by industry, compared with earlier in the cycle. All employment sectors added jobs during the year, even the lagging government sector. Federal payrolls continued to shrink, but higher property taxes, sales taxes, development fees and other cyclical forms of revenue enabled state and local governments to add jobs, more than offsetting the federal sector contraction. All states and most metro areas added jobs in 2014, even those without significant concentrations of the leading tech and energy sectors. The office-using employment recovery gained steam in 2014 as well, with office-using employment growth accelerating to the low 3% range by year-end. The primary office-using sectors accounted for nearly 30% of all jobs added nationally during 2014, despite accounting for less than 22% of all jobs. The office sectors are ahead of the recovery in total employment, having recovered about 1.4 jobs for every 1.0 lost during the recession. In all employment sectors, less than 1.3 jobs have been recovered for each 1.0 job lost. The office employment recovery remains bifurcated, driven primarily by the professional and business services sector, which includes many technology, engineering, consulting and other knowledge- based employment categories. This sector has added nearly two jobs for every one lost during the recession. On the other hand, the financial services sector remains far behind in recovery, although growth picked up slightly during 2014. The financial activities sector has added just over 0.5 jobs for every 1.0 lost during the recession, remaining well below the previous peak. Many finance jobs lost Change in Employment From Cyclical Peak - US Office Market | Q4 2012–Q4 2014 | US Office Vacancy, Inventory & Absorption Q4 2014 | North America Note: Latest data as of December 2014; x-axis indicates number of months elapsed since each sector’s previous cyclical employment peak; office-using employment sectors include professional and business services, financial activities and information services; information services not displayed separately because sector peaked in 2001. Sources: Bureau of Labor Statistics, Federal Reserve of St. Louis, Colliers International Source: Colliers International 0.0 0.0 0.0 0.0 0.1 0.2 0.5 0.7 2.1 2.2 3.4 3.5 0.0 0.5 1.0 1.5 2.0 2.5 3.0 3.5 4.0 Ottawa, ON Saskatoon, SK Victoria, BC Waterloo Region, ON Winnipeg, MB Regina, SK Halifax, NS** Edmonton, AB Vancouver, BC Calgary, AB Toronto, ON Montreal, QC 1.0% -1.0% -0.5% 0.0% 0.5% 1.5% 2.0% $0 $50 $100 $150 $200 $250 $300 2007 2008 2009 2010 2011 2012 2013 2014 Bil. Office Transaction Volume - Q4 2014 - NA 12-Month Trailing Volume (left-axis) Year-Over-Year % Change (right-axis) -12% -8% -4% 0% 4% 8% 0 12 24 36 48 60 72 84 96 Months Office-Using Employment Financial Activities Total Employment Professional & Business Services Millions SF 0.0 5.0 10.0 15.0 20.0 25.0 30.0 Q4 Q1 2013 Q2 Q3 Q4 Q1 2014 Q2 Q3 Q4 Vacancy% Absorption MSF Completions MSF Vac Rate (%) 4.0 8.0 12.0 16.0 3.5Toronto, ON N.A. Downtown Markets: Excluding renewals, of the leases signed this quarter in your CBD/downtown, did most tenants: Holding Steady, 61.8% Expand, 20.6% Holding Steady, 61.8% Contract, 17.6% N.A. Downtown Markets: What was the trend for tenant Improvement allowances offered by CBD landlords this quarter? Less, 9.1% Same, 64.9%Same, 64.9% More, 14.3% N/A, 11.7% 14.6 14.5 14.5 14.2 14.0 13.9 13.7 13.5 13.1 0.0
- 3. Top 20 Markets for Office-Using Jobs Recovered December 2014 - US MSA JOBS RECOVERED* MSA JOBS RECOVERED* Austin 5.1:1 Indianapolis 1.9:1 Raleigh 4.1:1 St. Louis 1.8:1 Nashville 3.4:1 Denver 1.8:1 San Francisco 3.2:1 Baltimore 1.7:1 San Jose 2.9:1 Charlotte 1.7:1 Dallas-Fort Worth 2.6:1 Jacksonville 1.6:1 Houston 2.5:1 Cincinnati 1.6:1 Pittsburgh 2.2:1 Columbus 1.5:1 Grand Rapids 2.1:1 Atlanta 1.5:1 Omaha 2.0:1 Boston 1.5:1 UNITED STATES 1.4:1 Fastest Office-Using Employment Growth December 2013-2014 - US MSA % CHANGE MSA % CHANGE Raleigh 9.2% Sacramento 4.3% San Jose 7.7% Inland Empire 4.2% Grand Rapids 7.3% Phoenix 4.2% Dallas-Fort Worth 6.1% Houston 4.1% San Francisco 5.7% Austin 4.0% Fort Lauderdale 5.1% Miami 3.9% San Diego 5.1% Cincinnati 3.7% Richmond 4.9% Birmingham 3.7% Jacksonville 4.9% Indianapolis 3.6% Nashville 4.6% Kansas City 3.5% UNITED STATES 3.0% Markets With Financial Activities Employment At or Above Pre-Recession Peak December 2014 - US MSA JOBS RECOVERED* MSA JOBS RECOVERED* St. Louis 4.1:1 Richmond 1.4:1 Dallas-Fort Worth 4.1:1 Cincinnati 1.4:1 Nashville 3.5:1 Birmingham 1.2:1 Omaha 3.1:1 Jacksonville 1.2:1 Austin 2.4:1 Houston 1.2:1 Pittsburgh 1.7:1 Kansas City 1.0:1 Phoenix 1.5:1 Raleigh 1.0:1 UNITED STATES 0.5:1 * Number of Jobs Recovered Per One Lost During Recession Note: All data are seasonally adjusted as of December 2014; rankings include markets tracked by Colliers with at least 100,000 office-using jobs or 25,000 financial activities jobs as of December 2014 Sources: Bureau of Labor Statistics, Federal Reserve of St. Louis, Colliers International 3 North American Research & Forecast Report | Q4 2014 | Office Market Outlook | Colliers International during the recession were housing bubble-related positions that will not come back during this cycle. In addition, many financial firms have struggled with an uncertain regulatory environment and cost constraints, resulting in their reluctance to increase lending activities and add to payrolls. Thus, financial activities employment is likely to remain well below peak levels through 2015. However, significant regional variations exist. The financial activities recovery remains weak in many traditional, higher-cost finance centers such as Los Angeles, Chicago and San Francisco, but some lower-cost markets in the Sunbelt, Midwest and Mountain regions already have recovered all of the finance jobs lost during the recession. Metro areas with large concentrations of tech, energy, education and healthcare employment remain furthest along in the recovery with markets such as Austin, Raleigh-Durham, Nashville, San Francisco, Silicon Valley and Dallas-Fort Worth far outpacing the U.S. office-using employment recovery. However, a number of lagging Sunbelt markets hit particularly hard by the housing market collapse were among the strongest markets for office-using employment growth in 2014, indicating how broad the recovery has become. Fort Lauderdale, San Diego, Jacksonville, Sacramento, the Inland Empire and Phoenix all posted office-using employment growth of at least 4% during the year, compared with 3% growth nationally. More than half of the 84 metro areas tracked by Colliers have recovered all of the office-using employment positions lost during the recession. The plunge in oil prices since mid-2014 remains a localized but significant risk in some markets. Although a net positive for the U.S. economy, the 50% drop in oil prices since mid-2014 is a negative for metro areas and states with a large amount of related activity, such as Houston, Oklahoma and North Dakota. In addition to firms directly involved in energy extraction and production activities, support services, such as legal and accounting, as well as industries that have benefited from the robust economic growth driven by the energy industry, such as housing and retail trade, are poised to feel the impact as well. The outlook remains uncertain, particularly given the global nature of the oil marketplace. However, with oil prices currently below the breakeven price for most shale oil plays, many of these markets already are feeling the impact in the form of sharply lower rig counts, layoffs, slower leasing activity and an up-tick in the amount of sublease space coming to market. Despite the potential negative economic impact of sustained, depressed oil prices on select areas, the overall U.S. economic outlook for 2015 remains bright. IHS Global Insight projects 3.0% growth in real GDP this year, which is the fastest rate since 2005. Job growth once again should reach rates last achieved during the late 1990s with more than 3 million positions added during the year. These favorable demand trends contribute to our positive outlook for the overall U.S. office market in 2015.
- 4. In Brief: Office Outlook 2015 | Behind The Statistics & Beyond The Basics Scope of Colliers’ Office Outlook Report: Colliers’ office space universe encompasses 87 markets in the U.S. and Canada with a combined total of more than 6.4 billion square feet (BSF). The 75 U.S. markets account for most of this space, with nearly 6.0 BSF of tracked inventory and the remaining 452 MSF in Canada. Our coverage includes 21 markets with more than 100 MSF of space with a combined total of 3.8 BSF or nearly 60% of our office market inventory. The largest U.S. markets are New York, Washington, D.C., Chicago, Dallas and Atlanta. Toronto is the only Canadian market with more than 100 MSF of space. Vacancy The North American vacancy rate decreased by 27 bps in Q4 2014 to 12.8%, driven by stronger office-using employment growth and still-low levels of new supply in the U.S. The U.S. vacancy rate decreased by 32 bps to 13.1% as all U.S. regions posted vacancy rate declines, led by the West with a 46 bps decrease to 13.3%. The Northeast remained the tightest U.S. region and was the only region with a sub-13% vacancy rate at 12.9%. The U.S. vacancy rate is now at the lowest level since Q1 2008 and should drop below 13% this year. Of the 73 U.S. markets reporting both Q3 2014 and Q4 2014 data, just nine posted quarterly increases in vacancy, reflecting how broad the office market recovery has become. In addition, a wide range of markets in terms of size, geography and economic drivers led the list of metro areas with the largest vacancy decreases in Q4 2014. Knowledge-driven economies including Raleigh-Durham and Silicon Valley ranked high, as did markets benefiting from spillover tenant demand such as the Oakland and Pleasanton/Tri- Valley markets located east of the pricier San Francisco and Silicon Valley markets. Tech tenant demand in high-cost cities like San Francisco, New York and Boston has driven up rents to levels that other occupiers such as financial services firms and non-profits are unwilling or unable to pay, benefiting lower-cost office markets in adjacent metro areas or other states. Former housing bust markets including the Inland Empire, Orange County, Jacksonville and Los Angeles also are starting to benefit from stronger office-using employment growth, resulting in substantial vacancy declines in those markets as well. Canada’s vacancy rate increased modestly during Q4 2014 but remained well below the U.S. vacancy rate at 8.7%. Weaker job growth and a growing amount of new supply coming online have contributed to vacancy increases in recent quarters. Of the 11 Canadian markets reporting both Q3 2014 and Q4 2014 data, six posted vacancy rate increases during the quarter. The small 4 North American Research & Forecast Report | Q4 2014 | Office Market Outlook | Colliers International4 Canada Economic Trends The Canadian economic outlook weakened in recent months with downward revisions to employment numbers and the negative impact of falling oil prices. Statistics Canada, the federal government’s statistical agency, recently announced that one-third fewer jobs were added during 2014 than were originally reported, contributing to the Bank of Canada’s decision to lower interest rates for the first time since 2010. Job growth has slowed sharply during the last few years, from about 312,000 jobs gained in 2012 to roughly 121,000 positions added in 2014. Also, unlike in the U.S., the decline in oil prices is generally considered a net negative for the Canadian economy and already has started to impact energy- producing regions, particularly Alberta. Federal government cutbacks also are negatively affecting the economy, especially Ottawa, a trend that likely will be exacerbated by further declines in oil production. Sources: OECD, Federal Reserve of St. Louis, Colliers International Canada Employed Population - Annual % Change -332.7 -159.7 -78.0 -57.2 -41.7 -38.9 -15.8 9.6 10.1 30.9 87.3 327.5 -400.0-300.0-20 0.0-100.0 0.0 100.0 200.0300.0400.0 Thousands SF Calgary, AB Halifax, NS** Saskatoon, SK Edmonton, AB Ottawa, ON Victoria, BC Regina, SK Waterloo Region, ON Vancouver, BC Winnipeg, MB Toronto, ON Montreal, QC -3% -2% -1% 0% 1% 2% 3% Canada Employed Population - Annual % Change 2005 2006 2007 2008 2009 2010 2011 2012 2013 2014 $0 $5 $10 $15 $20 $25 Bil. Cross-Border Investment - North America United States Canada 0 50 100 150 200 250 300 2000 2001 2002 2003 2004 2005 2006 2007 2008 2009 2010 2011 2012 2013 2014 Moody's/RCA Commercial Property Price Indices Non-Major Market-Suburban Major Market-CBD Non-Major Market-CBD Major Market-Suburban Pricing recovery from recession: Major Market-CBD 144.7% Non-Major Market-CBD 101.1% Major Market-Suburban 64.0% Non-Major Market-Suburban 45.8% 2001 2002 2003 2004 2005 2006 2007 2008 2009 2010 2011 2012 2013 2014 As a result of these trends, the Conference Board of Canada has lowered its GDP forecast by one-half percentage point since the fall of 2014 to 1.9% in 2015, a deceleration from 2.4% growth in 2014. Economic output in the Alberta and the Newfoundland and Labrador provinces, both of which contain a significant amount of natural resource production, is projected to shrink this year with Alberta posting the larger decrease of about 1.5%. However, while the provinces and cities with large concentrations of energy employment and the federal government face significant challenges this year, other markets such as Toronto and Vancouver should fare better due to steady demand from technology companies, as well as international firms opening offices or expanding in these cities. The Conference Board projects that economic growth in British Columbia, Manitoba and Ontario will approach 3% this year.
- 5. Top Markets for Absorption Q4 2014 - North America MARKET ABSORPTION (MSF) Houston, TX 2.18 St. Louis, MO 1.32 Raleigh/Durham/Chapel Hill, NC 1.18 Los Angeles, CA 1.05 Phoenix, AZ 1.03 Boston, MA 0.97 Atlanta, GA 0.94 NYC - Midtown South 0.93 Philadelphia, PA 0.91 San Jose - Silicon Valley, CA 0.88 Largest Q-o-Q Decrease in Overall Vacancy Rate Q4 2014 - North America MARKET VACANCY RATE Q3 2014 VACANCY RATE Q4 2014 BASIS-POINT CHANGE Stamford, CT 20.0% 18.1% -189 Oakland, CA 14.3% 12.4% -187 St. Louis, MO 12.5% 10.7% -175 Savannah, GA 19.3% 17.7% -155 Los Angeles - Inland Empire, CA 18.4% 17.0% -137 Raleigh/Durham/ Chapel Hill, NC 11.0% 9.9% -116 Bakersfield, CA 7.4% 6.2% -116 Orange County, CA 15.2% 14.1% -107 Jacksonville, FL 12.3% 11.3% -105 San Jose - Silicon Valley, CA 9.8% 8.8% -96 North America 13.1% 12.8% -27 Lowest Overall Vacancy Rates Q4 2014 - North America MARKET VACANCY MARKET VACANCY Bakersfield, CA 6.2% NYC - Midtown South 7.9% Toronto, ON 7.3% Pittsburgh, PA 8.1% Winnipeg, MB 7.4% Nashville, TN 8.4% Montréal, QC 7.4% Portland, OR 8.5% San Francisco, CA 7.5% San Jose - Silicon Valley 8.8% North America 12.8% Source: Colliers International 5 North American Research & Forecast Report | Q4 2014 | Office Market Outlook | Colliers International Saskatoon market posted nearly a four percentage-point increase in vacancy during the quarter, impacted by a slowdown in demand from tenants engaged in natural resource production. The next-largest increases in vacancy occurred in Ottawa and Toronto, the Canadian metro areas with the most new supply delivered in Q4 2014. Absorption & Tenant Demand Like the overall U.S. economy, office absorption finished 2014 on a high note. The U.S. and Canada recorded a combined 25.2 MSF of absorption during Q4, accounting for nearly one-third of the 2014 North American annual total of 77.7 MSF of absorption. The U.S. accounted for a disproportionately large share of absorption, representing 98% of combined U.S. and Canadian absorption in both Q4 and 2014 despite accounting for only 93% of inventory. Within the U.S., the South and the West accounted for an outsized share of absorption relative to their respective shares of total inventory. Absorption in the overall U.S. office market hit the highest level since 2006. Although urban gateway cities have garnered the most attention thus far in the cycle, both CBD and suburban markets posted significant absorption during the year with both reaching their highest respective levels since 2006 as well. Top markets for absorption generally were tech- and energy-driven metro areas including Houston, Boston, Midtown South Manhattan and San Francisco. However, recovering Sunbelt markets including Atlanta and Phoenix also ranked high for absorption in 2014, reflecting positive economic trends and the migration to and expansions by firms in these markets. Demand from tech and other creative tenants, especially in urban live/work/play areas and traditional tech enclaves appealing to current and prospective employees, showed little sign of a slowdown in 2014 and into early 2015. Several large leases were signed by creative firms in New York in recent months, including Amazon’s first major Manhattan office lease for 470,000 square feet in Herald Square, an expansion by AMC Networks for 330,000 square feet at Penn Plaza and 194,000 square feet by Buzzfeed in the robust Midtown South submarket. Reflecting strong demand for an urban environment, GSN Games announced plans to move its Boston office from suburban Waltham to Downtown Boston in order to attract top talent. Also in Boston, CVS plans to open a digital innovation office to benefit from proximity to both the medical and tech communities, relocating some employees from the pharmacy company’s suburban headquarters in Rhode Island and hiring additional employees during the next few years. Other major leases by technology firms included SpaceX’s announcement of a planned office in Seattle’s Eastside submarket with up to 1,000 employees focused on satellite technologies to capitalize on the area’s deep technology and aerospace talent base. Also in Seattle, Facebook will substantially increase its local footprint with a recent lease at the new Dexter Station project in tech hub South Lake Union, enabling the firm to increase its local workforce four-fold during the next few years to up to 2,000 employees. Indicative of the strength of the Silicon Valley office market, ServiceNow recently leased the entire 328,000 square-foot Campus at Lawson Lane in Santa Clara, a project that commenced
- 6. North American Downtown Markets: Excluding renewals, of the leases signed this quarter in your CBD/downtown, did most tenants: North American Downtown Markets: What was the trend in Free Rent (in months) offered by CBD landlords this quarter? North American Downtown Markets: What was the trend for Tenant Improvement allowances offered by CBD landlords this quarter? North American Suburban Markets: Excluding renewals, of the leases signed this quarter in your suburban market, did most tenants: Source: Colliers International 0.0 5.0 10.0 15.0 20.0 25.0 30.0 Q4 Q1 2013 Q2 Q3 Q4 Q1 2014 Q2 Q3 Q4 Absorption MSF Completions MSF Vac Rate (%) 4.0 8.0 12.0 16.0 0.0 0.0 0.0 0.1 0.2 0.5 0.7 2.1 2.2 3.4 3.5 Saskatoon, SK Victoria, BC Waterloo Region, ON Winnipeg, MB Regina, SK Halifax, NS** Edmonton, AB Vancouver, BC Calgary, AB Toronto, ON Montreal, QC N.A. Downtown Markets: Excluding renewals, of the leases signed this quarter in your CBD/downtown, did most tenants: Holding Steady, 61.8% Expand, 20.6% Holding Steady, 61.8% Contract, 17.6% N.A. Downtown Markets: What was the trend for tenant Improvement allowances offered by CBD landlords this quarter? Less, 9.1% Same, 64.9%Same, 64.9% More, 14.3% N/A, 11.7% 14.6 14.5 14.5 14.2 14.0 13.9 13.7 13.5 13.1 0.0 0.0 5.0 10.0 15.0 20.0 25.0 30.0 Q4 Q1 2013 Q2 Q3 Q4 Q1 2014 Q2 Q3 Q4 Vacancy% Absorption MSF Completions MSF Vac Rate (%) 4.0 8.0 12.0 16.0 -332.7 -159.7 -78.0 -57.2 -41.7 -38.9 -15.8 9.6 10.1 30.9 87.3 327.5 -400.0-300.0-20 0.0-100.0 0.0 100.0 200.0300.0400.0 Thousands SF Calgary, AB Halifax, NS** Saskatoon, SK Edmonton, AB Ottawa, ON Victoria, BC Regina, SK Waterloo Region, ON Vancouver, BC Winnipeg, MB Toronto, ON Montreal, QC N.A. Downtown Markets: Excluding renewals, of the leases signed this quarter in your CBD/downtown, did most tenants: N.A. Downtown Markets: What was the trend in Free Rent (in months) offered by CBD landlords this quarter? Holding Steady, 61.8% Expand, 20.6% Holding Steady, 61.8% Contract, 17.6% Less, 15.6% More, 10.4% N/A, 11.7% Same, 62.3%Same, 62.3% N.A. Downtown Markets: What was the trend for tenant Improvement allowances offered by CBD landlords this quarter? N.A. Suburban Markets: Excluding renewals, of the leases signed this quarter in your suburban market, did most tenants: Expand, 26.0% Holding Steady, 50.6% Holding Steady, 50.6% Contract, 14.3% N/A, 9.1% Less, 9.1% Same, 64.9%Same, 64.9% More, 14.3% N/A, 11.7% 14.6 14.5 14.5 14.2 14.0 13.9 13.7 13.5 13.1 0.0 0.0 5.0 10.0 15.0 20.0 25.0 30.0 Q4 Q1 2013 Q2 Q3 Q4 Q1 2014 Q2 Q3 Q4 Vacancy% Absorption MSF Completions MSF Vac Rate (%) 4.0 8.0 12.0 16.0 N.A. Downtown Markets: Excluding renewals, of the leases signed this quarter in your CBD/downtown, did most tenants: Holding Steady, 61.8% Expand, 20.6% Holding Steady, 61.8% Contract, 17.6% N.A. Downtown Markets: What was the trend for tenant Improvement allowances offered by CBD landlords this quarter? Less, 9.1% Same, 64.9%Same, 64.9% More, 14.3% N/A, 11.7% 14.6 14.5 14.5 14.2 14.0 13.9 13.7 13.5 13.1 0.0 327.5Toronto, ON N.A. Downtown Markets: Excluding renewals, of the leases signed this quarter in your CBD/downtown, did most tenants: N.A. Downtown Markets: What was the trend in Free Rent (in months) offered by CBD landlords this quarter? Holding Steady, 61.8% Expand, 20.6% Holding Steady, 61.8% Contract, 17.6% Less, 15.6% More, 10.4% N/A, 11.7% Same, 62.3%Same, 62.3% N.A. Downtown Markets: What was the trend for tenant Improvement allowances offered by CBD landlords this quarter? N.A. Suburban Markets: Excluding renewals, of the leases signed this quarter in your suburban market, did most tenants: Expand, 26.0% Holding Steady, 50.6% Holding Steady, 50.6% Contract, 14.3% N/A, 9.1% Less, 9.1% Same, 64.9%Same, 64.9% More, 14.3% N/A, 11.7% 6 North American Research & Forecast Report | Q4 2014 | Office Market Outlook | Colliers International construction before the recession, was put on hold in 2008 and has sat vacant since its completion in 2012. Non-tech firms continue to open innovation offices in tech markets across the country, such as Best Buy’s recent announcement of a planned technology office in Seattle’s South Lake Union several blocks from Amazon’s headquarters, Capital One’s innovation center in San Francisco and the McDonald’s digital strategy team’s new lease in Chicago’s tech-heavy River North submarket. Markets and submarkets adjacent to leading tech centers continue to benefit from a lack of available and/or affordable space in prime areas. For example, demand has been growing for space in West Los Angeles’ Playa Vista, Culver City and El Segundo/Beach Cities submarkets due to a shortage of space and high rents in Santa Monica to the north. Google is poised to substantially increase its Los Angeles presence with its recent purchase of 12 acres in Playa Vista that are zoned for about 900,000 square feet of commercial space. Also, Yahoo recently decided to move its Westside operations from Santa Monica to Tishman Speyer’s The Collective at Playa Vista, which is scheduled to deliver in mid-2015. Lower-cost markets in the South, Midwest and Mountain regions continue to attract firms from higher-cost areas. Mercedes-Benz recently announced plans to relocate its U.S. headquarters from New Jersey to Atlanta’s Central Perimeter submarket in 2017 in the latest example of an auto manufacturer moving its corporate office from a Northern city to the Southeast in closer proximity to its manufacturing facilities. In a cost-savings move, coffee company Farmer Brothers plans to sell its headquarters in Torrance, CA in Los Angeles County and relocate to either Dallas-Fort Worth or Oklahoma City. On the heels of Sedgwick’s 2014 announcement that it would move 275 administrative positions to Kansas City, another San Francisco- based law firm, Littler Mendelson announced in early 2015 that it will relocate 100 back-office positions to Kansas City, reflecting the trend of companies dividing functions into the lowest-cost locations that also provide access to qualified talent. This trend is occurring with tech companies as well. Cloud-based HR service Zenefits is the latest Bay Area-based tech company to announce an expansion into the Phoenix market, leasing 100,000 square feet in Scottsdale with plans to add 1,300 employees in the area during the next three years. The space efficiency trend has contributed to a slower recovery during this cycle relative to the amount of job creation activity as tenants across both the public and private sectors are using less space per employee. This is a long-term trend that will continue to impact the office market through this cycle and beyond as leases roll. In the public sector, the General Services Administration (GSA) has focused on extending leases through short-term deals over the last few years and now is faced with half of its leases rolling over during the next five years. As one of the most aggressive downsizers in terms of space usage, densification across the GSA’s portfolio will impact the Washington, DC market as well as other markets with a significant federal government presence. The GSA has been consolidating employees in modern properties capable of handling dense configurations, and thus older, less adaptable buildings could struggle to attract and retain federal tenants.
- 7. Source: Colliers International Source: Colliers International 7 North American Research & Forecast Report | Q4 2014 | Office Market Outlook | Colliers International Construction Activity Construction activity increased further in Q4 2014 driven by tightening market conditions and positive economic trends. At year-end, approximately 116 MSF were under construction in the 87 U.S. and Canadian markets tracked by Colliers, which was up from 110 MSF in Q3 2014 and 88 MSF in Q4 2013. The increase is entirely due to the up-tick in activity in the U.S. as Canadian office construction has remained relatively flat at around 20 MSF under construction during the last year. However, the amount of square footage under construction in the U.S. is still about 20% less than the 121 MSF under way in Q2 2008 at the peak of the last development cycle. Construction remains highly concentrated in a small number of leading markets. The top 10 markets for square footage under way at year-end 2014 accounted for nearly 60% of all construction activity in the 87 markets tracked by Colliers, roughly the same proportion as one year earlier. Primarily, these markets are the strongest tech and energy markets that are ahead of the overall office market recovery, including Houston, Silicon Valley, Seattle, San Francisco and Boston. Of the 84 markets reporting Q4 2014 data, 31 markets had 100,000 square feet or less of office construction under way, including 23 markets with no construction under way. This was on par with one year earlier, when 28 of 86 markets reporting Q4 2013 data had 100,000 square feet of space or less under way, including 22 with no office space under construction. Development also remains concentrated in urban areas in response to tenant and employee preferences for a dynamic urban environment. About 41% of space under construction in the markets tracked by Colliers is located in CBD markets, which account for slightly more than one-third of existing inventory. Top Markets for Office Space Under Construction Q4 2014 - North America MARKET CONSTRUCTION (MSF) Houston, TX 17.13 San Jose - Silicon Valley, CA 8.09 Dallas, TX 6.87 Washington DC 6.17 Seattle/Puget Sound, WA 5.98 San Francisco, CA 5.16 Toronto, ON 5.09 Calgary, AB 4.95 Boston, MA 4.56 NYC - Midtown South 4.17 Construction as % of Existing Inventory Q4 2014 - North America MARKET SQUARE FEET UNDERWAY % OF EXISTING INVENTORY San Jose - Silicon Valley, CA 8,086,492 10.8% Edmonton, AB 2,316,868 8.7% Houston, TX 17,134,157 8.0% Calgary, AB 4,950,500 7.4% Vancouver, BC 3,279,952 6.0% San Francisco, CA 5,161,899 5.8% Seattle/Puget Sound, WA 5,983,892 5.3% Regina, SK 224,875 5.0% Stockton, CA 306,000 3.7% Toronto, ON 5,088,689 3.6% North America 115,712,234 1.8% Beyond these leading markets, construction is focused on the strongest markets and submarkets. For example, developers broke ground in late 2014 on the 630,000 square-foot 300 South Tryon office tower in the Charlotte CBD, which had an 8.2% vacancy rate in Q4 2014, 270 bps lower than the overall Charlotte market’s vacancy rate. In Los Angeles, nearly two-third of the space under construction is in Hollywood and West Los Angeles, submarkets with vacancy significantly below the market average and in which local tech and creative demand has been concentrated. On the heels of a string of successful redevelopment projects in Chicago’s Fulton Market area led by the Google-anchored 1K Fulton project, Sterling Bay recently announced plans to complete a building on a purely speculative basis that was partially constructed during the last tech boom. Reflecting the preference for an urban location, Highwood Properties is building an office tower in Nashville’s CBD for Bridgestone Americas, which will relocate from its current headquarters near the airport. The energy sector slowdown has ignited fears regarding the impact of the large amount of recently completed supply and space under construction in several markets, notably Houston and Calgary. These two markets account for nearly 20% of construction under way in the U.S. and Canadian markets that Colliers tracks. Although Q4 statistics indicate relative strength in both markets, we are seeing an increase in available sublease space and concern regarding lease-up of the significant amount of speculative space yet to hit the market, especially in areas such as West Houston/the Energy Corridor and Downtown Calgary that, until recently, were driven by significant energy industry growth. The ultimate impact of this new supply in 2015 hinges on oil prices for which expert predictions vary wildly. However, prices currently are at a level indicating further weakening in markets with large concentrations of oil industry activity, a significant risk as additional new supply comes online. In addition to ground-up construction, interest in repositioning and renovating older office and industrial properties to appeal to modern tenants remains strong. A joint fund of PM Realty Group
- 8. 8 North American Research & Forecast Report | Q4 2014 | Office Market Outlook | Colliers International and Roseview Group is repositioning One CambridgePark Drive to capitalize on strong demand for properties proximate to public transit in the hot Cambridge, MA submarket. In Downtown Los Angeles’ Arts District, GPI Companies and Atlas Capital recently announced plans to transform a Coca-Cola production warehouse into creative office and retail space, the latest in a series of conversions of industrial properties in the area. Also in the Arts District, Shorenstein purchased a former Ford Motor factory in late 2014 for repositioning for creative office and retail use. These types of projects not only offer the type of space favored by many tech tenants, such as large floorplates and windows and high ceilings, but also are breathing new life into aging industrial areas across the country and responding to many younger workers’ preference for an urban live/ work/play environment. Capital Markets & Transaction Activity Investor capital continues to target the perceived safe-haven of North American markets, especially the U.S. Combined U.S. and Canadian transaction volume reached $124 billion in 2014 according to Real Capital Analytics (RCA), although this was only about half the peak 12-month trailing transaction volume of $243 billion in Q3 2007. Capital generally has been focused on major gateway markets as well as property types in greater favor among investors, especially multifamily. The six U.S. “major markets” as defined by RCA accounted for 23 of the 25 largest office transactions in 2014, as well as nearly two-thirds of U.S. office transaction volume during the year. Global economic weakness will likely continue to drive both domestic and foreign investors to U.S. office properties in 2015. According to the Association of Foreign Investors in Real Estate’s (AFIRE) annual survey, the U.S. remains by far the preferred location for foreign investors with 90% of respondents planning to maintain or increase the size of their U.S. portfolios in 2015. The U.S. also was considered the most stable and secure country for investment, as well as offering the best opportunity for capital appreciation by a wide margin over second-place Germany and Spain, respectively. Although gateway assets should continue to be pursued heavily by domestic and foreign investors alike, we expect investors to look beyond these core investments and geographies for greater returns in 2015, particularly as more markets participate in the economic recovery. Markets that posted significant office-using employment gains and absorption in 2014, such as Dallas-Fort Worth, Raleigh- Durham, Nashville, Phoenix and San Diego, will likely increasingly appear on the radar of investors priced out of or unwilling to compete for trophy assets in gateway CBDs. Office Transaction Volume Q4 2014 - North America Moody’s/RCA Commercial Property Price Indices Cross-Border Office Investment North America Note: Latest data as of Q4 2014; all data are 12-month trailing Sources: Real Capital Analytics, Colliers International Note: Latest data as of December 2014 Sources: Real Capital Analytics, Colliers International Note: Data includes cross-border capital flows into each country Source: Real Capital Analytics 0.0 0.0 0.0 0.5 1.0 1.5 2.0 2.5 3.0 3.5 4.0 Ottawa, ON Saskatoon, SK 1.0% -1.0% -0.5% 0.0% 0.5% 1.5% 2.0% $0 $50 $100 $150 $200 $250 $300 2007 2008 2009 2010 2011 2012 2013 2014 Bil. Office Transaction Volume - Q4 2014 - NA 12-Month Trailing Volume (left-axis) Year-Over-Year % Change (right-axis) -12% -8% -4% 0% 4% 8% 0 12 24 36 48 60 72 84 96 Months Office-Using Employment Financial Activities Total Employment Professional & Business Services Millions SF 0.0 0.0 0.0 0.0 0.1 0.2 0.5 0.7 2.1 0.0 0.5 1.0 1.5 2.0 2.5 3.0 3.5 4.0 Ottawa, ON Saskatoon, SK Victoria, BC Waterloo Region, ON Winnipeg, MB Regina, SK Halifax, NS** Edmonton, AB Montreal, QC -3% -2% -1% 0% 1% 2% 2005 2006 2007 2008 2009 2010 2011 2012 2013 2014 1.0% -1.0% -0.5% 0.0% 0.5% 1.5% 2.0% $0 $50 $100 $150 $200 $250 $300 2007 2008 2009 2010 2011 2012 2013 2014 Bil. Office Transaction Volume - Q4 2014 - NA 12-Month Trailing Volume (left-axis) Year-Over-Year % Change (right-axis) $0 $5 $10 $15 $20 $25 Bil. Cross-Border Investment - North America -12% -8% -4% 0% 4% 8% 0 12 24 36 48 60 72 84 96 Months United States Canada 0 50 100 150 200 250 300 2000 2001 2002 2003 2004 2005 2006 2007 2008 2009 2010 2011 2012 2013 2014 Moody's/RCA Commercial Property Price Indices Non-Major Market-Suburban Major Market-CBD Non-Major Market-CBD Major Market-Suburban Office-Using Employment Financial Activities Total Employment Professional & Business Services Millions SF Pricing recovery from recession: Major Market-CBD 144.7% Non-Major Market-CBD 101.1% Major Market-Suburban 64.0% Non-Major Market-Suburban 45.8% 2001 2002 2003 2004 2005 2006 2007 2008 2009 2010 2011 2012 2013 2014 0.0 5.0 10.0 15.0 20.0 25.0 30.0 Q4 Q1 2013 Q2 Q3 Q4 Q1 2014 Q2 Q3 Q4 Vacancy% Absorption MSF Completions MSF Vac Rate (%) 4.0 8.0 12.0 16.0 -332.7 -159.7 -78.0 -57.2 -41.7 -38.9 -15.8 9.6 10.1 30.9 87.3 327.5 -400.0-300.0-20 0.0-100.0 0.0 100.0 200.0300.0400.0 Thousands SF Calgary, AB Halifax, NS** Saskatoon, SK Edmonton, AB Ottawa, ON Victoria, BC Regina, SK Waterloo Region, ON Vancouver, BC Winnipeg, MB Toronto, ON Montreal, QC 0.0 0.0 0.0 0.0 0.1 0.2 0.5 0.7 2.1 2.2 3.4 3.5 0.0 0.5 1.0 1.5 2.0 2.5 3.0 3.5 4.0 Ottawa, ON Saskatoon, SK Victoria, BC Waterloo Region, ON Winnipeg, MB Regina, SK Halifax, NS** Edmonton, AB Vancouver, BC Calgary, AB Toronto, ON Montreal, QC -3% -2% -1% 0% 1% 2% 3% Canada Employed Population - Annual % Change 2005 2006 2007 2008 2009 2010 2011 2012 2013 2014 1.0% -1.0% -0.5% 0.0% 0.5% 1.5% 2.0% $0 $50 $100 $150 $200 $250 $300 2007 2008 2009 2010 2011 2012 2013 2014 Bil. Office Transaction Volume - Q4 2014 - NA 12-Month Trailing Volume (left-axis) Year-Over-Year % Change (right-axis) $0 $5 $10 $15 $20 $25 Bil. Cross-Border Investment - North America -4% 0% 4% 8% United States Canada 100 150 200 250 300 Moody's/RCA Commercial Property Price Indices Millions SF Expand, 26.0% Holding Steady, 50.6% Holding Steady, 50.6% Contract, 14.3% N/A, 9.1% Less, 9.1% Same, 64.9%Same, 64.9% More, 14.3% N/A, 11.7% 14.6 14.5 14.5 14.2 14.0 13.9 13.7 13.5 13.1 0.0 Pricing recovery from recession: Major Market-CBD 144.7% Non-Major Market-CBD 101.1% Major Market-Suburban 64.0% Non-Major Market-Suburban 45.8% 2001 2002 2003 2004 2005 2006 2007 2008 2009 2010 2011 2012 2013 2014
- 9. 9 North American Research & Forecast Report | Q4 2014 | Office Market Outlook | Colliers International Outlook The U.S. and Canadian office markets are at different points in the office market cycle and heading in opposite directions. Whereas the U.S. markets generally are expected to post further occupancy and rent gains as well as positive absorption in Q1 2015, we expect negative absorption as well as rent and occupancy declines in the Canadian markets. Construction will likely continue to tick up in the U.S. in line with strengthening tenant demand and a lack of either a particular type or large block of space, or space in a specific market or submarket. However, with the relatively slow pace of recovery and still-elevated vacancy rate, construction financing remains prudent at this point in the cycle, limiting supply-side risk in most markets. The greatest risk to the outlook in 2015 is the energy industry, which faces considerable uncertainty, as well as a large amount of supply set to come online in the major oil-driven markets. However, this risk is confined to a handful of markets, with the majority of U.S. markets in the sweet spot in terms of strengthening tenant demand and still-low levels of construction activity. We expect transaction volume to increase further in 2015 due to the influx of both foreign and domestic capital sources, as well as investors becoming increasingly confident in the broadening of the economic and office market recoveries. Given these positive economic trends, the Fed will likely begin raising interest rates this year, but at a measured pace. Cap rate-to-Treasury spreads remain wide relative to pre-recession levels, and property types and geographies that have been in less favor up to this point in the recovery offer particularly attractive risk-adjusted returns, which should drive investor interest to these properties and markets as interest rates finally begin to increase.
- 10. 10 North American Research & Forecast Report | Q4 2014 | Office Market Outlook | Colliers International United States - Downtown - All Classes MARKET EXISTING INVENTORY (SF) DEC 31, 2014 NEW SUPPLY Q4 2014 (SF) YTD NEW SUPPLY 2014 (SF) UNDER CONSTRUCTION (SF) VACANCY RATE SEP 30, 2014 VACANCY RATE DEC 31, 2014 ABSORPTION Q4 2014 (SF) YTD ABSORPTION 2014 (SF) NORTHEAST Baltimore, MD 28,739,849 0 0 0 12.6% 13.2% -174,952 -461,120 Boston, MA 63,067,146 218,000 1,268,000 2,230,687 11.3% 10.9% 432,080 1,769,179 Hartford, CT 9,971,800 0 0 0 15.0% 14.1% 82,346 -47,449 NYC - Downtown 110,938,458 0 2,861,402 2,800,000 12.2% 11.7% 514,032 4,236,614 NYC - Midtown 230,068,701 0 0 589,237 10.6% 10.7% -312,293 1,197,671 NYC - Midtown South 162,245,367 0 894,672 4,170,000 8.5% 7.9% 929,487 3,007,280 Philadelphia, PA 42,524,540 0 0 1,958,682 11.5% 10.7% 328,503 382,988 Pittsburgh, PA 32,445,986 370,643 370,643 959,246 9.6% 9.2% 435,321 487,948 Stamford, CT 18,854,932 0 0 0 20.0% 18.1% 356,754 504,597 Washington, DC 143,941,041 27,761 1,106,859 2,454,278 11.1% 10.6% 142,458 -510,955 White Plains, NY 7,682,399 0 0 0 14.7% 14.1% 49,142 38,928 Northeast Total 850,480,219 616,404 6,501,576 15,162,130 10.9% 10.6% 2,782,878 10,605,681 SOUTH Atlanta, GA 50,085,634 0 557,122 0 16.7% 16.1% 274,301 784,659 Birmingham, AL 4,907,532 0 0 0 21.3% 21.3% 9,796 350,272 Charleston, SC 2,252,548 0 0 21,000 8.6% 8.1% 11,231 24,203 Charlotte, NC 22,511,927 0 0 0 8.7% 8.2% 120,024 278,436 Columbia, SC 4,678,427 0 0 0 10.8% 9.8% 45,916 57,295 Dallas, TX 32,674,440 0 0 450,000 22.2% 22.0% 41,888 879,044 Ft. Lauderdale-Broward, FL 7,685,941 0 0 0 11.2% 11.0% 19,015 224,196 Ft. Worth, TX 10,202,776 0 75,971 0 15.7% 15.1% 66,850 272,795 Greenville, SC 3,342,131 0 0 0 16.3% 16.7% -13,658 42,928 Houston, TX 41,936,661 0 0 1,532,668 10.9% 9.8% 439,266 814,010 Jacksonville, FL 15,572,544 0 0 0 15.5% 14.1% 221,844 -112,684 Little Rock, AR 6,898,998 0 0 0 7.4% 6.8% 12,472 15,802 Louisville, KY 43,958,885 0 474,683 105,000 10.6% 10.5% 78,147 467,680 Memphis, TN 5,462,083 0 0 0 15.4% 15.3% 1,502 168,938 Miami-Dade, FL 18,756,053 0 0 264,199 16.7% 16.6% 21,936 222,983 Nashville, TN 13,151,106 0 0 0 11.5% 11.6% -15,622 138,590 Orlando, FL 12,327,043 0 0 17,124 12.7% 12.6% 14,459 -97,069 Raleigh/Durham/ Chapel Hill, NC 14,414,027 0 574,279 242,969 5.8% 4.8% 143,552 626,791 Richmond, VA 16,342,909 0 106,662 321,500 9.8% 9.9% -19,675 243,399 Savannah, GA 803,516 0 0 0 13.5% 12.8% 5,469 8,990 Tampa Bay, FL 6,782,814 0 0 0 14.6% 14.8% -15,444 61,603 West Palm Beach/ Palm Beach County, FL 11,539,346 0 0 0 13.6% 13.6% -3,030 174,223 South Total 346,287,341 0 1,788,717 2,954,460 13.5% 13.0% 1,460,239 5,647,084
- 11. 11 North American Research & Forecast Report | Q4 2014 | Office Market Outlook | Colliers International11 United States - Downtown - All Classes MARKET EXISTING INVENTORY (SF) DEC 31, 2014 NEW SUPPLY Q4 2014 (SF) YTD NEW SUPPLY 2014 (SF) UNDER CONSTRUCTION (SF) VACANCY RATE SEP 30, 2014 VACANCY RATE DEC 31, 2014 ABSORPTION Q4 2014 (SF) YTD ABSORPTION 2014 (SF) MIDWEST Chicago, IL 157,655,448 0 0 1,073,100 12.0% 11.9% 183,427 1,096,601 Cincinnati, OH 18,749,613 0 0 600,000 15.2% 15.1% 27,896 25,330 Cleveland, OH 32,850,659 0 0 0 17.0% 17.1% -16,566 131,855 Columbus, OH 19,792,521 340,000 340,000 150,000 9.5% 9.4% 335,658 673,566 Detroit, MI 26,498,989 0 0 0 17.0% 16.6% 169,095 553,061 Grand Rapids, MI 5,314,801 0 0 135,000 15.6% 15.7% -2,530 98,406 Indianapolis, IN 22,548,402 0 0 0 9.6% 9.5% 16,730 -79,803 Kansas City, MO 34,527,395 0 0 0 13.4% 12.9% 165,462 547,004 Milwaukee, WI 18,855,760 0 42,000 358,000 10.9% 10.4% 99,854 211,907 Minneapolis, MN 31,441,249 0 0 1,612,000 12.4% 12.2% 41,857 260,192 Omaha, NE 6,454,376 0 0 0 6.9% 5.9% 65,355 66,240 St. Louis, MO 23,216,158 0 0 0 19.5% 15.9% 845,124 523,913 St. Paul, MN 11,730,218 0 0 0 13.5% 13.3% 21,479 -56,875 Midwest Total 409,635,589 340,000 382,000 3,928,100 13.2% 12.8% 1,952,841 4,051,397 WEST Albuquerque, NM 3,191,080 0 0 0 26.1% 24.9% 39,001 107,434 Bakersfield, CA 3,307,449 0 72,283 0 8.4% 7.1% 46,905 116,176 Boise, ID 4,177,362 0 0 466,022 14.6% 14.4% 9,771 -254,308 Denver, CO 34,538,538 123,000 442,954 1,017,695 11.0% 10.7% 237,643 925,329 Fresno, CA 3,288,944 0 0 0 11.2% 11.9% -23,275 -78,437 Honolulu, HI 7,164,686 0 0 0 14.7% 14.2% 33,949 -40,065 Las Vegas, NV 5,018,065 0 49,200 129,000 10.9% 11.3% -23,174 119,890 Los Angeles, CA 32,258,544 0 0 464,340 20.0% 19.5% 174,900 -111,000 Oakland, CA 17,255,313 0 0 0 11.0% 9.0% 360,074 448,318 Phoenix, AZ 20,826,196 0 0 0 21.1% 20.8% 70,021 40,081 Portland, OR 34,640,385 0 0 406,383 9.1% 8.6% 168,074 405,289 Reno, NV 3,342,955 0 0 0 14.0% 14.4% -13,002 1,287 Sacramento, CA 14,648,840 0 0 0 11.8% 11.2% 80,584 220,543 San Diego, CA 10,172,525 0 0 320,000 18.5% 18.4% 11,263 -281 San Francisco, CA 89,580,305 307,235 1,557,396 5,161,899 7.5% 7.5% 257,443 2,800,269 San Jose - Silicon Valley, CA 8,300,436 0 0 0 15.5% 15.1% -109,121 109,922 Seattle/Puget Sound, WA 56,099,584 380,000 500,000 4,617,199 10.8% 10.8% 341,326 889,901 Stockton, CA 8,221,819 0 0 306,000 14.1% 14.1% 744 169,751 Walnut Creek, CA 12,346,542 0 0 0 16.5% 15.9% 83,107 19,537 West Total 368,379,568 810,235 2,621,833 12,888,538 12.1% 11.8% 1,746,233 5,889,636 U.S. TOTALS 1,974,782,717 1,766,639 11,294,126 34,933,228 12.0% 11.7% 7,942,191 26,193,798 (continued)
- 12. 12 North American Research & Forecast Report | Q4 2014 | Office Market Outlook | Colliers International United States - Downtown - Class A MARKET EXISTING INVENTORY (SF) DEC 31, 2014 AVG ANNUAL QUOTED RENT (USD PSF) DEC 31, 2014 VACANCY RATE SEP 30, 2014 VACANCY RATE DEC 31, 2014 ABSORPTION Q4 2014 (SF) YTD ABSORPTION 2014 (SF) QUARTERLY CHANGE IN RENT ANNUAL CHANGE IN RENT NORTHEAST Baltimore, MD 12,819,952 $21.26 11.4% 13.2% -168,216 53,152 -2.3% -1.1% Boston, MA 44,102,537 $50.98 12.5% 10.9% 453,605 1,674,450 1.3% 3.1% Hartford, CT 6,771,455 $22.50 16.5% 14.1% 55,952 -227,856 8.5% 15.7% NYC - Downtown 80,463,304 $54.10 13.5% 11.7% 155,498 3,477,850 0.3% 4.8% NYC - Midtown 197,217,338 $76.65 11.0% 10.7% -537,659 1,090,756 -1.3% 7.6% NYC - Midtown South 34,311,898 $70.82 8.4% 7.9% 696,581 2,109,821 7.3% 9.8% Philadelphia, PA 30,262,665 $28.45 11.3% 10.7% 296,371 361,128 0.5% 6.4% Pittsburgh, PA 17,820,982 $25.94 6.8% 9.2% 84,020 62,132 -1.2% 3.5% Stamford, CT 13,443,447 $39.28 20.4% 18.1% 338,035 491,884 1.2% 2.6% Washington, DC 89,349,089 $54.53 11.9% 10.6% 102,234 637,072 -0.1% 3.2% White Plains, NY 4,737,732 $32.09 16.6% 14.1% 30,855 38,514 1.6% -0.5% Northeast Total 531,300,399 $59.19 11.7% 10.6% 1,507,276 9,768,903 0.1% 6.2% SOUTH Atlanta, GA 30,988,181 $22.16 19.0% 16.1% 246,727 646,654 1.7% 1.0% Birmingham, AL 3,951,421 $21.06 15.9% 21.3% 13,825 370,283 0.2% 0.5% Charleston, SC 1,009,994 $33.43 7.7% 8.1% -1,901 12,863 -0.1% -1.1% Charlotte, NC 15,945,673 $25.16 9.0% 8.2% 131,978 326,688 1.9% 1.0% Columbia, SC 2,131,068 $21.38 10.7% 9.8% 2,474 -37,735 0.5% 2.6% Dallas, TX 22,640,149 $23.05 23.2% 22.0% 3,803 701,320 0.7% 2.0% Ft. Lauderdale-Broward, FL 4,428,063 $34.29 14.0% 11.0% 7,624 215,240 0.6% 7.1% Ft. Worth, TX 5,914,246 $28.90 17.5% 15.1% -27,206 29,432 0.0% -1.2% Greenville, SC 2,070,167 $22.61 16.1% 16.7% -17,741 33,623 1.4% 13.8% Houston, TX 30,286,336 $42.01 9.9% 9.8% 415,004 649,071 -0.8% 10.1% Jacksonville, FL 6,846,824 $20.31 18.8% 14.1% 60,182 -309,489 0.7% 2.4% Little Rock, AR 3,051,886 $15.65 8.7% 6.8% 10,548 15,103 -2.1% -5.6% Louisville, KY 10,876,690 $20.40 10.6% 10.5% 261 353,319 -0.7% -1.1% Memphis, TN 2,026,788 $17.32 22.5% 15.3% 11,754 105,216 0.9% -1.4% Miami-Dade, FL 9,817,567 $40.49 17.3% 16.6% 130,206 259,360 -0.4% 0.6% Nashville, TN 4,420,902 $23.63 9.1% 11.6% -10,189 59,973 -0.3% 8.2% Orlando, FL 5,759,214 $24.71 14.0% 12.6% -12,834 -96,147 -1.1% 1.4% Raleigh/Durham/ Chapel Hill, NC 7,230,215 $26.35 6.0% 4.8% 85,885 319,580 -0.6% 9.7% Richmond, VA 6,356,115 $23.86 7.7% 9.9% -15,878 128,473 -2.7% -3.3% Savannah, GA 645,713 $21.31 8.0% 12.8% 1,972 9,296 1.2% 4.0% Tampa Bay, FL 4,999,685 $25.49 12.9% 14.8% -20,830 24,295 1.6% 7.4% West Palm Beach/ Palm Beach County, FL 4,104,162 $33.66 15.5% 13.6% 14,588 92,595 -1.3% -1.8% South Total 185,501,059 $27.62 14.5% 13.0% 1,030,252 3,909,013 0.1% 3.5%
- 13. 13 North American Research & Forecast Report | Q4 2014 | Office Market Outlook | Colliers International13 United States - Downtown - Class A MARKET EXISTING INVENTORY (SF) DEC 31, 2014 AVG ANNUAL QUOTED RENT (USD PSF) DEC 31, 2014 VACANCY RATE SEP 30, 2014 VACANCY RATE DEC 31, 2014 ABSORPTION Q4 2014 (SF) YTD ABSORPTION 2014 (SF) QUARTERLY CHANGE IN RENT ANNUAL CHANGE IN RENT MIDWEST Chicago, IL 61,018,732 $40.30 12.2% 11.9% 393,380 697,036 0.7% 6.6% Cincinnati, OH 7,392,484 $22.80 17.1% 15.1% 13,847 143,955 -2.1% -2.9% Cleveland, OH 10,512,842 $22.13 14.7% 17.1% -4,825 29,437 2.6% 5.2% Columbus, OH 8,717,149 $19.58 11.0% 9.4% 347,818 476,648 -0.4% -0.4% Detroit, MI 7,213,794 $23.32 13.1% 16.6% 62,055 249,551 1.5% 1.7% Grand Rapids, MI 1,461,047 $19.10 20.2% 15.7% -17,863 45,614 -5.6% 0.5% Indianapolis, IN 9,501,787 $18.95 12.4% 9.5% 6,813 -87,148 0.0% 0.0% Kansas City, MO 10,556,891 $19.01 19.9% 12.9% -6,298 99,623 0.4% 0.8% Milwaukee, WI 5,285,718 $27.17 9.7% 10.4% 186 -15,821 0.5% 0.0% Minneapolis, MN 13,594,227 $17.37 10.4% 12.2% -80,636 37,585 -2.5% 4.6% Omaha, NE 3,492,762 $20.38 3.4% 5.9% 6,992 39,901 0.6% 0.6% St. Louis, MO 9,558,798 $17.69 19.2% 15.9% 786,144 329,212 -0.8% -1.8% St. Paul, MN 2,773,960 $14.48 12.9% 13.3% 4,211 -87,019 0.0% 0.9% Midwest Total 151,080,191 $28.25 13.2% 12.8% 1,511,824 1,958,574 0.3% 4.4% WEST Albuquerque, NM 575,047 $20.14 23.6% 24.9% 0 16,977 0.0% 1.5% Bakersfield, CA 788,282 $17.40 5.8% 7.1% -872 45,711 0.0% 0.0% Boise, ID 1,941,427 $19.57 16.7% 14.4% 20,608 215,880 -5.7% 1.0% Denver, CO 21,596,434 $34.35 13.2% 10.7% 74,238 293,960 3.7% 6.9% Fresno, CA 1,026,046 $24.60 7.4% 11.9% -32,066 -45,215 0.0% 0.0% Honolulu, HI 4,644,304 $35.88 14.6% 14.2% 1,123 -37,208 1.4% 0.7% Las Vegas, NV 1,103,341 $31.56 13.6% 11.3% 0 -6,160 0.0% -4.0% Los Angeles, CA 18,098,000 $39.76 19.4% 19.5% 263,000 77,600 0.1% 7.9% Oakland, CA 10,562,045 $34.20 9.3% 9.0% 128,817 122,060 -1.0% 4.0% Phoenix, AZ 9,971,373 $23.13 21.9% 20.8% 52,001 17,125 -0.9% 0.8% Portland, OR 13,371,692 $27.01 10.3% 8.6% 155,673 74,244 3.2% 4.2% Reno, NV 583,955 $24.16 13.6% 14.4% 4,609 2,771 0.0% 0.5% Sacramento, CA 6,349,056 $31.32 11.9% 11.2% 32,003 33,833 -0.8% -3.0% San Diego, CA 7,257,266 $30.00 16.1% 18.4% -4,238 69,741 -0.4% 5.5% San Francisco, CA 57,806,721 $62.00 7.9% 7.5% 14,821 1,972,195 3.4% 18.4% San Jose - Silicon Valley, CA 3,494,393 $37.20 14.1% 15.1% -86,655 79,648 1.6% 11.9% Seattle/Puget Sound, WA 32,679,750 $34.39 11.1% 10.8% 256,608 491,050 2.7% 5.1% Stockton, CA 2,790,574 $18.36 19.0% 14.1% -7,724 24,465 -1.3% -7.3% Walnut Creek, CA 8,188,282 $28.32 16.7% 15.9% 63,572 -50,405 0.9% 2.2% West Total 202,827,988 $40.70 12.3% 11.8% 935,518 3,398,272 2.3% 10.4% U.S. TOTALS 1,070,709,637 $45.85 12.5% 11.7% 4,984,870 19,034,762 0.4% 6.6% (continued)
- 14. 14 North American Research & Forecast Report | Q4 2014 | Office Market Outlook | Colliers International United States - Suburban - All Classes MARKET EXISTING INVENTORY (SF) DEC 31, 2014 NEW SUPPLY Q4 2014 (SF) YTD NEW SUPPLY 2014 (SF) UNDER CONSTRUCTION (SF) VACANCY RATE SEP 30, 2014 VACANCY RATE DEC 31, 2014 ABSORPTION Q4 2014 (SF) YTD ABSORPTION 2014 (SF) NORTHEAST Baltimore, MD 88,610,525 0 817,452 0 11.9% 11.6% 251,337 1,724,939 Boston, MA 112,680,357 164,000 994,613 2,327,469 17.5% 17.1% 534,817 2,405,942 Hartford, CT 12,784,662 0 0 0 12.2% 12.1% 11,007 385,980 Long Island, NY 74,909,240 0 80,000 20,000 10.5% 10.1% 313,524 204,278 New Jersey - Central*** 129,118,877 0 100,826 1,298,674 14.5% 14.3% 285,158 960,371 New Jersey - Northern*** 163,981,980 519,108 594,595 0 15.7% 15.6% 541,457 1,000,459 Philadelphia, PA 110,687,514 215,000 820,631 531,000 14.8% 14.5% 578,153 1,298,926 Pittsburgh, PA 91,894,186 333,895 1,085,770 1,364,999 8.0% 7.7% 427,253 703,437 Washington, DC 289,473,218 607,792 3,119,753 3,714,332 17.4% 17.6% -153,888 -1,219,291 Westchester County, NY 37,818,392 0 0 0 14.5% 14.2% 80,723 -460,672 Northeast Total 1,111,958,951 1,839,795 7,613,640 9,256,474 14.7% 14.6% 2,869,541 7,004,369 SOUTH Atlanta, GA 171,634,023 271,298 271,298 1,863,000 16.0% 15.7% 669,415 2,543,161 Birmingham, AL 14,674,044 0 0 0 14.3% 13.9% 79,206 53,851 Charleston, SC 9,865,488 75,000 189,880 140,000 11.6% 11.4% 78,918 -25,804 Charlotte, NC 62,560,010 61,408 442,413 479,850 11.4% 11.3% 146,373 1,136,872 Columbia, SC 4,968,691 0 0 0 22.4% 22.4% 453 65,952 Dallas, TX 240,517,508 710,771 3,209,627 6,423,662 14.6% 14.6% 591,975 4,080,649 Ft. Lauderdale-Broward, FL 43,281,759 25,018 25,018 53,888 13.7% 13.1% 267,157 601,320 Ft. Worth, TX 21,529,896 168,642 396,927 656,070 11.4% 11.1% 233,443 461,045 Greenville, SC 4,783,806 0 0 0 16.8% 17.6% -38,004 82,720 Houston, TX 170,794,069 1,572,742 6,713,542 15,601,489 12.2% 12.0% 1,741,946 6,021,073 Jacksonville, FL 46,170,943 0 25,151 234,041 11.2% 10.3% 426,230 982,651 Little Rock, AR 7,560,738 0 0 0 11.8% 11.3% 2,691 71,066 Memphis, TN 27,278,002 0 0 292,464 14.8% 14.3% 128,160 270,782 Miami-Dade, FL 66,747,143 0 80,000 310,330 11.5% 11.2% 191,684 811,285 Nashville, TN 15,524,514 281,551 780,551 0 5.0% 5.7% 169,043 638,831 Orlando, FL 54,494,380 0 315,599 90,000 14.0% 13.5% 262,808 376,861 Raleigh/Durham/ Chapel Hill, NC 67,050,606 262,649 809,649 1,687,533 12.2% 11.0% 1,038,400 1,433,748 Richmond, VA 34,636,172 12,377 113,377 146,658 11.2% 10.5% 254,663 276,007 Savannah, GA 1,461,838 0 0 0 22.4% 20.4% 29,630 -16,505 Tampa Bay, FL 57,514,023 0 110,000 18,000 17.1% 16.4% 430,055 899,451 West Palm Beach/ Palm Beach County, FL 27,901,092 40,000 86,942 15,000 17.1% 16.2% 280,711 604,060 South Total 1,150,948,745 3,481,456 13,569,974 28,011,985 13.7% 13.3% 6,984,957 21,369,076 *** Q3-14 data displayed
- 15. 15 North American Research & Forecast Report | Q4 2014 | Office Market Outlook | Colliers International15 United States - Suburban - All Classes MARKET EXISTING INVENTORY (SF) DEC 31, 2014 NEW SUPPLY Q4 2014 (SF) YTD NEW SUPPLY 2014 (SF) UNDER CONSTRUCTION (SF) VACANCY RATE SEP 30, 2014 VACANCY RATE DEC 31, 2014 ABSORPTION Q4 2014 (SF) YTD ABSORPTION 2014 (SF) MIDWEST Chicago, IL 155,340,269 180,000 335,475 0 17.1% 16.9% 411,591 397,005 Cincinnati, OH 46,486,702 0 135,576 750,000 15.2% 15.0% 101,013 565,919 Cleveland, OH 48,126,510 0 112,990 715,753 11.1% 10.9% 172,310 279,625 Columbus, OH 44,106,261 79,000 79,000 345,840 10.3% 10.0% 185,396 318,320 Detroit, MI 138,505,074 0 86,852 185,000 17.3% 16.9% 571,969 399,883 Grand Rapids, MI 12,625,071 0 140,593 80,000 20.3% 20.1% 19,280 88,777 Indianapolis, IN 43,409,287 0 132,991 150,000 9.3% 9.1% 89,704 335,703 Kansas City, MO 59,444,798 0 371,200 438,500 10.6% 10.8% -113,311 970,150 Milwaukee, WI 33,309,621 0 95,000 300,200 12.3% 12.0% 105,320 300,082 Minneapolis, MN 79,978,899 0 598,400 1,033,300 12.5% 12.5% -17,782 1,484,193 Omaha, NE 21,475,383 0 344,489 100,000 10.8% 10.4% 60,922 509,776 St. Louis, MO 55,950,937 590,660 773,660 0 9.5% 8.6% 473,331 972,852 Midwest Total 738,758,812 849,660 3,206,226 4,098,593 13.8% 13.6% 2,059,743 6,622,285 WEST Albuquerque, NM 10,877,999 0 0 0 20.1% 19.7% 51,721 -369,370 Bakersfield, CA 6,139,696 60,000 77,968 63,410 6.8% 5.8% 120,364 154,586 Boise, ID 17,186,733 28,301 182,417 49,001 12.9% 14.7% -281,552 -616,510 Denver, CO 107,201,213 38,020 517,557 1,588,159 12.7% 12.4% 362,077 1,189,803 Fairfield, CA 5,012,086 30,000 30,000 0 19.1% 20.0% -22,244 22,839 Fresno, CA 17,562,156 0 20,000 60,000 13.4% 13.4% -11,569 133,291 Honolulu, HI 7,730,394 0 0 0 12.3% 12.1% 17,733 -37,646 Las Vegas, NV 38,036,407 268,420 327,420 331,438 20.6% 21.5% -130,503 441,279 Los Angeles - Inland Empire, CA 20,403,066 58,000 152,891 0 18.4% 17.0% 333,900 548,700 Los Angeles, CA 169,567,042 0 152,300 2,320,845 16.5% 15.6% 871,200 3,277,100 Oakland, CA 16,200,725 0 0 0 17.7% 16.1% 204,379 571,982 Orange County, CA 81,201,669 0 814,817 425,000 15.2% 14.1% 579,300 1,896,601 Phoenix, AZ 112,473,249 326,798 1,054,391 2,976,395 17.8% 17.2% 961,194 2,874,118 Pleasanton/Tri-Valley, CA 27,644,063 0 0 0 14.9% 14.2% 200,425 -669,609 Portland, OR 43,705,645 0 81,521 167,934 8.8% 8.4% 185,043 613,076 Reno, NV 9,673,961 0 0 0 14.5% 13.9% 61,174 21,294 Sacramento, CA 52,048,666 55,140 91,056 0 17.8% 17.8% 25,749 770,751 San Diego, CA 71,841,263 0 587,052 1,312,580 12.0% 11.4% 475,655 1,717,628 San Francisco Peninsula, CA 35,209,871 0 30,893 1,172,746 10.7% 10.4% 108,874 184,141 San Jose - Silicon Valley, CA 66,266,337 581,837 1,363,922 8,086,492 9.1% 8.0% 987,372 1,911,143 Seattle/Puget Sound, WA 56,542,807 0 0 1,366,693 8.7% 8.7% 45,435 580,804 Walnut Creek, CA 5,359,532 0 0 0 17.1% 17.1% -3,552 -83,741 West Total 977,884,580 1,446,516 5,484,205 19,920,693 14.4% 13.9% 5,142,175 15,132,260 U.S. TOTALS 3,979,551,088 7,617,427 29,874,045 61,287,745 14.2% 13.8% 17,056,416 50,127,990 (continued)
- 16. 16 North American Research & Forecast Report | Q4 2014 | Office Market Outlook | Colliers International United States - Suburban - Class A MARKET EXISTING INVENTORY (SF) DEC 31, 2014 AVG ANNUAL QUOTED RENT (USD PSF) DEC 31, 2014 VACANCY RATE SEP 30, 2014 VACANCY RATE DEC 31, 2014 ABSORPTION Q4 2014 YTD ABSORPTION 2014 (SF) QUARTERLY CHANGE IN RENT ANNUAL CHANGE IN RENT NORTHEAST Baltimore, MD 31,965,958 $24.18 12.4% 12.5% -39,862 1,111,614 0.2% -1.0% Boston, MA 49,307,140 $27.80 16.2% 16.0% 188,228 1,206,287 1.6% 9.4% Hartford, CT 7,123,495 $21.02 11.9% 11.8% 11,102 226,921 0.3% -1.7% Long Island, NY 25,208,865 $30.96 10.9% 10.8% 20,780 -146,174 1.5% 2.2% New Jersey - Central*** 61,705,302 $26.40 15.3% 14.6% 730,733 1,294,780 -0.3% 1.5% New Jersey - Northern*** 88,628,188 $27.99 18.2% 18.3% 373,535 301,992 -0.1% 4.9% Philadelphia, PA 67,914,322 $25.55 13.0% 12.2% 732,321 1,612,819 0.0% 1.5% Pittsburgh, PA 17,311,233 $26.89 9.1% 8.8% 223,737 195,419 7.7% 23.1% Washington, DC 140,162,960 $31.88 18.0% 18.1% 229,516 104,039 0.2% -1.8% Westchester County, NY 17,710,849 $27.63 17.9% 17.7% 40,038 -373,200 -0.9% 2.8% Northeast Total 507,038,312 $28.52 15.8% 15.6% 2,510,128 5,534,497 0.2% 1.9% SOUTH Atlanta, GA 81,498,787 $24.18 13.8% 13.7% 277,877 1,278,608 1.5% 7.5% Birmingham, AL 9,276,993 $21.46 10.6% 10.8% -35,097 -27,806 3.1% 3.7% Charleston, SC 3,762,805 $25.16 7.7% 8.6% 33,878 -119,134 -0.8% 5.4% Charlotte, NC 20,721,795 $23.56 11.1% 11.9% -162,496 561,610 3.2% 2.5% Columbia, SC 1,001,769 $16.99 17.6% 17.6% -279 -1,382 0.4% -0.5% Dallas, TX 98,986,975 $25.15 13.7% 13.9% 281,055 1,999,402 0.6% 6.3% Ft. Lauderdale-Broward, FL 8,352,220 $27.22 15.0% 14.6% 28,943 264,859 0.7% 1.8% Ft. Worth, TX 3,755,579 $24.50 2.6% 5.8% 28,374 69,321 0.6% 0.0% Greenville, SC 2,458,553 $18.83 9.6% 12.7% -74,239 21,579 0.9% 3.2% Houston, TX 78,022,159 $31.61 9.6% 9.9% 1,113,430 5,078,150 -1.6% 2.6% Jacksonville, FL 9,183,817 $20.05 6.5% 6.5% -3,539 309,519 -1.1% 0.2% Little Rock, AR 2,843,202 $22.03 12.3% 12.2% 4,150 32,557 1.3% 16.0% Memphis, TN 8,309,170 $20.55 8.1% 7.7% 35,546 59,385 -2.5% -2.8% Miami-Dade, FL 16,153,395 $33.31 13.9% 13.4% 82,170 431,788 0.2% 4.5% Nashville, TN 8,181,239 $25.01 4.8% 6.0% 159,080 575,170 -0.4% 1.9% Orlando, FL 17,397,959 $21.51 16.6% 15.5% 186,144 185,590 1.7% 1.6% Raleigh/Durham/ Chapel Hill, NC 25,412,254 $22.62 10.1% 9.0% 464,912 893,489 0.3% 6.1% Richmond, VA 13,761,620 $18.97 11.3% 10.3% 143,304 35,545 0.5% 5.1% Savannah, GA 490,035 $21.62 19.3% 16.7% 12,463 -4,140 -2.3% -1.5% Tampa Bay, FL 19,140,239 $23.79 15.7% 14.5% 226,613 538,574 -0.7% 1.4% West Palm Beach/ Palm Beach County, FL 6,526,317 $29.60 16.8% 14.8% 130,814 312,140 -0.2% 3.1% South Total 435,236,882 $25.55 12.2% 12.1% 2,933,103 12,494,824 0.3% 4.8% *** Q3-14 data displayed
- 17. 17 North American Research & Forecast Report | Q4 2014 | Office Market Outlook | Colliers International17 United States - Suburban - Class A MARKET EXISTING INVENTORY (SF) DEC 31, 2014 AVG ANNUAL QUOTED RENT (USD PSF) DEC 31, 2014 VACANCY RATE SEP 30, 2014 VACANCY RATE DEC 31, 2014 ABSORPTION Q4 2014 YTD ABSORPTION 2014 (SF) QUARTERLY CHANGE IN RENT ANNUAL CHANGE IN RENT MIDWEST Chicago, IL 78,712,116 $27.51 18.2% 18.0% 340,528 -27,393 0.4% 0.3% Cincinnati, OH 18,266,220 $21.17 17.5% 17.2% 42,284 243,007 0.1% 2.6% Cleveland, OH 9,477,760 $21.31 11.1% 10.4% 70,337 112,669 -0.4% 1.2% Columbus, OH 18,416,079 $19.43 8.6% 8.3% 129,675 262,352 -0.3% 0.2% Detroit, MI 35,191,204 $20.34 16.0% 16.1% 618,769 814,000 -0.4% 5.1% Grand Rapids, MI 937,115 $16.21 16.8% 16.4% 3,856 94,882 21.8% -7.4% Indianapolis, IN 12,589,324 $18.80 11.3% 11.4% -6,411 274,260 -0.3% 2.5% Kansas City, MO 16,832,829 $20.75 9.0% 9.0% 449 381,781 0.0% 0.5% Milwaukee, WI 6,230,984 $21.78 10.9% 8.5% 148,708 224,785 1.3% 2.5% Minneapolis, MN 26,377,731 $14.53 14.2% 13.7% 141,165 1,413,400 1.9% 4.3% Omaha, NE 5,345,490 $25.83 3.8% 3.0% 52,540 345,481 -0.4% 4.2% St. Louis, MO 26,809,431 $21.93 9.4% 7.4% 501,964 517,420 1.0% 1.0% Midwest Total 255,186,283 $22.23 14.1% 13.7% 2,043,864 4,656,644 0.4% 1.5% WEST Albuquerque, NM 811,008 $21.30 4.7% 4.3% 2,981 -76 0.0% 3.2% Bakersfield, CA 2,836,404 $24.00 5.2% 4.5% 77,810 95,588 0.0% 0.0% Boise, ID 5,854,337 $16.75 16.4% 17.8% -62,414 -158,625 6.3% 9.0% Denver, CO 36,238,351 $25.62 12.0% 11.9% 40,894 315,977 2.4% 3.9% Fairfield, CA 1,980,606 $25.83 18.2% 20.2% -15,748 26,944 -0.5% 0.3% Fresno, CA 3,973,324 $25.80 16.6% 17.2% -24,884 5,389 0.0% 0.0% Las Vegas, NV 4,922,696 $31.32 29.4% 29.8% 139,903 378,073 1.6% 5.7% Los Angeles - Inland Empire, CA 5,019,438 $25.56 18.9% 15.2% 185,700 298,900 -0.5% 2.9% Los Angeles, CA 104,058,698 $36.48 14.7% 14.4% 452,400 2,242,700 1.7% 4.1% Oakland, CA 3,682,927 $32.40 17.7% 14.3% 123,938 338,208 2.3% 17.4% Orange County, CA 33,083,323 $27.84 16.7% 15.6% 150,000 255,900 2.7% 7.3% Phoenix, AZ 31,689,343 $24.70 16.4% 15.4% 554,511 1,441,949 1.1% 3.9% Pleasanton/Tri-Valley, CA 15,526,039 $31.56 16.0% 14.8% 184,690 -803,958 0.4% 12.4% Portland, OR 11,407,101 $23.85 10.5% 10.3% 18,472 48,843 0.0% 2.5% Reno, NV 965,364 $19.90 14.9% 14.9% 609 1,901 1.2% -3.5% Sacramento, CA 14,278,898 $22.25 15.3% 15.9% -89,719 361,023 -0.5% 0.5% San Diego, CA 23,804,430 $36.24 11.4% 11.1% 79,649 670,363 1.0% 6.0% San Francisco Peninsula 22,729,746 $47.40 11.1% 10.5% 136,913 172,898 1.5% 9.7% San Jose - Silicon Valley, CA 34,718,131 $46.08 10.8% 9.7% 931,656 1,891,937 -1.0% 6.1% Seattle/Puget Sound, WA 20,752,875 $33.83 7.2% 6.4% 158,387 597,498 2.0% 3.0% Walnut Creek, CA 737,964 $29.16 19.6% 15.6% 29,455 18,752 3.0% 1.7% West Total 379,071,003 $33.05 13.8% 13.2% 3,075,203 8,200,184 1.3% 5.7% U.S. TOTALS 1,576,532,480 $27.78 14.0% 13.8% 10,562,298 30,886,149 0.6% 3.6% (continued)
- 18. 18 North American Research & Forecast Report | Q4 2014 | Office Market Outlook | Colliers International Canada - Downtown - All Classes MARKET EXISTING INVENTORY (SF) DEC 31, 2014 NEW SUPPLY Q4 2014 (SF) YTD NEW SUPPLY 2014 (SF) UNDER CONSTRUCTION (SF) VACANCY RATE SEP 30, 2014 VACANCY RATE DEC 31, 2014 ABSORPTION Q4 2014 (SF) YTD ABSORPTION 2014 (SF) Calgary, AB 40,447,480 0 841,064 3,359,000 7.7% 8.5% -332,693 274,828 Edmonton, AB 17,286,058 0 0 2,090,493 9.0% 9.2% -57,209 -100,341 Halifax, NS** 4,547,627 0 17,000 463,900 12.4% 12.4% -159,741 -159,741 Montréal, QC 49,610,579 0 279,476 653,498 6.1% 6.0% 87,323 -42,509 Ottawa, ON 15,995,156 0 358,214 0 9.9% 10.2% -41,692 -1,056 Regina, SK 3,714,792 0 0 183,875 10.5% 10.9% -15,766 -73,069 Saskatoon, SK 2,427,338 0 0 0 8.7% 12.5% -77,992 -130,419 Toronto, ON 72,136,744 1,665,500 1,705,500 3,524,900 3.6% 4.5% 327,495 797,192 Vancouver, BC 24,474,251 0 81,770 2,150,490 6.0% 6.0% 10,101 -96,835 Victoria, BC 4,897,834 33,638 33,638 0 9.8% 8.6% -38,864 -75,528 Waterloo Region, ON 3,938,504 0 25,586 43,280 14.0% 13.7% 9,607 -31,591 Winnipeg, MB 11,944,204 0 0 70,000 8.3% 8.0% 30,913 77,824 CANADA TOTAL 251,420,567 1,699,138 3,342,248 12,539,436 6.6% 7.0% -258,518 438,755 Canada - Downtown - Class A MARKET EXISTING INVENTORY (SF) DEC 31, 2014 AVG ANNUAL QUOTED RENT (CAD PSF) DEC 31, 2014 VACANCY RATE SEP 30, 2014 VACANCY RATE DEC 31, 2014 ABSORPTION Q4 2014 (SF) YTD ABSORPTION 2014 (SF) QUARTERLY CHANGE IN RENT ANNUAL CHANGE IN RENT Calgary, AB 27,568,453 $52.00 6.5% 8.5% -252,345 517,652 -10.3% -10.3% Edmonton, AB 8,524,494 $21.80 7.5% 9.2% -22,249 -31,172 -0.9% -12.8% Halifax, NS** 1,951,103 $16.90 9.4% 12.4% 9,991 9,991 0.0% -0.6% Montréal, QC 23,073,808 $45.00 7.6% 6.0% 65,739 -65,041 0.0% 0.0% Ottawa, ON 10,004,044 $42.50 7.2% 10.2% -37,672 -28,808 -10.5% -7.8% Regina, SK 1,392,816 $34.97 4.3% 10.9% -5,385 -36,616 0.0% -3.5% Saskatoon, SK 570,560 $44.00 8.1% 12.5% 2,558 -10,916 2.3% 2.3% Toronto, ON 40,997,217 $60.85 4.6% 4.5% 727,022 1,054,645 6.5% 7.1% Vancouver, BC 10,094,997 $55.34 5.4% 6.0% 67,863 113,085 1.8% 5.4% Victoria, BC 513,808 $35.00 2.3% 8.6% 6,543 15,512 0.0% 2.9% Waterloo Region, ON 1,561,288 $24.85 11.2% 13.7% -654 -9,923 0.7% -1.9% Winnipeg, MB 2,619,428 $34.25 4.5% 8.0% -9,155 -22,502 1.5% 1.5% CANADA TOTAL 128,872,016 $49.58 6.2% 7.0% 552,256 1,505,907 -0.6% -0.2% ** Q2-14 data displayed Canadian Downtown Office Absorption By Market Q4-14 Canadian Downtown Office Under Construction By Market Q4-14 -332.7 -159.7 -78.0 -57.2 -41.7 -38.9 -15.8 9.6 10.1 30.9 87.3 327.5 -400.0-300.0-20 0.0-100.0 0.0 100.0 200.0300.0400.0 Thousands SF Calgary, AB Halifax, NS** Saskatoon, SK Edmonton, AB Ottawa, ON Victoria, BC Regina, SK Waterloo Region, ON Vancouver, BC Winnipeg, MB Toronto, ON Montreal, QC -3% -2% -1% 0% 1% 2% 3% Canada Employed Population - Annual % Change 2005 2006 2007 2008 2009 2010 2011 2012 2013 2014 $0 $5 $10 $15 $20 $25 Bil. Cross-Border Investment - North America United States Canada 0 50 100 150 200 250 300 2000 2001 2002 2003 2004 2005 2006 2007 2008 2009 2010 2011 2012 2013 2014 Moody's/RCA Commercial Property Price Indices Non-Major Market-Suburban Major Market-CBD Non-Major Market-CBD Major Market-Suburban Contract, 14.3% Pricing recovery from recession: Major Market-CBD 144.7% Non-Major Market-CBD 101.1% Major Market-Suburban 64.0% Non-Major Market-Suburban 45.8% 2001 2002 2003 2004 2005 2006 2007 2008 2009 2010 2011 2012 2013 2014 Absorption MSF Completions MSF Vac Rate (%) 0.0 0.0 0.0 0.0 0.1 0.2 0.5 0.7 2.1 2.2 3.4 3.5 0.0 0.5 1.0 1.5 2.0 2.5 3.0 3.5 4.0 Ottawa, ON Saskatoon, SK Victoria, BC Waterloo Region, ON Winnipeg, MB Regina, SK Halifax, NS** Edmonton, AB Vancouver, BC Calgary, AB Toronto, ON Montreal, QC -3% -2% -1% 0% 1% 2% 3% Canada 200 1.0% -1.0% -0.5% 0.0% 0.5% 1.5% 2.0% $0 $50 $100 $150 $200 $250 $300 2007 2008 2009 2010 2011 2012 2013 2014 Bil. Office Transaction Volume - Q4 2014 - NA 12-Month Trailing Volume (left-axis) Year-Over-Year % Change (right-axis) $0 $5 $10 $15 $20 $25 Bil. Cross-B -12% -8% -4% 0% 4% 8% 0 12 24 36 48 60 72 84 96 Months 0 50 100 150 200 250 300 2000 Moody's/ Office-Using Employment Financial Activities Total Employment Professional & Business Services Millions SF Pricin Major Non- Major Non-M 200
- 19. 19 North American Research & Forecast Report | Q4 2014 | Office Market Outlook | Colliers International19 * Straight averages used ** Q2-14 data displayed ** Q2-14 data displayed Canada - Suburban - Class A MARKET EXISTING INVENTORY (SF) DEC 31, 2014 AVG ANNUAL QUOTED RENT (CAD PSF) DEC 31, 2014 VACANCY RATE SEP 30, 2014 VACANCY RATE DEC 31, 2014 ABSORPTION Q4 2014 YTD ABSORPTION 2014 (SF) QUARTERLY CHANGE IN RENT ANNUAL CHANGE IN RENT Calgary, AB 13,073,395 $41.00 9.8% 10.1% 198,102 317,139 -4.7% -6.8% Halifax, NS** 1,478,125 $28.56 10.5% 10.5% 44,328 44,328 0.0% 0.2% Montréal, QC 14,901,085 $31.00 9.0% 10.2% 80,548 803,546 0.0% 10.7% Ottawa, ON 12,716,930 $30.25 9.9% 13.1% 12,589 117,614 2.5% 2.5% Regina, SK 110,000 $29.00 0.0% 0.0% 0 0 0.0% 0.0% Toronto, ON 32,760,369 $31.31 9.6% 10.7% -63,760 -354,611 7.5% 2.3% Vancouver, BC 15,804,143 $36.16 13.7% 12.8% 418,981 805,481 0.6% 10.6% Victoria, BC 898,167 $40.00 17.2% 19.7% 51,921 46,890 0.0% 0.0% Waterloo Region, ON 3,895,374 $24.31 19.0% 17.3% 117,293 15,115 3.8% 10.8% CANADA TOTAL 95,637,588 $33.00 10.7% 11.5% 860,002 1,795,502 2.1% 3.4% Canada - Suburban - All Classes MARKET EXISTING INVENTORY (SF) DEC 31, 2014 NEW SUPPLY Q4 2014 (SF) YTD NEW SUPPLY 2014 (SF) UNDER CONSTRUCTION (SF) VACANCY RATE SEP 30, 2014 VACANCY RATE DEC 31, 2014 ABSORPTION Q4 2014 (SF) YTD ABSORPTION 2014 (SF) Calgary, AB 26,165,195 253,343 300,006 1,591,500 10.2% 10.0% 293,055 415,964 Edmonton, AB 9,408,644 0 318,631 226,375 13.4% 12.6% 84,652 189,944 Halifax, NS** 3,282,082 0 34,000 0 9.4% 9.4% 56,960 56,960 Montréal, QC 26,074,666 272,571 996,655 1,624,399 9.6% 10.2% 79,163 1,085,747 Ottawa, ON 21,717,774 466,400 689,304 581,300 10.1% 12.1% -49,927 -103,568 Regina, SK 801,929 0 0 41,000 6.2% 5.0% 9,471 -25,529 Toronto, ON 67,961,722 47,000 156,573 1,563,789 9.1% 10.3% -209,656 -736,961 Vancouver, BC 30,187,348 318,251 1,087,251 1,129,462 12.4% 11.4% 341,763 627,995 Victoria, BC 3,807,173 90,022 90,022 124,000 10.0% 10.9% 30,448 24,599 Waterloo Region, ON 7,597,872 62,283 238,451 0 19.7% 18.5% 140,043 -355,718 Winnipeg, MB 3,386,471 0 0 70,000 6.4% 5.1% 43,140 116,980 CANADA TOTAL 200,390,876 1,509,870 3,910,893 6,951,825 10.5% 10.9% 819,112 1,296,413 Canada | Office Investment MARKET CBD SALES PRICE (CAD PSF) CBD CAP RATE SUBURBAN SALES PRICE (CAD PSF) SUBURBAN CAP RATE Calgary, AB $450.00 6.0% Montréal, QC $275.00 6.5% $175.00 7.3% Ottawa, ON $360.00 6.0% $180.00 7.3% Regina, SK $280.00 6.8% $200.00 7.3% Saskatoon, SK $227.00 6.3% Vancouver, BC $540.00 5.0% $330.00 6.2% Victoria, BC $300.00 6.3% $280.00 6.5% Waterloo Region, ON $170.00 6.8% $141.00 7.5% Winnipeg, MB $250.00 5.5% $250.00 6.5% CANADA AVERAGES* $300.25 6.1% $250.75 6.8%
- 20. 20 North American Research & Forecast Report | Q4 2014 | Office Market Outlook | Colliers International United States | Office Investment MARKET CBD SALES PRICE (USD PSF) CBD CAP RATE SUBURBAN SALES PRICE (USD PSF) SUBURBAN CAP RATE Albuquerque, NM $145.00 8.8% $175.00 8.0% Atlanta, GA $165.00 7.0% $177.00 7.6% Bakersfield, CA $155.00 Baltimore, MD $37.57 6.7% $180.37 6.6% Boston, MA $347.00 4.4% $169.00 6.1% Chicago, IL $350.00 5.5% $200.00 7.5% Cincinnati, OH $125.00 9.8% $135.00 9.3% Columbus, OH $98.00 Dallas, TX $120.00 7.1% Denver, CO $126.90 6.3% Fairfield County, CT $139.00 7.8% Fairfield, CA $174.00 8.3% Fresno, CA $125.00 8.5% $160.00 8.0% Ft. Worth, TX $175.00 6.1% Hartford, CT $62.56 7.5% $117.56 8.5% Houston, TX $293.00 5.9% Indianapolis, IN $170.00 8.0% $150.00 7.3% Jacksonville, FL $70.00 6.0% $120.00 8.3% Las Vegas, NV $106.86 Little Rock, AR $88.00 9.0% $117.00 8.8% Long Island, NY $202.00 7.8% Los Angeles - Inland Empire, CA $156.00 7.0% Los Angeles, CA $230.00 5.3% $340.00 5.7% Milwaukee, WI $120.00 8.5% $110.00 8.8% Minneapolis, MN $202.00 7.0% Nashville, TN $260.00 8.1% $198.00 7.8% New Jersey - Central*** $242.44 7.1% New Jersey - Northern*** $122.80 6.9% United States | Office Investment MARKET CBD SALES PRICE (USD PSF) CBD CAP RATE SUBURBAN SALES PRICE (USD PSF) SUBURBAN CAP RATE NYC - Downtown $318.00 5.0% NYC - Midtown $1,217.00 4.0% NYC - Midtown South $728.00 4.0% Oakland, CA $385.00 7.0% $285.00 6.8% Orange County, CA $285.00 5.5% Orlando, FL $275.00 7.3% $200.00 7.3% Philadelphia, PA $150.87 6.9% $139.67 7.0% Phoenix, AZ $100.00 6.8% $113.00 7.3% Pittsburgh, PA $87.00 8.8% $105.00 8.3% Pleasanton/ Tri-Valley, CA $210.00 6.8% Portland, OR $208.42 5.3% $177.42 7.0% Richmond, VA $135.00 Sacramento, CA $269.54 6.5% $151.26 6.9% San Diego, CA $238.53 5.7% $155.16 6.3% San Francisco Peninsula $375.00 7.0% San Francisco, CA $524.00 4.3% San Jose - Silicon Valley $377.00 $384.00 5.9% Savannah, GA $160.00 9.3% $120.00 9.5% Seattle/ Puget Sound, WA $309.00 5.7% $261.00 6.5% St. Louis, MO $90.00 9.5% $135.00 8.5% Stamford, CT $100.00 8.0% Tampa Bay, FL $171.00 8.0% $150.00 8.0% Walnut Creek, CA $300.00 5.5% $200.00 8.0% Washington, DC $698.00 5.2% $329.93 6.6% Westchester County, NY $73.00 7.6% White Plains, NY $100.00 8.0% U.S. AVERAGES* $254.91 6.9% $180.79 7.3% * Straight averages used *** Q3-14 data displayed (continued) Copyright © 2015 Colliers International. The information contained herein has been obtained from sources deemed reliable. While every reasonable effort has been made to ensure its accuracy, we cannot guarantee it. No responsibility is assumed for any inaccuracies. Readers are encouraged to consult their professional advisors prior to acting on any of the material contained in this report. Colliers International 601 Union Street, Suite 4800 Seattle, WA 98101 +1 206 695 4200 colliers.com OFFICE SERVICES | contact Cynthia Foster President, National Office Services +1 212 716 3515 Cynthia.Foster@colliers.com FOR MORE INFORMATION Andrea Cross Office Research Manager | USA +1 415 788 3100 Andrea.Cross@colliers.com Pete Culliney Director of Research | Global +1 212 716 3689 Pete.Culliney@colliers.com