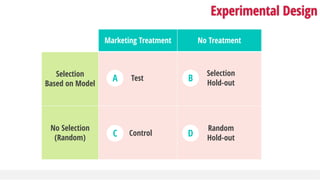
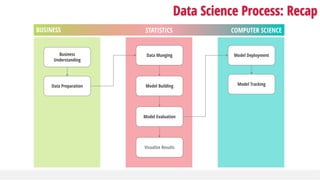
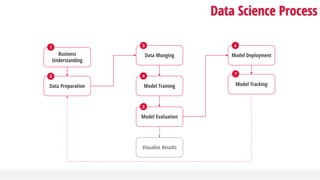
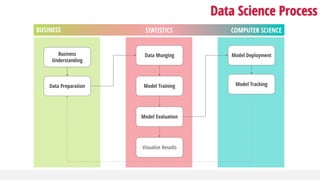
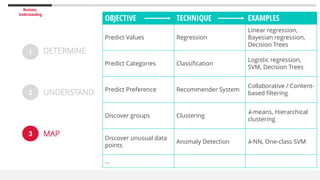
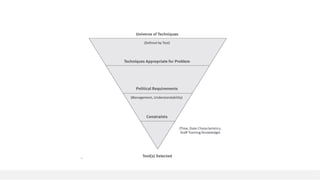
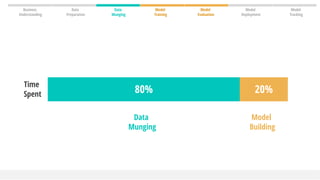
The document outlines the process of building machine learning models, emphasizing the frequent failure of analytic projects due to budget and schedule overruns, or failure to meet initial objectives. It stresses the importance of organizational buy-in, a clear understanding of business goals, and a structured approach to data preparation, modeling, and deployment. Additionally, it highlights the critical role of data munging, model evaluation, and tracking to ensure successful implementation and maintenance of data science projects.


![HOW TO BUILD
A MACHINE LEARNING MODEL
IN THREE QUICK AND EASY STEPS
USING [XXX]!!!
– Most tutorials
1](https://image.slidesharecdn.com/datascienceprocess-dataintelligencejun2017-170626163322/85/Exploring-the-Data-science-Process-4-320.jpg)


![“[T]he additional accuracy gains that we measured did not seem to justify the
engineering effort needed to bring them into a production environment.”](https://image.slidesharecdn.com/datascienceprocess-dataintelligencejun2017-170626163322/85/Exploring-the-Data-science-Process-7-320.jpg)


![Information Leakage
… Sep Oct Nov Dec Jan Feb Mar Apr
…to predict whether customers
will [do something]
Use all available information
(“Leading Indicators”)
as of the end of Jan…
OBSERVATION WIDOW PREDICTION WIDOW
o The leading indicators must be calculated from the timeframe leading up to the event
– it must not overlap with the prediction window.
o Beware of proxy events, e.g., future bookings](https://image.slidesharecdn.com/datascienceprocess-dataintelligencejun2017-170626163322/85/Exploring-the-Data-science-Process-38-320.jpg)


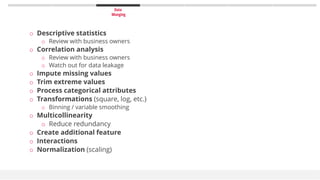

![Data
Munging
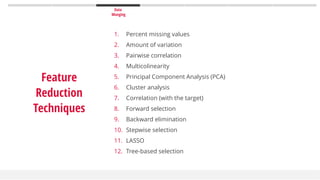
True dimensionality <<< Observed dimensionality
The abundance of redundant and irrelevant features
Curse of dimensionality
With a fixed number of training samples, the predictive power reduces as the dimensionality
increases. [Hughes phenomenon]
With 𝑑 binary variables, the number of possible combinations is 𝑂(2 𝑑
).
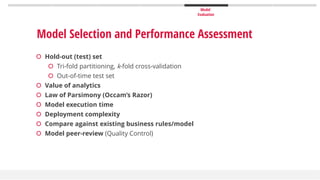
Value of Analytics
Descriptive Diagnostic Predictive Prescriptive
Law of Parsimony [Occam’s Razor]
Other things being equal, simpler explanations are generally better than complex ones.
Overfitting
Execution time (Algorithm and data)
Hindsight Insight Foresight
Feature Reduction: Why](https://image.slidesharecdn.com/datascienceprocess-dataintelligencejun2017-170626163322/85/Exploring-the-Data-science-Process-48-320.jpg)