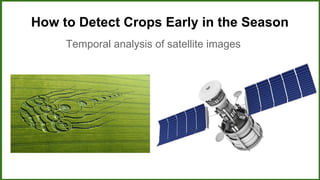
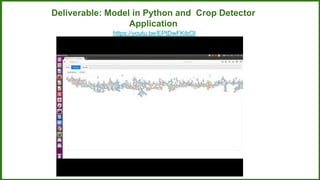
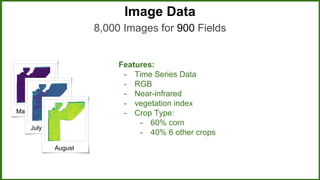
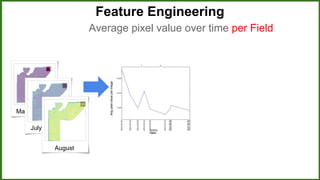
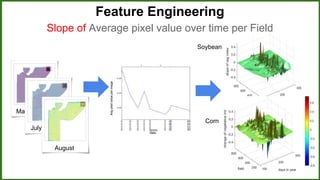
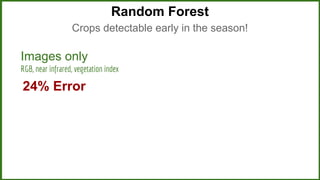
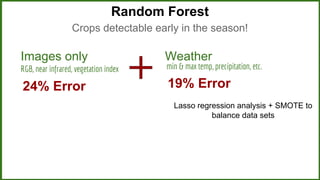
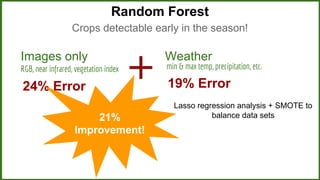
Temporal analysis of satellite imagery to determine crop type
Tatiana
Dashevskiy
1 out of 3 farms use FarmLogs services
Fertilizer
Match Services for Specific Fields
Fertilizer
Crops only detected
at the END of seasonMatch Services for Specific Fields
How to Detect Crops Early in the Season
Temporal analysis of satellite images
Deliverable: Model in Python and Crop Detector
Application
https://youtu.be/EPtDwFKibOI
Features:
- Time Series Data
- RGB
- Near-infrared
- vegetation index
- Crop Type:
- 60% corn
- 40% 6 other crops
Image Data
May
July
August
8,000 Images for 900 Fields
Feature Engineering
May
July
August
Slope of Average pixel value over time per Field
Feature Engineering
May
July
August
Slope of Average pixel value over time per Field
Feature Engineering
May
July
August
Slope of Average pixel value over time per Field
Soybean
Corn
Images only
RGB, near infrared, vegetation index
24% Error
Random Forest
Crops detectable early in the season!
Images only
RGB, near infrared, vegetation index
24% Error
Weather
19% Error
Lasso regression analysis + SMOTE to
balance data sets
Random Forest
Crops detectable early in the season!
min & max temp, precipitation, etc.
Images only
RGB, near infrared, vegetation index
24% Error
Weather
19% Error
Lasso regression analysis + SMOTE to
balance data sets
Random Forest
Crops detectable early in the season!
min & max temp, precipitation, etc.
21%
Improvement!
Tatiana Dashevskiy
PhD in Physics, Applied dynamical systems in
neuroscience
Post Doc Seattle Children’s Research
Institute

PresentationWeek2_Dashevskiy