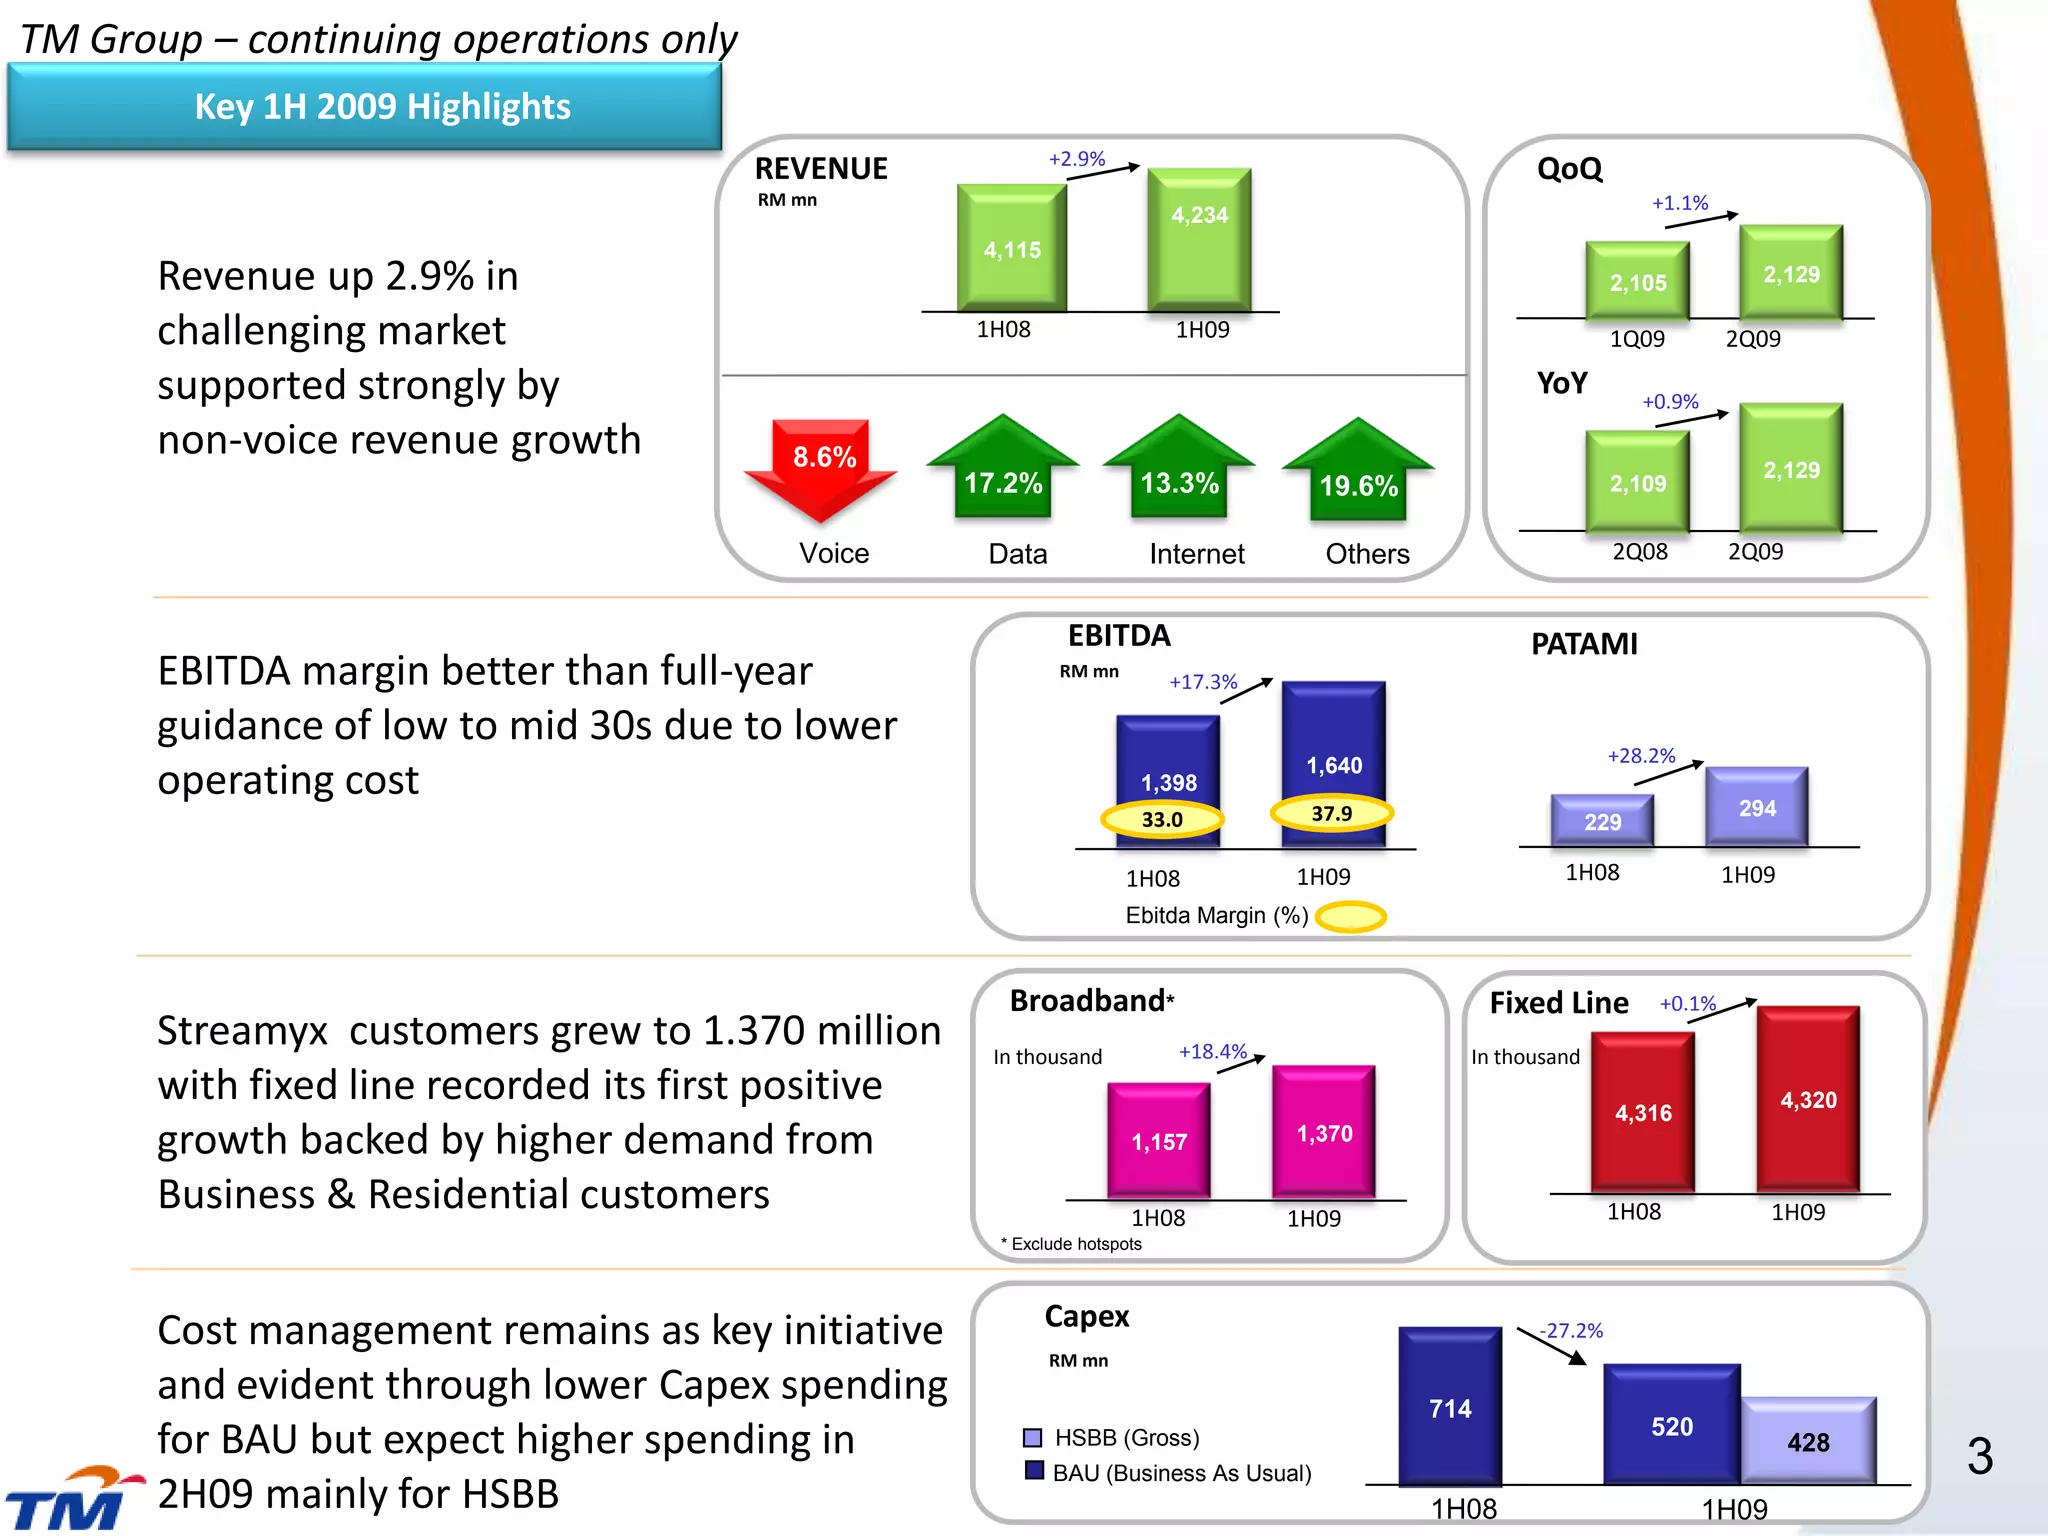
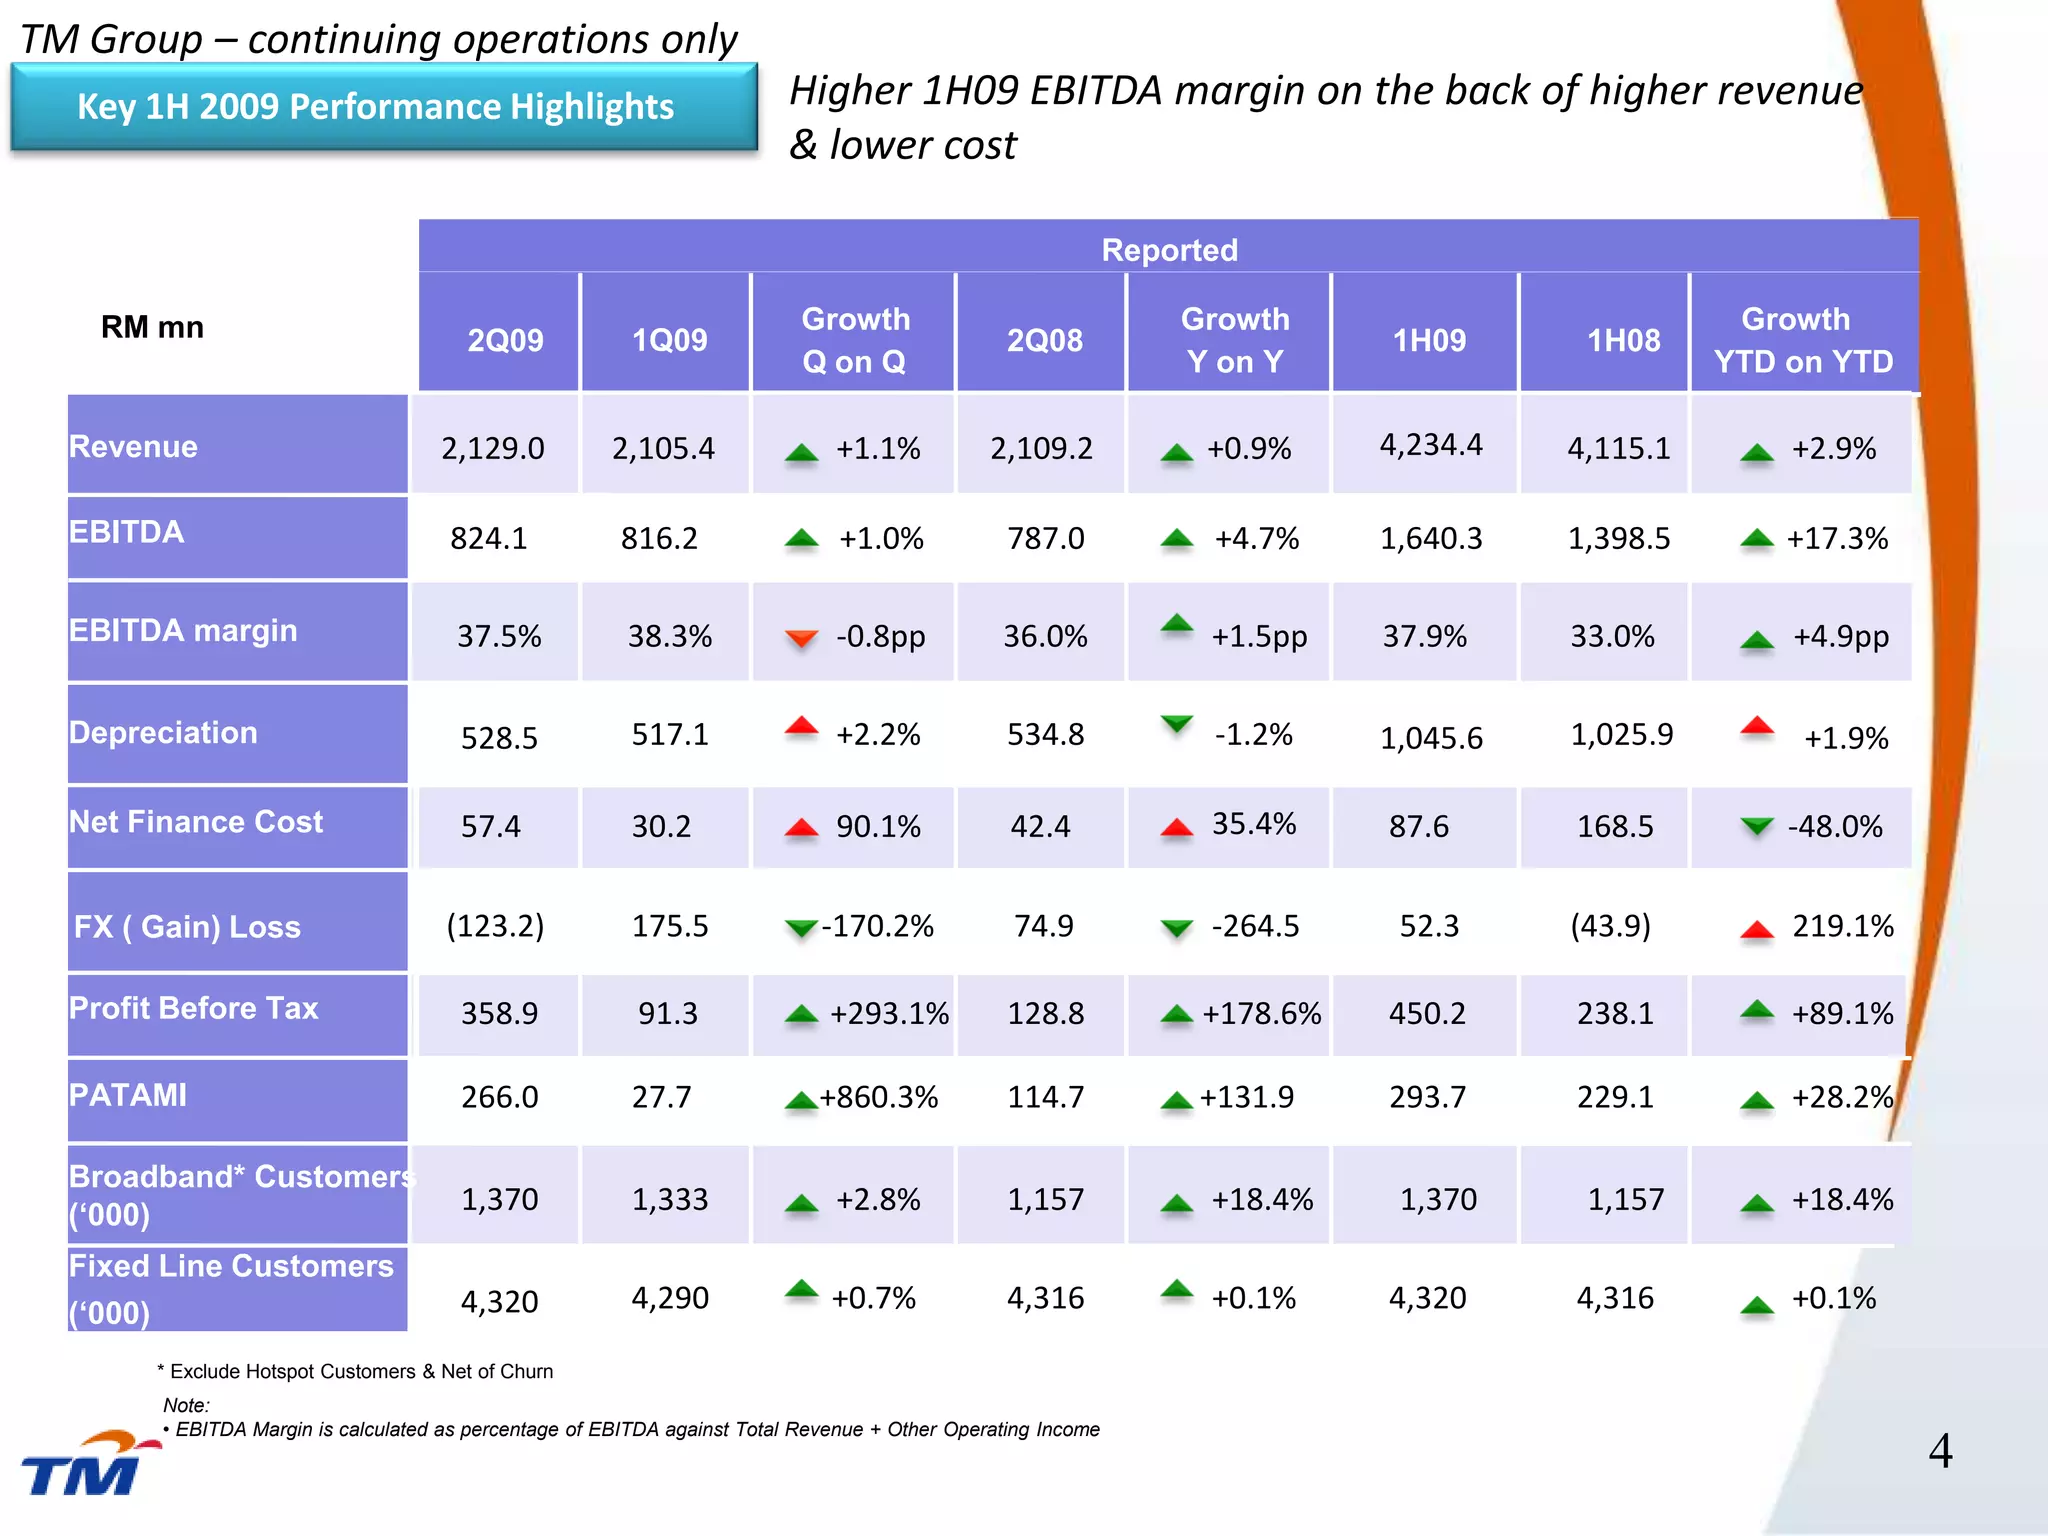
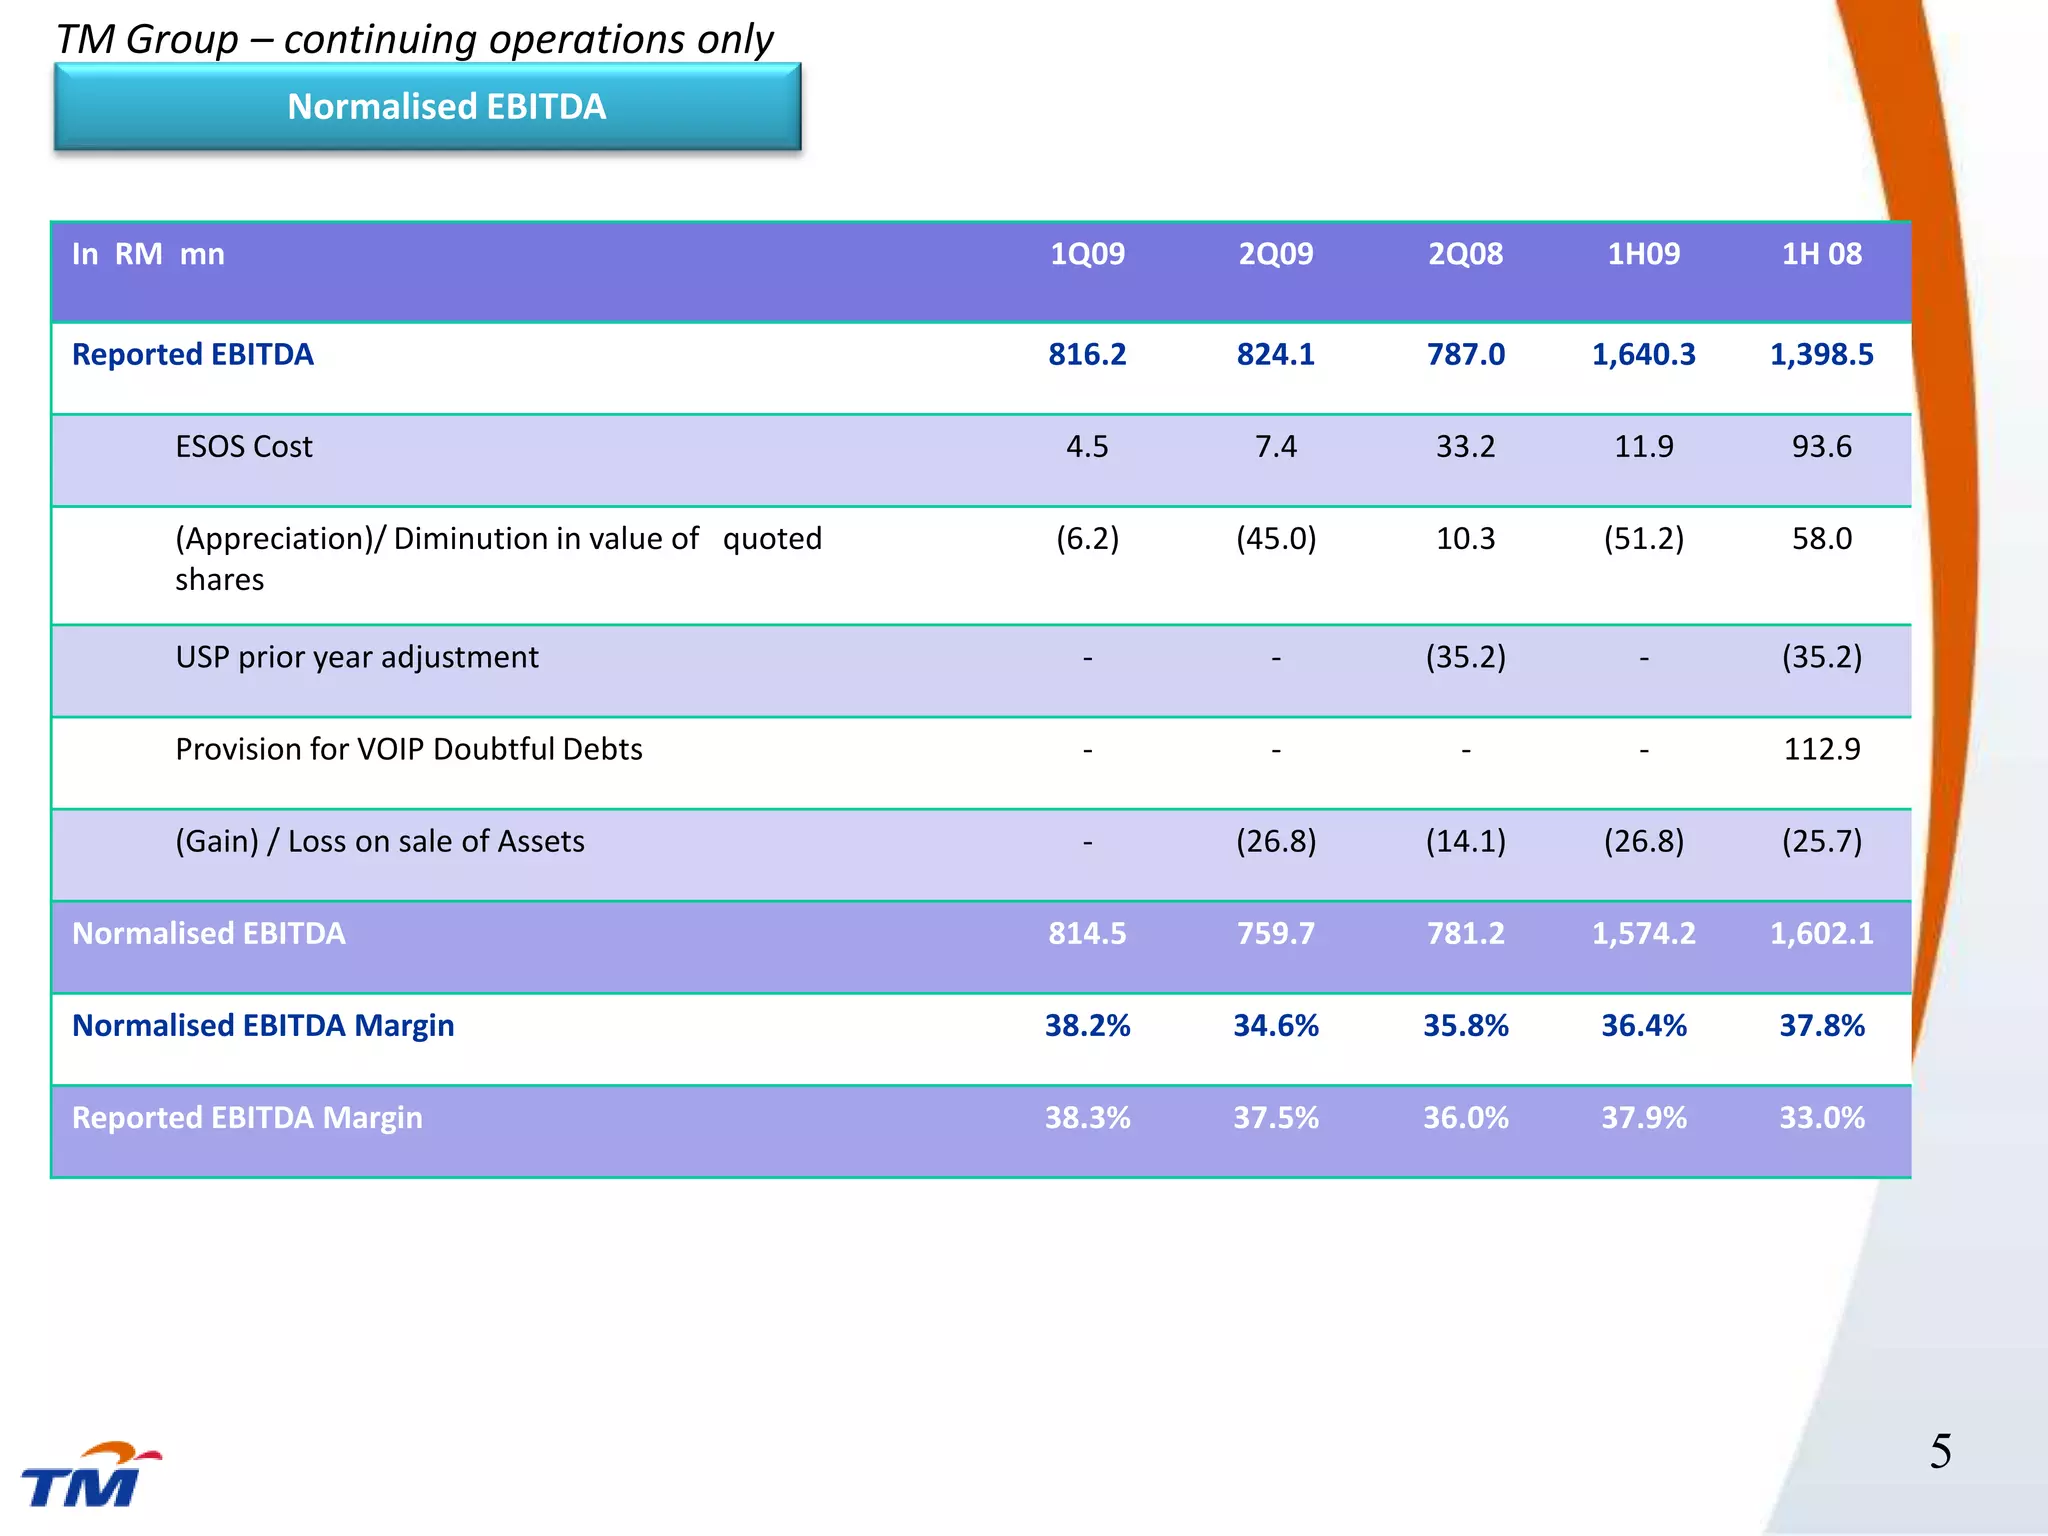
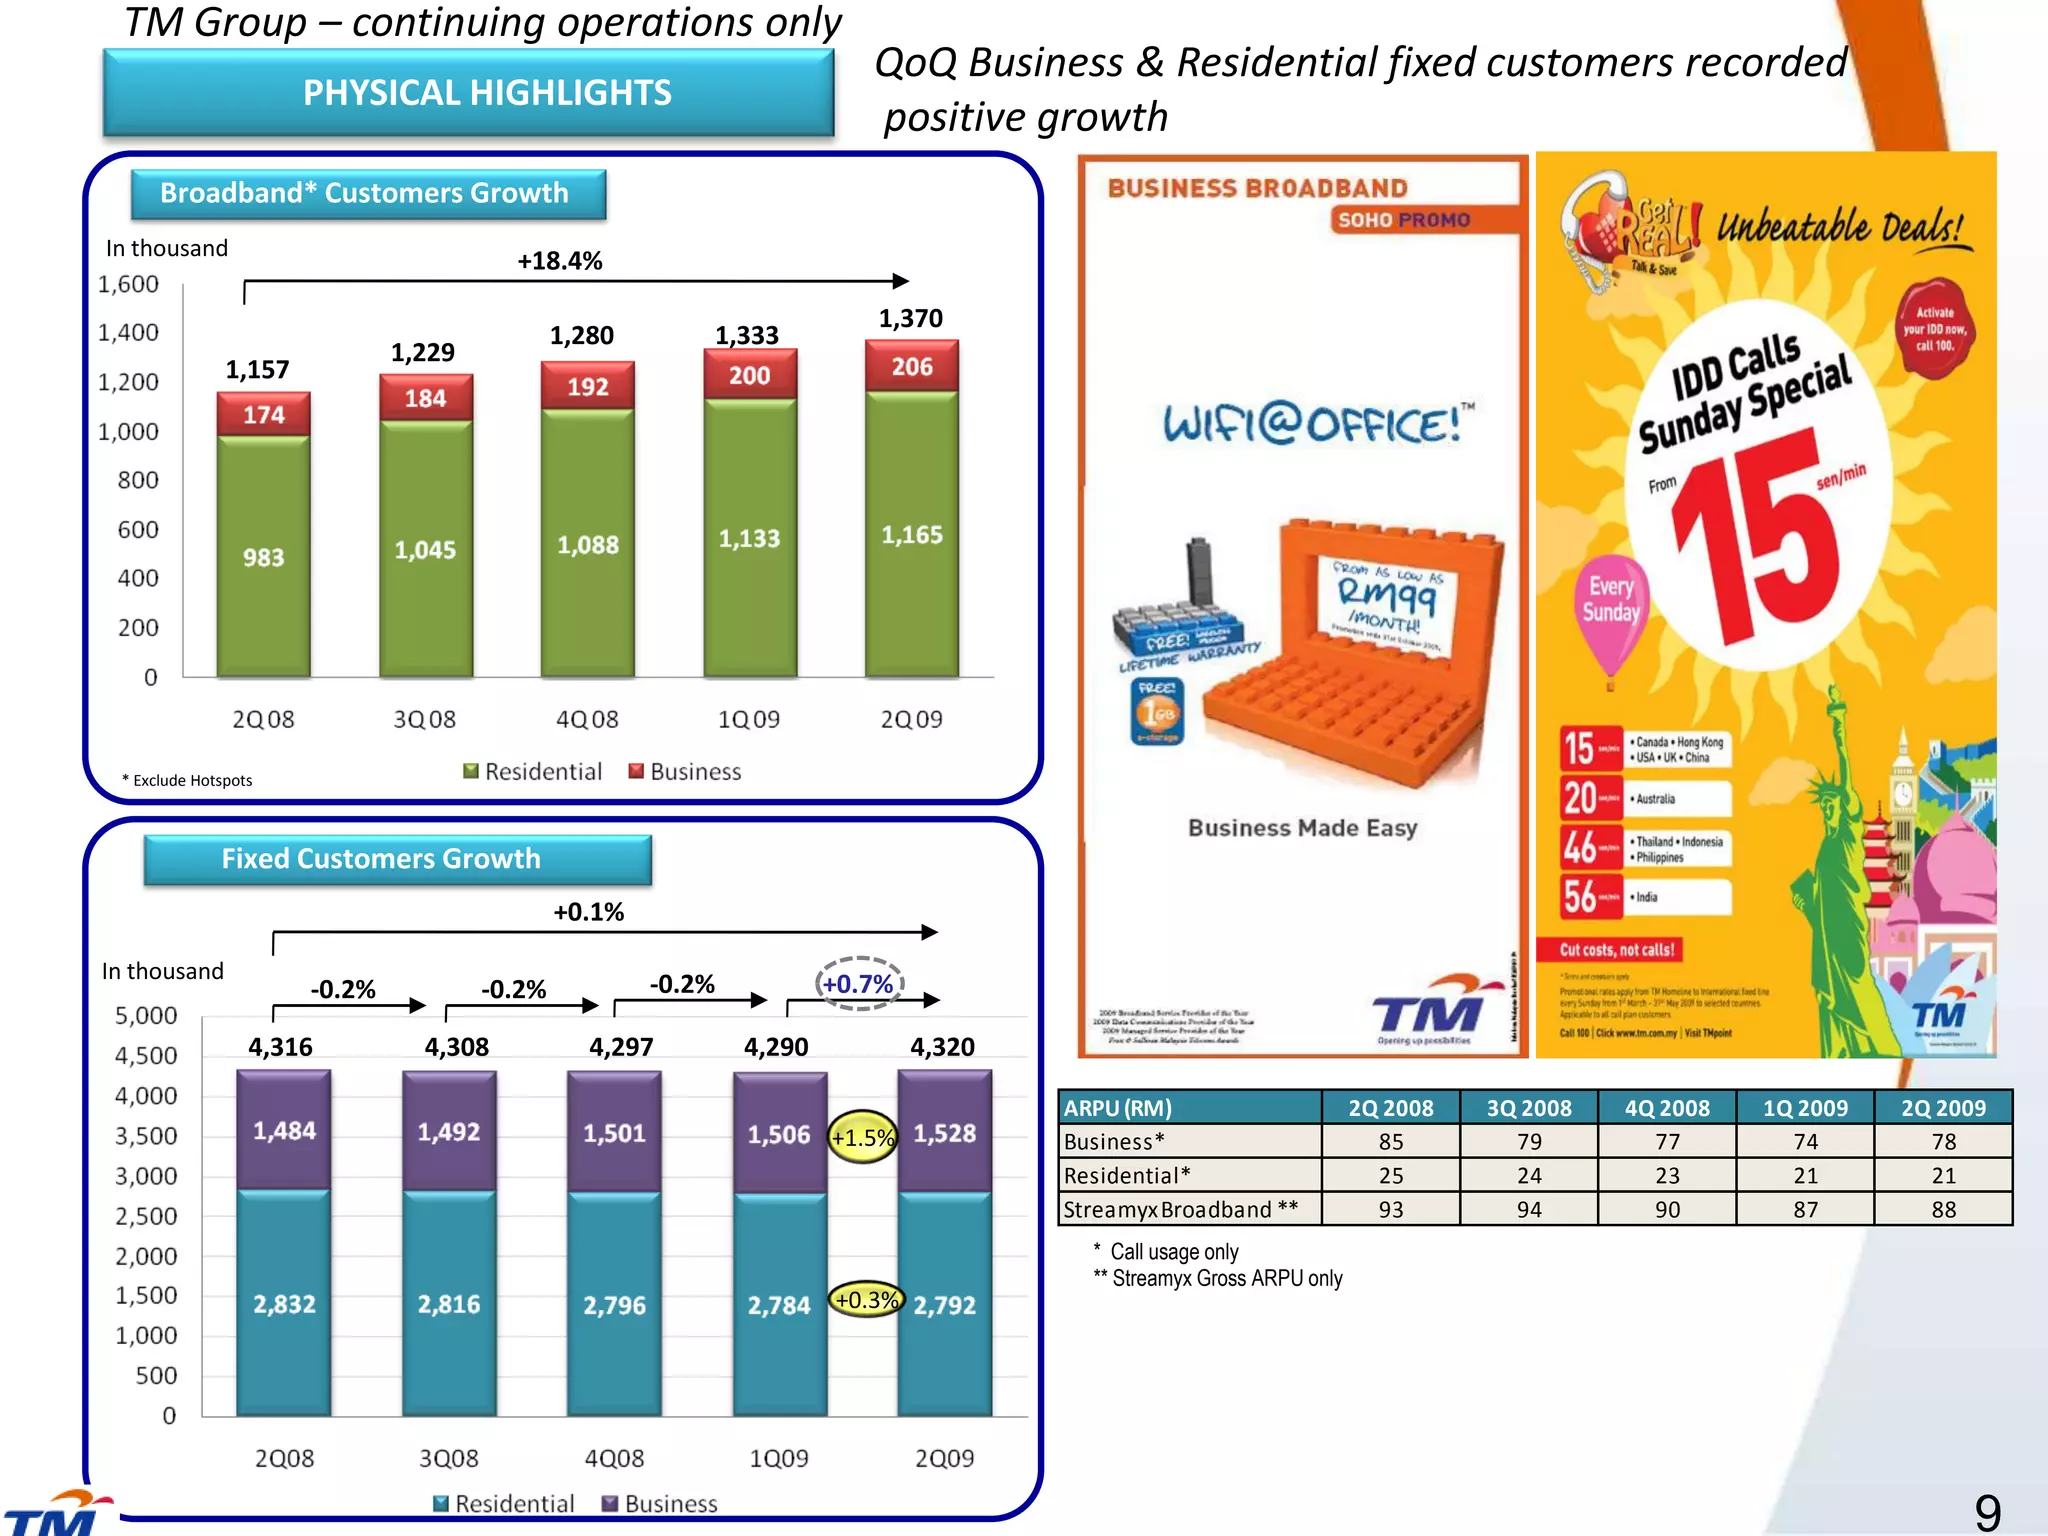
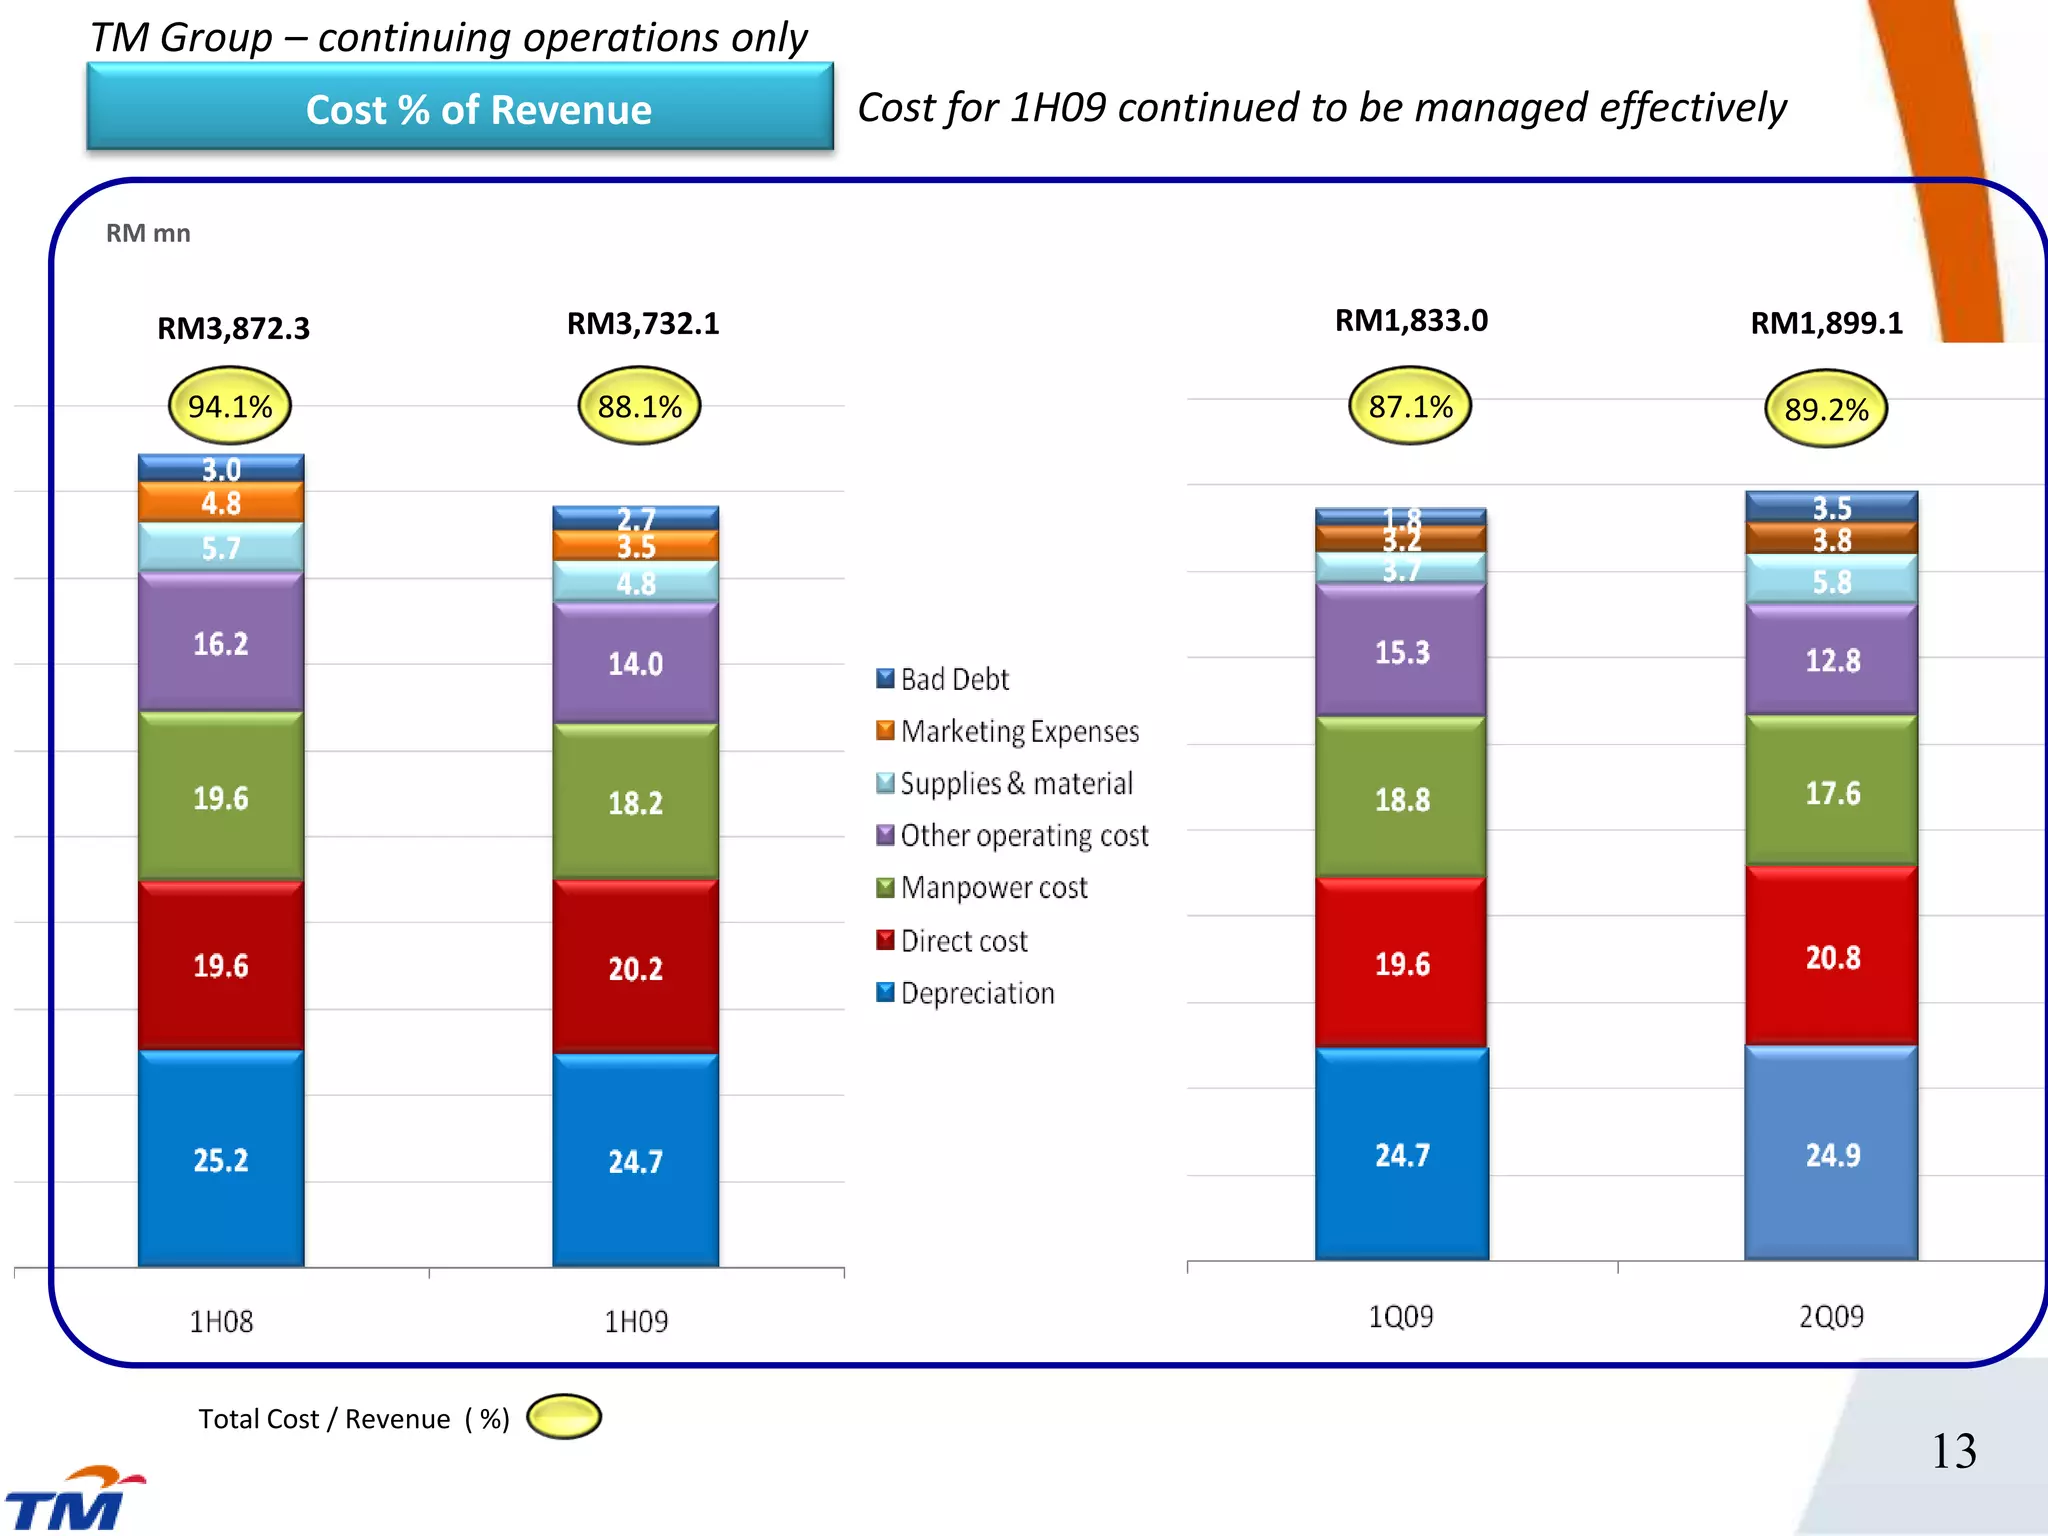
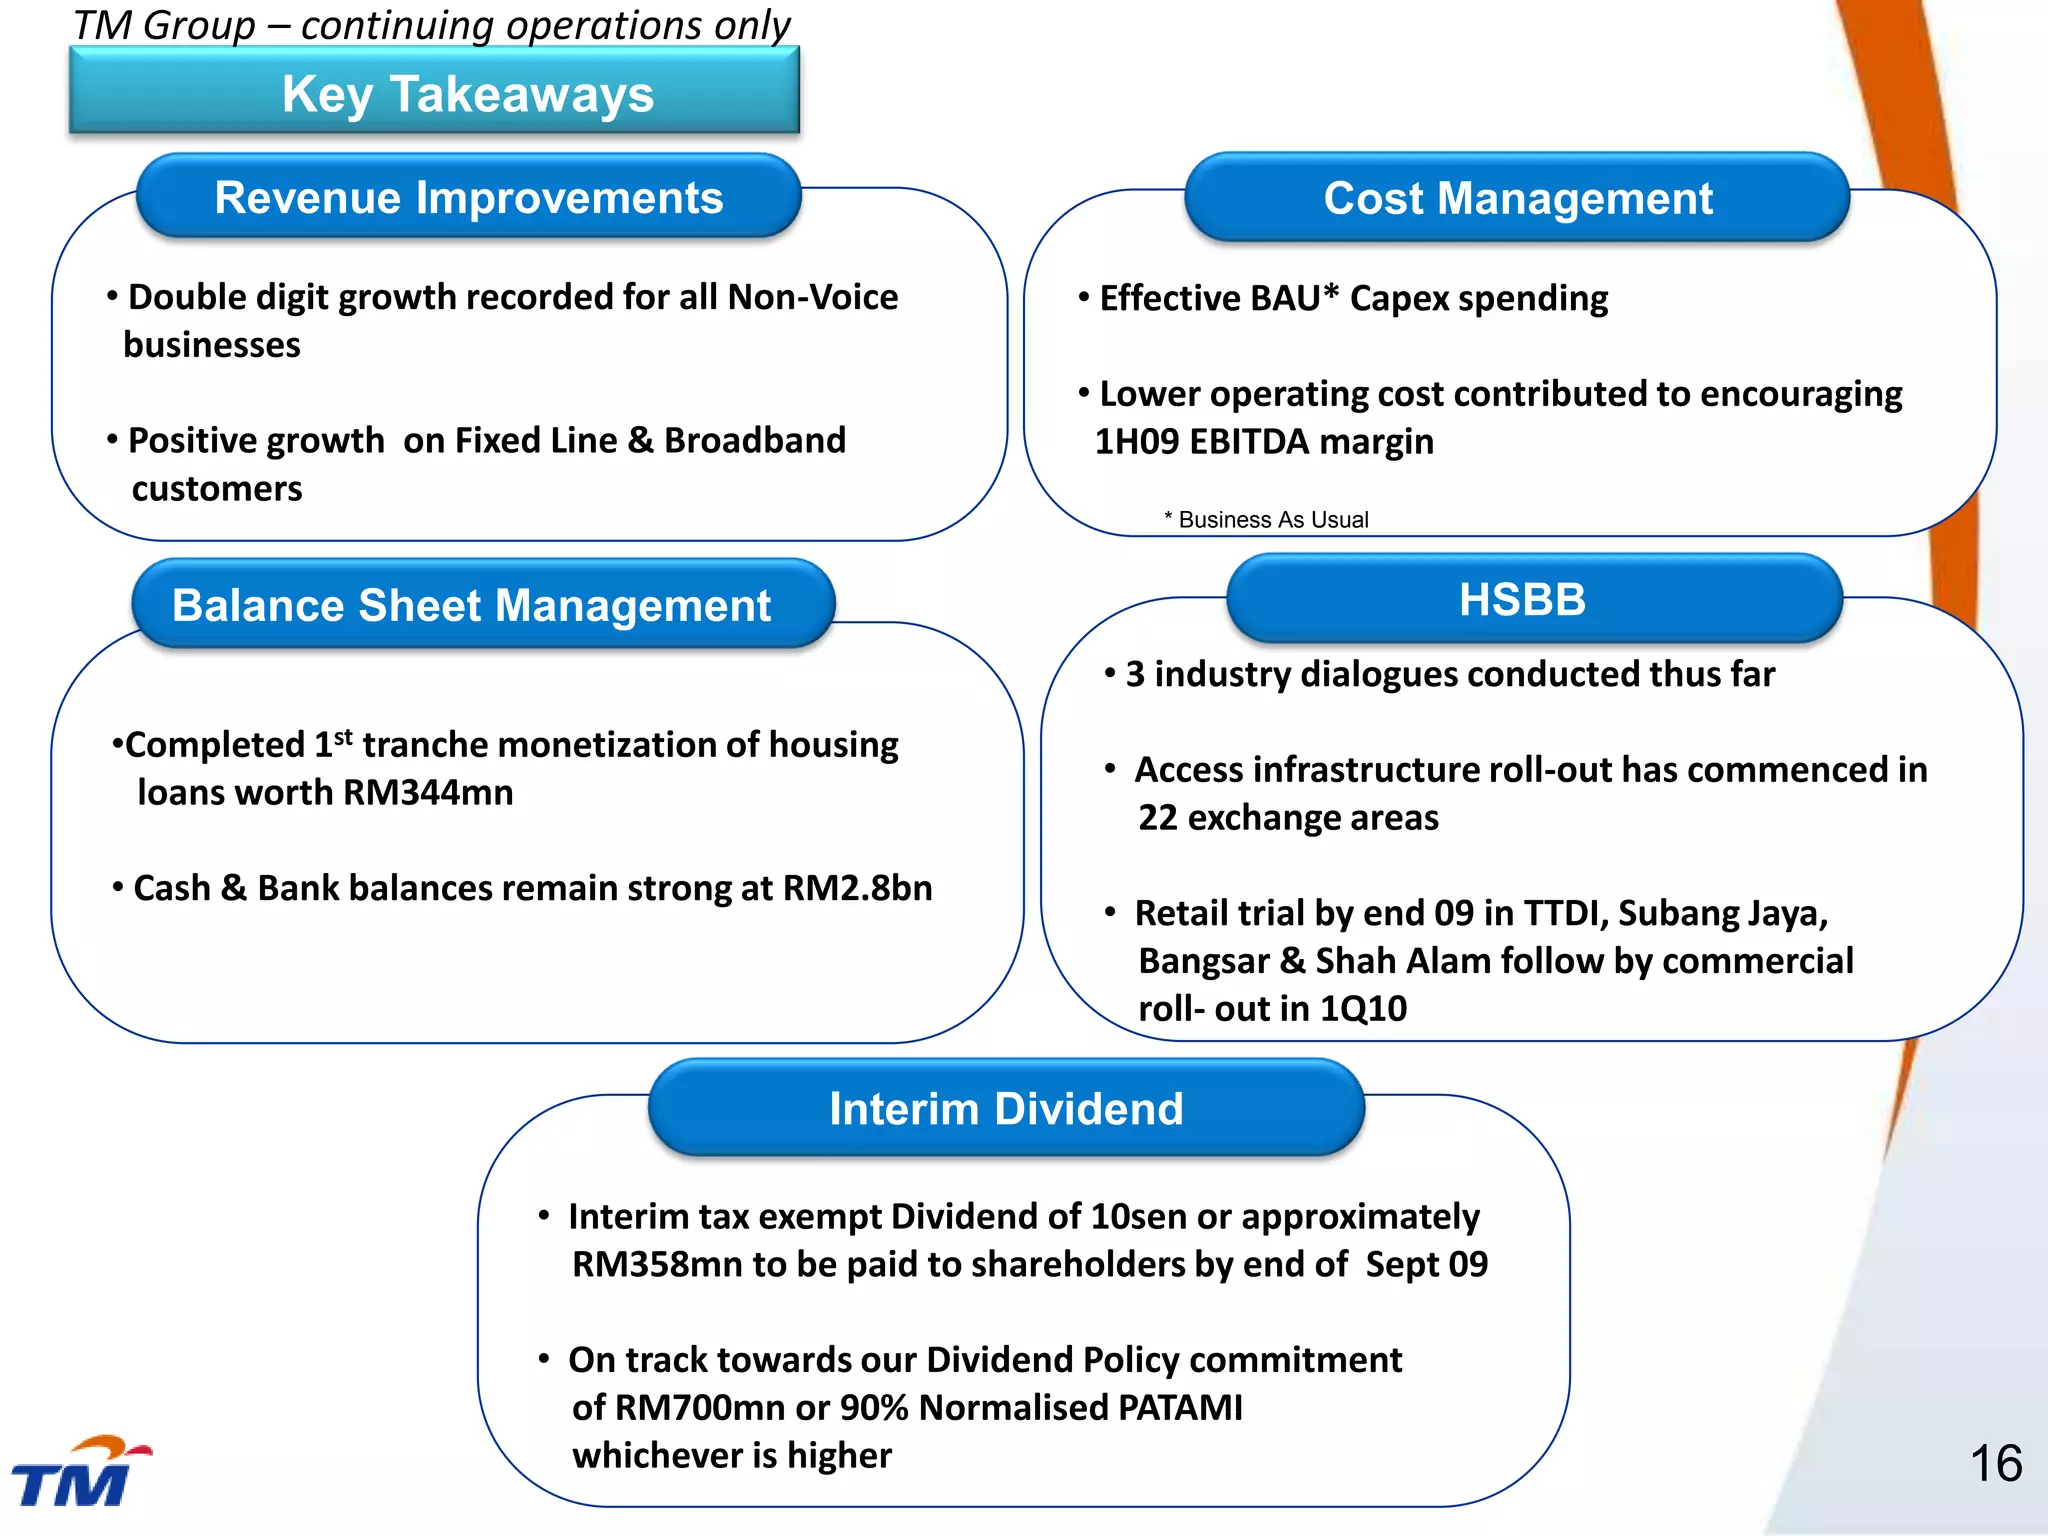
TELEKOM MALAYSIA BERHAD
1H 2009 RESULTS                       (TM Group – continuing operations only)*


                                                                                 21 August 2009
* Results of TM Group post demerger
Disclaimer
This presentation is not and does not constitute an offer, invitation, solicitation or recommendation to subscribe for, or purchase, any securities
and neither this presentation nor anything contained in it shall form the basis of, or be relied on in connection with any contract or commitment or
investment decision.
This presentation has been prepared solely for use at this presentation. By your continued attendance at this presentation, you are deemed to
have agreed and confirmed to Telekom Malaysia Berhad (the “Company”) that: (a) you agree not to trade in any securities of the Company or its
respective affiliates until the public disclosure of the information contained herein; and (b) you agree to maintain absolute confidentiality
regarding the information disclosed in this presentation until the public disclosure of such information, or unless you have been otherwise
notified by the Company.
Reliance should not be placed on the information or opinions contained in this presentation or on its completeness. This presentation does not
take into consideration the investment objectives, financial situation or particular needs of any particular investor.
No representation or warranty, express or implied, is made as to the fairness, accuracy, completeness or correctness of the information,
opinions and conclusions contained in this presentation. None of the Company and its affiliates and related bodies corporate, and their
respective officers, directors, employees and agents disclaim any liability (including, without limitation, any liability arising from fault or
negligence) for any loss arising from any use of this presentation or its contents or otherwise arising in connection with it.
This presentation contains projections and “forward-looking statements” relating to the Company’s business and the sectors in which the
Company operates. These forward-looking statements include statements relating to the Company’s performance. These statements reflect the
current views of the Company with respect to future events and are subject to certain risks, uncertainties and assumptions. It is important to note
that actual results could differ materially from those anticipated in these forward looking statements. The Company does not undertake to inform
you of any matters or information which may come to light or be brought to the Company’s attention after the date hereof.
The forecasts and other forward-looking statements set out in this presentation are based on a number of estimates and assumptions that are
subject to business, economic and competitive uncertainties and contingencies, with respect to future business decisions, which are subject to
change and in many cases outside the control of the Company. The directors and officers of the Company believe that they have prepared the
forecasts with due care and attention and consider all best estimates and assumptions when taken as a whole to be reasonable at the time of
preparing the presentation. However, the Company’s forecasts presented in this presentation may vary from actual financial results, and these
variations may be material and, accordingly, neither the Company nor its directors or officers can give any assurance that the forecast
performance in the forecasts or any forward-looking statement contained in this presentation will be achieved. Details of the forecasts and the
assumptions on which they are based are set out in the presentation.
This presentation may not be copied or otherwise reproduced without the written consent of the Company.


                                                                                                                                               2
                                                                                                                                                       2
TM Group – continuing operations only
         Key 1H 2009 Highlights
                                                              +2.9%
                                        REVENUE                                                              QoQ
                                        RM mn                                                                             +1.1%
                                                                             4,234
                                                      4,115                                                           2,105        2,129
       Revenue up 2.9% in                                                                                             2,105           2,129

       challenging market                            1H08                     1H09                                    1Q09         2Q09

       supported strongly by                                                                                 YoY          +0.9%
       non-voice revenue growth           8.6%                                                                        2,109            2,129
                                                                                                                                    2,129
                                                     17.2%              13.3%             19.6%                       2,109


                                           Voice      Data                  Internet       Others                     2Q08         2Q09


                                                               EBITDA                                       PATAMI
       EBITDA margin better than full-year                    RM mn
                                                                             +17.3%

       guidance of low to mid 30s due to lower
                                                                                        1,640                         +28.2%
       operating cost                                                   1,398
                                                                                                                                    294
                                                                        33.0              37.9                      229

                                                                      1H08             1H09                    1H08                1H09
                                                                      Ebitda Margin (%)


                                                        Broadband*                                        Fixed Line       +0.1%
       Streamyx customers grew to 1.370 million       In thousand             +18.4%                  In thousand
       with fixed line recorded its first positive                                                                    4,316
                                                                                                                                          4,320
       growth backed by higher demand from                             1,157           1,370

       Business & Residential customers                                1H08            1H09                           1H08               1H09
                                                       * Exclude hotspots


                                                              Capex
       Cost management remains as key initiative                                                             -27.2%
                                                              RM mn
       and evident through lower Capex spending                                                     714
                                                                                                                          520
       for BAU but expect higher spending in                  HSBB (Gross)                                                                428
                                                                                                                                                  3
                                                              BAU (Business As Usual)
       2H09 mainly for HSBB                                                                         1H08                          1H09
TM Group – continuing operations only
  Key 1H 2009 Performance Highlights                                         Higher 1H09 EBITDA margin on the back of higher revenue
                                                                             & lower cost

                                                                                                                  Reported

    RM mn                                                                      Growth                                 Growth                            Growth
                                           2Q09              1Q09                                    2Q08                        1H09        1H08
                                                                               Q on Q                                 Y on Y                           YTD on YTD

  Revenue
  Revenue                                 2,127.9
                                         2,129.0           2,105.4
                                                          2,105.4                  +1.1%
                                                                                  +1.1%            2,109.2
                                                                                                   2,109.2               +0.9%
                                                                                                                        +0.9%    4,234.4
                                                                                                                                  4,233.4   4,115.1          +2.9%
                                                                                                                                                           +2.9%

  EBITDA
  EBITDA                                  824.1            816.2                   +1.0%             787.0              +4.7%    1,640.3    1,398.5        +17.3%

  EBITDA margin
  EBITDA margin                           35.8%
                                          37.5%             38.3%
                                                            38.3%                  -2.5pp
                                                                                  -0.8pp            36.0%               -0.2pp
                                                                                                                        +1.5pp     37.0%
                                                                                                                                 37.9%        33.0%
                                                                                                                                            33.0%           +4.0
                                                                                                                                                           +4.9pp

  Depreciation
  Depreciation                             531.2
                                           528.5             519.7
                                                             517.1                 +2.2%
                                                                                  +2.2%              540.9
                                                                                                     534.8               -1.8%
                                                                                                                        -1.2%     1,050.9
                                                                                                                                 1,045.6     1,035.8
                                                                                                                                            1,025.9          +1.5%
                                                                                                                                                            +1.9%

  Net Finance Cost
  Net Finance Cost                         57.4              30.2                 90.1%              42.4               35.4%    87.6       168.5          -48.0%

  PATAMI Loss
  FX ( Gain)                             (123.2)             175.5               -170.2%             74.9               -264.5    52.3      (43.9)         219.1%

  Profit Before Tax
  Profit Before Tax                        358.9             91.3                 +293.1%            128.8             +178.6%   450.2      238.1          +89.1%
  Broadband Customers
  PATAMI                                   266.0             27.7                +860.3%             114.7             +131.9    293.7      229.1          +28.2%
  (‘000)
  Fixed Line Customers
  Broadband* Customers
  (‘000)
                                           1,370             1,333                +2.8%
                                                                                  +2.8%              1,157              +18.4%
                                                                                                                        +18.4%   1,370
                                                                                                                                  1,370     1,157
                                                                                                                                             1,157         +18.4%
                                                                                                                                                           +18.4%
  (‘000)
  Fixed Line Customers
  (‘000)                                   4,320             4,290                +0.7%              4,316              +0.1%    4,320      4,316          +0.1%

           * Exclude Hotspot Customers & Net of Churn
           Note:
           • EBITDA Margin is calculated as percentage of EBITDA against Total Revenue + Other Operating Income
                                                                                                                                                                     4
TM Group – continuing operations only
              Normalised EBITDA


In RM mn                                              1Q09    2Q09     2Q08      1H09     1H 08

Reported EBITDA                                       816.2   824.1    787.0    1,640.3   1,398.5

      ESOS Cost                                        4.5     7.4     33.2      11.9      93.6

      (Appreciation)/ Diminution in value of quoted   (6.2)   (45.0)   10.3     (51.2)     58.0
      shares

      USP prior year adjustment                         -       -      (35.2)      -      (35.2)
PATAMI
      Provision for VOIP Doubtful Debts                 -       -        -         -      112.9

      (Gain) / Loss on sale of Assets                   -     (26.8)   (14.1)   (26.8)    (25.7)

Normalised EBITDA                                     814.5   759.7    781.2    1,574.2   1,602.1

Normalised EBITDA Margin                              38.2%   34.6%    35.8%    36.4%     37.8%

Reported EBITDA Margin                                38.3%   37.5%    36.0%    37.9%     33.0%


                                                                                                    5
TM Group – continuing operations only
          Normalised PATAMI


In RM mn                                          1Q 09   2Q 09     2Q 08    1H 09    1H 08

Reported PATAMI                                   27.7    266.0     114.7    293.7    229.1
      ESOS Cost                                    4.5     7.4      33.1     11.9     93.3
      (Appreciation)/ Diminution in value of      (6.2)   (45.0)    10.3     (51.2)   58.0
      quoted shares
      USP prior year adjustment                     -        -      (26.0)     -      (26.0)
      Provision for VOIP Doubtful Debts             -        -        -        -      83.6
      (Gain) / Loss on sale of Assets               -     (26.8)    (14.1)   (26.8)   (25.7)
      Unrealised Forex Loss / (Gain) on Long      175.5   (123.2)   74.9     52.3     (43.9)
      Term Loans
      Loss termination of Ranged Accrual / Long     -        -      15.9       -      82.0
      Dated Swap
      Reversal of Excess Current / Deferred Tax   (1.6)    0.6      (51.9)   (1.0)    (51.9)
Normalised PATAMI                                 199.9    79.0     156.8    278.9    398.5


                                                                                               6
TM Group – continuing operations only
                                                                            Retail remains key contributor for the Group with growth
    Total Revenue by Line Of Business
                                                                            from Wholesale & Global
     RM mn                                   +2.9%
                                                                                                                                               1H09
                        4,115                                   4,234


                                         +0.9%
    RM mn                                                +1.1%                                                                                   1H08

                 2,109                      2,105                      2,129


                                                                                                              Note: Breakdown is before inter-co elimination
                                                                                                                                                               77
       Note: Total revenue is after inter-co elimination. Revenue of segment is before inter-co elimination
TM Group – continuing operations only
                                                                              Efforts on Internet & Data continued to drive Non-Voice
            Total Revenue by Product
                                                                              contribution to total revenue
 RM mn
                                         +2.9%                                                               1H09

                     4,115                                    4,234


                                     +0.9%
RM mn                                                                                                        1H08
                                                    +1.1%
             2,109                      2,105                     2,129


                                                                                                                                        8
                                                                                                                                        8
  Note: Total revenue and revenue of segment are after inter-co elimination
TM Group – continuing operations only
                                                                          QoQ Business & Residential fixed customers recorded
                       PHYSICAL HIGHLIGHTS
                                                                          positive growth
      Broadband* Customers Growth
In thousand
                                         +18.4%

                                                                          1,370
                                               1,280       1,333
                               1,229
               1,157


 * Exclude Hotspots


              Fixed Customers Growth
                                               +0.1%

In thousand
                       -0.2%           -0.2%           -0.2%           +0.7%

                  4,316          4,308            4,297        4,290           4,320

                                                                                       ARPU (RM)                       2Q 2008   3Q 2008   4Q 2008   1Q 2009   2Q 2009
                                                                       +1.5%           Business*                         85        79        77        74        78
                                                                                       Residential*                      25        24        23        21        21
                                                                                       Streamyx Broadband **             93        94        90        87        88
                                                                                         * Call usage only
                                                                                         ** Streamyx Gross ARPU only
                                                                       +0.3%


                                                                                                                                                                    9
TM Group – continuing operations only
                          Revenue growth YoY despite challenging economy
   Total Revenue By Products
            Retail

                              Revenue by Product
                                                                                 Revenue by Business Unit
  RM mn
                                      +2.8%
                                                                                              1H09
                                                  3,389
                    3,296


                                     44%                        51%


                                     56%                        49%


                                                                        Note : Breakdown is before inter company elimination


                                     +3.6%
  RM mn
                                                +5.9%
               1,682                                    1,743
                                       1,646


                             45%                                  53%
                                                50%


                             55%                50%               47%


    Note: Based on after inter-co elimination                                                                                  10
TM Group – continuing operations only
                     Wholesale                                    Overall growth driven by Data & Leased services
                              Revenue by Product                                                      Revenue by Customer Segment
 RM mn                        +16.8%
                                                    467

                   400*


                                                                63%
                               59%


                               41%                              37%


 RM mn                           +30.8%
                                           +20.3%
                                                          255

                                     212
            195*

                                                                  63%
                        58%                  64%


                       42%                                        37%
                                             36%
                                                                                                        DC : Domestic Carrier
                                                                                                        ASP : Application Service Provider


   •Prior year comparative has been adjusted to be consistent with the business realignment in 2Q09
                                                                                                                                             11
    Others : Include internet
TM Group – continuing operations only
                                    Focusing on higher Data revenue with higher margin & long
               Global
                                    term customer commitment while sustaining Voice business

                        Revenue by Product                                                             Revenue by Region
  RM mn                    +5.8%                                                                       1H09

                                             436
                 412*


                            45%                           50%


                            55%                          50%


                           -10.8%                                                                       1H08
RM mn
                                        -10.4%
          231*                 230
                                                   206

                     46%               44%

                                                            56%


                     54%
                                       56%
                                                            44%


    •Prior year comparative has been adjusted to be consistent with the business realignment in 2Q09
                                                                                                                           12
    Others : Include internet
TM Group – continuing operations only
                Cost % of Revenue               Cost for 1H09 continued to be managed effectively
                   Cost % Of Revenue
RM mn


   RM3,872.3                        RM3,732.1                            RM1,833.0             RM1,899.1

     94.1%                           88.1%                                87.1%                 89.2%


        Total Cost / Revenue ( %)
                                                                                                           13
TM Group – continuing operations only
                                                                    Capex efficiency resulted in lower BAU Capex.
     GROUP CAPITAL EXPENDITURE
                                                                    HSBB Capex building up momentum
  RM mn                                                                                                                    HSBB Capex
                                                948
                                                                                                         RM mn

                                                                                                                     516
                  714
                                -27.2%

                                                                               1
                                                             520                                                                        326


                                                                                                                            102


                  17.4                          12.3


           BAU Capex                                                                                                       HSBB Milestone
                    -36.4%
RM mn                                    -18.6%

          343            371                    +38.5%

                                                           302

                                         218


          17.1           17.6            10.3                14.2

        BAU Capex / Revenue ( %)
                                                 1
                                                     Others include building, land, moveable plants & other assets                            14
TM Group – continuing operations only
Group Balance Sheet & Key Financial Ratios                                   Cash position remains strong post capital repayment

                                                  As at 30 June 2009                  As at 31 Dec 2008
  RM Million
  Shareholders’ Funds                                            6,835.9                      10,248.1                            Lower Shareholder Funds due to
  Minority Interests                                               127.8                         226.5                            Capital Repayment of RM3.506bn

  Deferred & Long Term Liabilities                               8,928.5                       8,587.3
                                                                                                                                  Deferred Income higher mainly due
         Long Term Borrowings                                    7,033.8                       6,965.1                            to HSBB of RM185mn
         Deferred Tax                                            1,435.7                       1,362.0
         Deferred Income                                           459.0                         260.2                            Cash & Bank Balances remain strong
                                                                15,892.2                      19,061.9                            at RM2.821bn post final dividend
                                                                                                                                  2008 & capital repayment

  Current Assets                                                 6,095.6                       9,412.4
         Trade Receivables                                       2,241.6                       2,127.9
         Other Receivables                                         656.4                         763.4
         Amount due from Axiata                                        0                       4,025.0
         Cash & Bank Balances                                    2,821.3                       2,095.2
                                                                                                                       RM mn
         Others                                                    376.3                         400.9                                                    2
                                                                                                                                                                                  USD denominated

                                                                                                                                                                                  RM denominated
  Current Liabilities                                            3,209.7                       3,471.3
         Trade and other Payables                                2,535.8                       2,812.6                            1                                                 3

         Short Term Borrowings                                      41.9                          34.9
         Others                                                    632.0                         623.8
  Net Current Assets                                             2,885.9                       5,941.1
                                                                                                                           2010          2013      2014        2018          2025
  Property Plant & Equipment                                    11,664.9                      11,772.1                                   1            2               3
                                                                                                                         Note : USD 300m; USD 500m;       USD 300m; Fx Rate 3.515
  Other Non-current Assets                                       1,341.4                       1,348.7
                                                                15,892.2                      19,061.9

                                                           30 June 09*     31 Dec 08                                                   30 June 09*               31 Dec 08
                                                             30 June 09    31 Dec 08                                                      30 June 09              31 Dec 08
               Return on Invested Capital                       7.33%        4.50%          Gross Debt/ Equity**                                 1.03                      0.68
                                1                 1
               Return on Equity                                 6.53%        6.99%          Gross Debt/ Equity***                                1.03                      0.29
               Return on Assets                                 5.67%        3.15%          Net Debt/ Equity**                                   0.62                      0.48
               Current Ratio                                    1.90%         2.71          Net Debt/ Equity***                                  0.62                      0.09
               Debt to EBITDA                                   2.15%         2.45          Net Assets/Share (sen)                              193.4                     296.5
                            1 Based on Normalised PATAMI                      *Annualised           ** Before Amount Due from Axiata         ** *After Amount Due from Axiata                       15
TM Group – continuing operations only
           Key Takeaways
        Revenue Improvements                                                 Cost Management

 • Double digit growth recorded for all Non-Voice         • Effective BAU* Capex spending
  businesses
                                                          • Lower operating cost contributed to encouraging
 • Positive growth on Fixed Line & Broadband               1H09 EBITDA margin
   customers
                                                               * Business As Usual


     Balance Sheet Management                                                        HSBB
                                                           • 3 industry dialogues conducted thus far
  •Completed 1st tranche monetization of housing
                                                           • Access infrastructure roll-out has commenced in
    loans worth RM344mn
                                                             22 exchange areas
  • Cash & Bank balances remain strong at RM2.8bn
                                                           • Retail trial by end 09 in TTDI, Subang Jaya,
                                                             Bangsar & Shah Alam follow by commercial
                                                             roll- out in 1Q10

                                            Interim Dividend

                           • Interim tax exempt Dividend of 10sen or approximately
                             RM358mn to be paid to shareholders by end of Sept 09

                           • On track towards our Dividend Policy commitment
                             of RM700mn or 90% Normalised PATAMI
                             whichever is higher                                                               16
Thank You
  www.tm.com.my
investor@tm.com.my


                     17

Tmq209 present

  • 1.
    TELEKOM MALAYSIA BERHAD 1H2009 RESULTS (TM Group – continuing operations only)* 21 August 2009 * Results of TM Group post demerger
  • 2.
    Disclaimer This presentation isnot and does not constitute an offer, invitation, solicitation or recommendation to subscribe for, or purchase, any securities and neither this presentation nor anything contained in it shall form the basis of, or be relied on in connection with any contract or commitment or investment decision. This presentation has been prepared solely for use at this presentation. By your continued attendance at this presentation, you are deemed to have agreed and confirmed to Telekom Malaysia Berhad (the “Company”) that: (a) you agree not to trade in any securities of the Company or its respective affiliates until the public disclosure of the information contained herein; and (b) you agree to maintain absolute confidentiality regarding the information disclosed in this presentation until the public disclosure of such information, or unless you have been otherwise notified by the Company. Reliance should not be placed on the information or opinions contained in this presentation or on its completeness. This presentation does not take into consideration the investment objectives, financial situation or particular needs of any particular investor. No representation or warranty, express or implied, is made as to the fairness, accuracy, completeness or correctness of the information, opinions and conclusions contained in this presentation. None of the Company and its affiliates and related bodies corporate, and their respective officers, directors, employees and agents disclaim any liability (including, without limitation, any liability arising from fault or negligence) for any loss arising from any use of this presentation or its contents or otherwise arising in connection with it. This presentation contains projections and “forward-looking statements” relating to the Company’s business and the sectors in which the Company operates. These forward-looking statements include statements relating to the Company’s performance. These statements reflect the current views of the Company with respect to future events and are subject to certain risks, uncertainties and assumptions. It is important to note that actual results could differ materially from those anticipated in these forward looking statements. The Company does not undertake to inform you of any matters or information which may come to light or be brought to the Company’s attention after the date hereof. The forecasts and other forward-looking statements set out in this presentation are based on a number of estimates and assumptions that are subject to business, economic and competitive uncertainties and contingencies, with respect to future business decisions, which are subject to change and in many cases outside the control of the Company. The directors and officers of the Company believe that they have prepared the forecasts with due care and attention and consider all best estimates and assumptions when taken as a whole to be reasonable at the time of preparing the presentation. However, the Company’s forecasts presented in this presentation may vary from actual financial results, and these variations may be material and, accordingly, neither the Company nor its directors or officers can give any assurance that the forecast performance in the forecasts or any forward-looking statement contained in this presentation will be achieved. Details of the forecasts and the assumptions on which they are based are set out in the presentation. This presentation may not be copied or otherwise reproduced without the written consent of the Company. 2 2
  • 3.
    TM Group –continuing operations only Key 1H 2009 Highlights +2.9% REVENUE QoQ RM mn +1.1% 4,234 4,115 2,105 2,129 Revenue up 2.9% in 2,105 2,129 challenging market 1H08 1H09 1Q09 2Q09 supported strongly by YoY +0.9% non-voice revenue growth 8.6% 2,109 2,129 2,129 17.2% 13.3% 19.6% 2,109 Voice Data Internet Others 2Q08 2Q09 EBITDA PATAMI EBITDA margin better than full-year RM mn +17.3% guidance of low to mid 30s due to lower 1,640 +28.2% operating cost 1,398 294 33.0 37.9 229 1H08 1H09 1H08 1H09 Ebitda Margin (%) Broadband* Fixed Line +0.1% Streamyx customers grew to 1.370 million In thousand +18.4% In thousand with fixed line recorded its first positive 4,316 4,320 growth backed by higher demand from 1,157 1,370 Business & Residential customers 1H08 1H09 1H08 1H09 * Exclude hotspots Capex Cost management remains as key initiative -27.2% RM mn and evident through lower Capex spending 714 520 for BAU but expect higher spending in HSBB (Gross) 428 3 BAU (Business As Usual) 2H09 mainly for HSBB 1H08 1H09
  • 4.
    TM Group –continuing operations only Key 1H 2009 Performance Highlights Higher 1H09 EBITDA margin on the back of higher revenue & lower cost Reported RM mn Growth Growth Growth 2Q09 1Q09 2Q08 1H09 1H08 Q on Q Y on Y YTD on YTD Revenue Revenue 2,127.9 2,129.0 2,105.4 2,105.4 +1.1% +1.1% 2,109.2 2,109.2 +0.9% +0.9% 4,234.4 4,233.4 4,115.1 +2.9% +2.9% EBITDA EBITDA 824.1 816.2 +1.0% 787.0 +4.7% 1,640.3 1,398.5 +17.3% EBITDA margin EBITDA margin 35.8% 37.5% 38.3% 38.3% -2.5pp -0.8pp 36.0% -0.2pp +1.5pp 37.0% 37.9% 33.0% 33.0% +4.0 +4.9pp Depreciation Depreciation 531.2 528.5 519.7 517.1 +2.2% +2.2% 540.9 534.8 -1.8% -1.2% 1,050.9 1,045.6 1,035.8 1,025.9 +1.5% +1.9% Net Finance Cost Net Finance Cost 57.4 30.2 90.1% 42.4 35.4% 87.6 168.5 -48.0% PATAMI Loss FX ( Gain) (123.2) 175.5 -170.2% 74.9 -264.5 52.3 (43.9) 219.1% Profit Before Tax Profit Before Tax 358.9 91.3 +293.1% 128.8 +178.6% 450.2 238.1 +89.1% Broadband Customers PATAMI 266.0 27.7 +860.3% 114.7 +131.9 293.7 229.1 +28.2% (‘000) Fixed Line Customers Broadband* Customers (‘000) 1,370 1,333 +2.8% +2.8% 1,157 +18.4% +18.4% 1,370 1,370 1,157 1,157 +18.4% +18.4% (‘000) Fixed Line Customers (‘000) 4,320 4,290 +0.7% 4,316 +0.1% 4,320 4,316 +0.1% * Exclude Hotspot Customers & Net of Churn Note: • EBITDA Margin is calculated as percentage of EBITDA against Total Revenue + Other Operating Income 4
  • 5.
    TM Group –continuing operations only Normalised EBITDA In RM mn 1Q09 2Q09 2Q08 1H09 1H 08 Reported EBITDA 816.2 824.1 787.0 1,640.3 1,398.5 ESOS Cost 4.5 7.4 33.2 11.9 93.6 (Appreciation)/ Diminution in value of quoted (6.2) (45.0) 10.3 (51.2) 58.0 shares USP prior year adjustment - - (35.2) - (35.2) PATAMI Provision for VOIP Doubtful Debts - - - - 112.9 (Gain) / Loss on sale of Assets - (26.8) (14.1) (26.8) (25.7) Normalised EBITDA 814.5 759.7 781.2 1,574.2 1,602.1 Normalised EBITDA Margin 38.2% 34.6% 35.8% 36.4% 37.8% Reported EBITDA Margin 38.3% 37.5% 36.0% 37.9% 33.0% 5
  • 6.
    TM Group –continuing operations only Normalised PATAMI In RM mn 1Q 09 2Q 09 2Q 08 1H 09 1H 08 Reported PATAMI 27.7 266.0 114.7 293.7 229.1 ESOS Cost 4.5 7.4 33.1 11.9 93.3 (Appreciation)/ Diminution in value of (6.2) (45.0) 10.3 (51.2) 58.0 quoted shares USP prior year adjustment - - (26.0) - (26.0) Provision for VOIP Doubtful Debts - - - - 83.6 (Gain) / Loss on sale of Assets - (26.8) (14.1) (26.8) (25.7) Unrealised Forex Loss / (Gain) on Long 175.5 (123.2) 74.9 52.3 (43.9) Term Loans Loss termination of Ranged Accrual / Long - - 15.9 - 82.0 Dated Swap Reversal of Excess Current / Deferred Tax (1.6) 0.6 (51.9) (1.0) (51.9) Normalised PATAMI 199.9 79.0 156.8 278.9 398.5 6
  • 7.
    TM Group –continuing operations only Retail remains key contributor for the Group with growth Total Revenue by Line Of Business from Wholesale & Global RM mn +2.9% 1H09 4,115 4,234 +0.9% RM mn +1.1% 1H08 2,109 2,105 2,129 Note: Breakdown is before inter-co elimination 77 Note: Total revenue is after inter-co elimination. Revenue of segment is before inter-co elimination
  • 8.
    TM Group –continuing operations only Efforts on Internet & Data continued to drive Non-Voice Total Revenue by Product contribution to total revenue RM mn +2.9% 1H09 4,115 4,234 +0.9% RM mn 1H08 +1.1% 2,109 2,105 2,129 8 8 Note: Total revenue and revenue of segment are after inter-co elimination
  • 9.
    TM Group –continuing operations only QoQ Business & Residential fixed customers recorded PHYSICAL HIGHLIGHTS positive growth Broadband* Customers Growth In thousand +18.4% 1,370 1,280 1,333 1,229 1,157 * Exclude Hotspots Fixed Customers Growth +0.1% In thousand -0.2% -0.2% -0.2% +0.7% 4,316 4,308 4,297 4,290 4,320 ARPU (RM) 2Q 2008 3Q 2008 4Q 2008 1Q 2009 2Q 2009 +1.5% Business* 85 79 77 74 78 Residential* 25 24 23 21 21 Streamyx Broadband ** 93 94 90 87 88 * Call usage only ** Streamyx Gross ARPU only +0.3% 9
  • 10.
    TM Group –continuing operations only Revenue growth YoY despite challenging economy Total Revenue By Products Retail Revenue by Product Revenue by Business Unit RM mn +2.8% 1H09 3,389 3,296 44% 51% 56% 49% Note : Breakdown is before inter company elimination +3.6% RM mn +5.9% 1,682 1,743 1,646 45% 53% 50% 55% 50% 47% Note: Based on after inter-co elimination 10
  • 11.
    TM Group –continuing operations only Wholesale Overall growth driven by Data & Leased services Revenue by Product Revenue by Customer Segment RM mn +16.8% 467 400* 63% 59% 41% 37% RM mn +30.8% +20.3% 255 212 195* 63% 58% 64% 42% 37% 36% DC : Domestic Carrier ASP : Application Service Provider •Prior year comparative has been adjusted to be consistent with the business realignment in 2Q09 11 Others : Include internet
  • 12.
    TM Group –continuing operations only Focusing on higher Data revenue with higher margin & long Global term customer commitment while sustaining Voice business Revenue by Product Revenue by Region RM mn +5.8% 1H09 436 412* 45% 50% 55% 50% -10.8% 1H08 RM mn -10.4% 231* 230 206 46% 44% 56% 54% 56% 44% •Prior year comparative has been adjusted to be consistent with the business realignment in 2Q09 12 Others : Include internet
  • 13.
    TM Group –continuing operations only Cost % of Revenue Cost for 1H09 continued to be managed effectively Cost % Of Revenue RM mn RM3,872.3 RM3,732.1 RM1,833.0 RM1,899.1 94.1% 88.1% 87.1% 89.2% Total Cost / Revenue ( %) 13
  • 14.
    TM Group –continuing operations only Capex efficiency resulted in lower BAU Capex. GROUP CAPITAL EXPENDITURE HSBB Capex building up momentum RM mn HSBB Capex 948 RM mn 516 714 -27.2% 1 520 326 102 17.4 12.3 BAU Capex HSBB Milestone -36.4% RM mn -18.6% 343 371 +38.5% 302 218 17.1 17.6 10.3 14.2 BAU Capex / Revenue ( %) 1 Others include building, land, moveable plants & other assets 14
  • 15.
    TM Group –continuing operations only Group Balance Sheet & Key Financial Ratios Cash position remains strong post capital repayment As at 30 June 2009 As at 31 Dec 2008 RM Million Shareholders’ Funds 6,835.9 10,248.1 Lower Shareholder Funds due to Minority Interests 127.8 226.5 Capital Repayment of RM3.506bn Deferred & Long Term Liabilities 8,928.5 8,587.3 Deferred Income higher mainly due Long Term Borrowings 7,033.8 6,965.1 to HSBB of RM185mn Deferred Tax 1,435.7 1,362.0 Deferred Income 459.0 260.2 Cash & Bank Balances remain strong 15,892.2 19,061.9 at RM2.821bn post final dividend 2008 & capital repayment Current Assets 6,095.6 9,412.4 Trade Receivables 2,241.6 2,127.9 Other Receivables 656.4 763.4 Amount due from Axiata 0 4,025.0 Cash & Bank Balances 2,821.3 2,095.2 RM mn Others 376.3 400.9 2 USD denominated RM denominated Current Liabilities 3,209.7 3,471.3 Trade and other Payables 2,535.8 2,812.6 1 3 Short Term Borrowings 41.9 34.9 Others 632.0 623.8 Net Current Assets 2,885.9 5,941.1 2010 2013 2014 2018 2025 Property Plant & Equipment 11,664.9 11,772.1 1 2 3 Note : USD 300m; USD 500m; USD 300m; Fx Rate 3.515 Other Non-current Assets 1,341.4 1,348.7 15,892.2 19,061.9 30 June 09* 31 Dec 08 30 June 09* 31 Dec 08 30 June 09 31 Dec 08 30 June 09 31 Dec 08 Return on Invested Capital 7.33% 4.50% Gross Debt/ Equity** 1.03 0.68 1 1 Return on Equity 6.53% 6.99% Gross Debt/ Equity*** 1.03 0.29 Return on Assets 5.67% 3.15% Net Debt/ Equity** 0.62 0.48 Current Ratio 1.90% 2.71 Net Debt/ Equity*** 0.62 0.09 Debt to EBITDA 2.15% 2.45 Net Assets/Share (sen) 193.4 296.5 1 Based on Normalised PATAMI *Annualised ** Before Amount Due from Axiata ** *After Amount Due from Axiata 15
  • 16.
    TM Group –continuing operations only Key Takeaways Revenue Improvements Cost Management • Double digit growth recorded for all Non-Voice • Effective BAU* Capex spending businesses • Lower operating cost contributed to encouraging • Positive growth on Fixed Line & Broadband 1H09 EBITDA margin customers * Business As Usual Balance Sheet Management HSBB • 3 industry dialogues conducted thus far •Completed 1st tranche monetization of housing • Access infrastructure roll-out has commenced in loans worth RM344mn 22 exchange areas • Cash & Bank balances remain strong at RM2.8bn • Retail trial by end 09 in TTDI, Subang Jaya, Bangsar & Shah Alam follow by commercial roll- out in 1Q10 Interim Dividend • Interim tax exempt Dividend of 10sen or approximately RM358mn to be paid to shareholders by end of Sept 09 • On track towards our Dividend Policy commitment of RM700mn or 90% Normalised PATAMI whichever is higher 16
  • 17.
    Thank You www.tm.com.my investor@tm.com.my 17