BYD SWOT Analysis and In-Depth Insights 2024.pptxmikemetalprod
Indepth analysis of the BYD 2024
BYD (Build Your Dreams) is a Chinese automaker and battery manufacturer that has snowballed over the past two decades to become a significant player in electric vehicles and global clean energy technology.
This SWOT analysis examines BYD's strengths, weaknesses, opportunities, and threats as it competes in the fast-changing automotive and energy storage industries.
Founded in 1995 and headquartered in Shenzhen, BYD started as a battery company before expanding into automobiles in the early 2000s.
Initially manufacturing gasoline-powered vehicles, BYD focused on plug-in hybrid and fully electric vehicles, leveraging its expertise in battery technology.
Today, BYD is the world’s largest electric vehicle manufacturer, delivering over 1.2 million electric cars globally. The company also produces electric buses, trucks, forklifts, and rail transit.
On the energy side, BYD is a major supplier of rechargeable batteries for cell phones, laptops, electric vehicles, and energy storage systems.
when will pi network coin be available on crypto exchange.DOT TECH
There is no set date for when Pi coins will enter the market.
However, the developers are working hard to get them released as soon as possible.
Once they are available, users will be able to exchange other cryptocurrencies for Pi coins on designated exchanges.
But for now the only way to sell your pi coins is through verified pi vendor.
Here is the telegram contact of my personal pi vendor
@Pi_vendor_247
how to sell pi coins in all Africa Countries.DOT TECH
Yes. You can sell your pi network for other cryptocurrencies like Bitcoin, usdt , Ethereum and other currencies And this is done easily with the help from a pi merchant.
What is a pi merchant ?
Since pi is not launched yet in any exchange. The only way you can sell right now is through merchants.
A verified Pi merchant is someone who buys pi network coins from miners and resell them to investors looking forward to hold massive quantities of pi coins before mainnet launch in 2026.
I will leave the telegram contact of my personal pi merchant to trade with.
@Pi_vendor_247
The European Unemployment Puzzle: implications from population agingGRAPE
We study the link between the evolving age structure of the working population and unemployment. We build a large new Keynesian OLG model with a realistic age structure, labor market frictions, sticky prices, and aggregate shocks. Once calibrated to the European economy, we quantify the extent to which demographic changes over the last three decades have contributed to the decline of the unemployment rate. Our findings yield important implications for the future evolution of unemployment given the anticipated further aging of the working population in Europe. We also quantify the implications for optimal monetary policy: lowering inflation volatility becomes less costly in terms of GDP and unemployment volatility, which hints that optimal monetary policy may be more hawkish in an aging society. Finally, our results also propose a partial reversal of the European-US unemployment puzzle due to the fact that the share of young workers is expected to remain robust in the US.
Introduction to Indian Financial System ()Avanish Goel
The financial system of a country is an important tool for economic development of the country, as it helps in creation of wealth by linking savings with investments.
It facilitates the flow of funds form the households (savers) to business firms (investors) to aid in wealth creation and development of both the parties
what is the best method to sell pi coins in 2024DOT TECH
The best way to sell your pi coins safely is trading with an exchange..but since pi is not launched in any exchange, and second option is through a VERIFIED pi merchant.
Who is a pi merchant?
A pi merchant is someone who buys pi coins from miners and pioneers and resell them to Investors looking forward to hold massive amounts before mainnet launch in 2026.
I will leave the telegram contact of my personal pi merchant to trade pi coins with.
@Pi_vendor_247
how to sell pi coins on Bitmart crypto exchangeDOT TECH
Yes. Pi network coins can be exchanged but not on bitmart exchange. Because pi network is still in the enclosed mainnet. The only way pioneers are able to trade pi coins is by reselling the pi coins to pi verified merchants.
A verified merchant is someone who buys pi network coins and resell it to exchanges looking forward to hold till mainnet launch.
I will leave the telegram contact of my personal pi merchant to trade with.
@Pi_vendor_247
If you are looking for a pi coin investor. Then look no further because I have the right one he is a pi vendor (he buy and resell to whales in China). I met him on a crypto conference and ever since I and my friends have sold more than 10k pi coins to him And he bought all and still want more. I will drop his telegram handle below just send him a message.
@Pi_vendor_247
how to sell pi coins effectively (from 50 - 100k pi)DOT TECH
Anywhere in the world, including Africa, America, and Europe, you can sell Pi Network Coins online and receive cash through online payment options.
Pi has not yet been launched on any exchange because we are currently using the confined Mainnet. The planned launch date for Pi is June 28, 2026.
Reselling to investors who want to hold until the mainnet launch in 2026 is currently the sole way to sell.
Consequently, right now. All you need to do is select the right pi network provider.
Who is a pi merchant?
An individual who buys coins from miners on the pi network and resells them to investors hoping to hang onto them until the mainnet is launched is known as a pi merchant.
debuts.
I'll provide you the Telegram username
@Pi_vendor_247
What price will pi network be listed on exchangesDOT TECH
The rate at which pi will be listed is practically unknown. But due to speculations surrounding it the predicted rate is tends to be from 30$ — 50$.
So if you are interested in selling your pi network coins at a high rate tho. Or you can't wait till the mainnet launch in 2026. You can easily trade your pi coins with a merchant.
A merchant is someone who buys pi coins from miners and resell them to Investors looking forward to hold massive quantities till mainnet launch.
I will leave the telegram contact of my personal pi vendor to trade with.
@Pi_vendor_247
how to sell pi coins in South Korea profitably.DOT TECH
Yes. You can sell your pi network coins in South Korea or any other country, by finding a verified pi merchant
What is a verified pi merchant?
Since pi network is not launched yet on any exchange, the only way you can sell pi coins is by selling to a verified pi merchant, and this is because pi network is not launched yet on any exchange and no pre-sale or ico offerings Is done on pi.
Since there is no pre-sale, the only way exchanges can get pi is by buying from miners. So a pi merchant facilitates these transactions by acting as a bridge for both transactions.
How can i find a pi vendor/merchant?
Well for those who haven't traded with a pi merchant or who don't already have one. I will leave the telegram id of my personal pi merchant who i trade pi with.
Tele gram: @Pi_vendor_247
#pi #sell #nigeria #pinetwork #picoins #sellpi #Nigerian #tradepi #pinetworkcoins #sellmypi
what is the future of Pi Network currency.DOT TECH
The future of the Pi cryptocurrency is uncertain, and its success will depend on several factors. Pi is a relatively new cryptocurrency that aims to be user-friendly and accessible to a wide audience. Here are a few key considerations for its future:
Message: @Pi_vendor_247 on telegram if u want to sell PI COINS.
1. Mainnet Launch: As of my last knowledge update in January 2022, Pi was still in the testnet phase. Its success will depend on a successful transition to a mainnet, where actual transactions can take place.
2. User Adoption: Pi's success will be closely tied to user adoption. The more users who join the network and actively participate, the stronger the ecosystem can become.
3. Utility and Use Cases: For a cryptocurrency to thrive, it must offer utility and practical use cases. The Pi team has talked about various applications, including peer-to-peer transactions, smart contracts, and more. The development and implementation of these features will be essential.
4. Regulatory Environment: The regulatory environment for cryptocurrencies is evolving globally. How Pi navigates and complies with regulations in various jurisdictions will significantly impact its future.
5. Technology Development: The Pi network must continue to develop and improve its technology, security, and scalability to compete with established cryptocurrencies.
6. Community Engagement: The Pi community plays a critical role in its future. Engaged users can help build trust and grow the network.
7. Monetization and Sustainability: The Pi team's monetization strategy, such as fees, partnerships, or other revenue sources, will affect its long-term sustainability.
It's essential to approach Pi or any new cryptocurrency with caution and conduct due diligence. Cryptocurrency investments involve risks, and potential rewards can be uncertain. The success and future of Pi will depend on the collective efforts of its team, community, and the broader cryptocurrency market dynamics. It's advisable to stay updated on Pi's development and follow any updates from the official Pi Network website or announcements from the team.
US Economic Outlook - Being Decided - M Capital Group August 2021.pdfpchutichetpong
The U.S. economy is continuing its impressive recovery from the COVID-19 pandemic and not slowing down despite re-occurring bumps. The U.S. savings rate reached its highest ever recorded level at 34% in April 2020 and Americans seem ready to spend. The sectors that had been hurt the most by the pandemic specifically reduced consumer spending, like retail, leisure, hospitality, and travel, are now experiencing massive growth in revenue and job openings.
Could this growth lead to a “Roaring Twenties”? As quickly as the U.S. economy contracted, experiencing a 9.1% drop in economic output relative to the business cycle in Q2 2020, the largest in recorded history, it has rebounded beyond expectations. This surprising growth seems to be fueled by the U.S. government’s aggressive fiscal and monetary policies, and an increase in consumer spending as mobility restrictions are lifted. Unemployment rates between June 2020 and June 2021 decreased by 5.2%, while the demand for labor is increasing, coupled with increasing wages to incentivize Americans to rejoin the labor force. Schools and businesses are expected to fully reopen soon. In parallel, vaccination rates across the country and the world continue to rise, with full vaccination rates of 50% and 14.8% respectively.
However, it is not completely smooth sailing from here. According to M Capital Group, the main risks that threaten the continued growth of the U.S. economy are inflation, unsettled trade relations, and another wave of Covid-19 mutations that could shut down the world again. Have we learned from the past year of COVID-19 and adapted our economy accordingly?
“In order for the U.S. economy to continue growing, whether there is another wave or not, the U.S. needs to focus on diversifying supply chains, supporting business investment, and maintaining consumer spending,” says Grace Feeley, a research analyst at M Capital Group.
While the economic indicators are positive, the risks are coming closer to manifesting and threatening such growth. The new variants spreading throughout the world, Delta, Lambda, and Gamma, are vaccine-resistant and muddy the predictions made about the economy and health of the country. These variants bring back the feeling of uncertainty that has wreaked havoc not only on the stock market but the mindset of people around the world. MCG provides unique insight on how to mitigate these risks to possibly ensure a bright economic future.
US Economic Outlook - Being Decided - M Capital Group August 2021.pdf
progressive mreport-09/04
1. NEWS
RELEASE
The Progressive Corporation Company Contact:
6300 Wilson Mills Road Thomas A. King
Mayfield Village, Ohio 44143 (440) 395-2260
http://www.progressive.com
FOR IMMEDIATE RELEASE
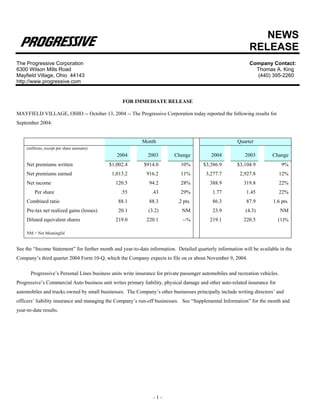
MAYFIELD VILLAGE, OHIO -- October 13, 2004 -- The Progressive Corporation today reported the following results for
September 2004:
Month Quarter
(millions, except per share amounts)
2004 2003 Change 2004 2003 Change
Net premiums written $1,002.4 $914.0 10% $3,386.9 $3,104.9 9%
Net premiums earned 1,013.2 916.2 11% 3,277.7 2,927.8 12%
Net income 120.5 94.2 28% 388.9 319.8 22%
Per share .55 .43 29% 1.77 1.45 22%
Combined ratio 88.1 88.3 .2 pts. 86.3 87.9 1.6 pts.
Pre-tax net realized gains (losses) 20.1 (3.2) NM 23.9 (4.3) NM
Diluted equivalent shares 219.0 220.1 --% 219.1 220.5 (1)%
NM = Not Meaningful
See the “Income Statement” for further month and year-to-date information. Detailed quarterly information will be available in the
Company’s third quarter 2004 Form 10-Q, which the Company expects to file on or about November 9, 2004.
Progressive’s Personal Lines business units write insurance for private passenger automobiles and recreation vehicles.
Progressive’s Commercial Auto business unit writes primary liability, physical damage and other auto-related insurance for
automobiles and trucks owned by small businesses. The Company’s other businesses principally include writing directors’ and
officers’ liability insurance and managing the Company’s run-off businesses. See “Supplemental Information” for the month and
year-to-date results.
-1-
2. THE PROGRESSIVE CORPORATION AND SUBSIDIARIES
INCOME STATEMENT
September 2004
(millions – except per share amounts)
(unaudited)
Current
Comments on Monthly Results1
Month
Direct premiums written $1,023.7
Net premiums written $1,002.4
Revenues:
Net premiums earned $1,013.2
Investment income 44.2
Net realized gains (losses) on securities 20.1
Service revenues 3.6
Total revenues 1,081.1
Expenses:
Losses and loss adjustment expenses 687.8 Includes $35.6 million, 3.5 loss ratio points, of hurricane-related losses.
109.7
Policy acquisition costs
Other underwriting expenses 95.2
Investment expenses 2.4 Includes $1.5 million related to the Dutch auction tender offer for its
Common Shares, which the Company commenced during the month.
Service expenses 1.5
Interest expense 6.7
Total expenses 903.3
Income before income taxes 177.8
Provision for income taxes 57.3
Net income $120.5
COMPUTATION OF EARNINGS PER SHARE
Basic:
Average shares outstanding 215.9
Per share $.56
Diluted:
Average shares outstanding 215.9
Net effect of dilutive stock-based
compensation 3.1
Total equivalent shares 219.0
Per share $.55
1
See the Monthly Commentary at the end of this release for additional discussion. Also see Note 1 to the Company’s 2003 audited
consolidated financial statements included in the Company’s 2003 Annual Report, which can be found at progressive.com/annualreport, for a
description of the Company’s reporting and accounting policies.
________________________
The following table sets forth the total return on investments for the month:
Fully taxable equivalent total return:
Fixed income securities .3%
Common stocks 1.3%
Total portfolio .4%
-2-
3. THE PROGRESSIVE CORPORATION AND SUBSIDIARIES
INCOME STATEMENTS
September 2004 Year-to-Date
(millions – except per share amounts)
(unaudited)
Year-to-Date
%
2004 2003 Change
Direct premiums written $10,273.3 $9,211.3 12
Net premiums written $10,025.8 $9,007.0 11
Revenues:
Net premiums earned $9,605.2 $8,301.0 16
Investment income 364.4 344.0 6
Net realized gains (losses) on securities 80.0 15.7 410
Service revenues 36.6 30.1 22
Other income1 -- 30.8 NM
Total revenues 10,086.2 8,721.6 16
Expenses:
Losses and loss adjustment expenses 6,224.5 5,636.9 10
Policy acquisition costs 1,035.8 915.6 13
Other underwriting expenses 904.1 736.4 23
Investment expenses 10.4 8.3 25
Service expenses 18.0 19.4 (7)
Interest expense 60.3 71.8 (16)
Total expenses 8,253.1 7,388.4 12
Income before income taxes 1,833.1 1,333.2 37
Provision for income taxes 597.9 435.6 37
Net income $1,235.2 $897.6 38
COMPUTATION OF EARNINGS PER SHARE
Basic:
Average shares outstanding 216.2 217.5 (1)
Per share $5.71 $4.13 38
Diluted:
Average shares outstanding 216.2 217.5 (1)
Net effect of dilutive stock-based
compensation 3.4 3.7 (8)
Total equivalent shares 219.6 221.2 (1)
Per share $5.62 $4.06 39
NM = Not Meaningful
1
Amount represents estimated interest earned through September 2003 on an income tax refund the Company received in 2004.
_________________________
The following table sets forth the total return on investments for the year-to-date period:
2004 2003
Fully taxable equivalent total return:
Fixed income securities 3.3% 4.7%
Common stocks 1.4% 14.8%
Total portfolio 3.1% 6.2%
-3-
4. THE PROGRESSIVE CORPORATION AND SUBSIDIARIES
SUPPLEMENTAL INFORMATION
September 2004
($ in millions)
(unaudited)
Current Month
Commercial
Personal Lines Auto Other Companywide
Businesses2
Agency Direct Total Business Total
Net Premiums Written $589.7 $294.9 $884.6 $116.0 $1.8 $1,002.4
% Growth in NPW 6% 16% 9% 13% (36)% 10%
Net Premiums Earned $604.2 $287.0 $891.2 $119.6 $2.4 $1,013.2
% Growth in NPE 8% 14% 10% 18% (31)% 11%
GAAP Ratios
Loss/LAE ratio 68.8 68.1 68.5 64.4 .7 67.9
Expense ratio 20.4 19.9 20.3 19.4 28.5 20.2
Combined ratio 89.2 88.0 88.8 83.8 29.2 88.1
Actuarial Adjustments1
Reserve Decrease/(Increase)
Prior accident years $2.1
Current accident year (5.0)
Calendar year actuarial adjustment $(.8) $(1.2) $(2.0) $(1.0) $.1 $(2.9)
Prior Accident Years Development
Favorable/(Unfavorable)
Actuarial adjustment $2.1
All other development 13.7
Total development $15.8
Calendar year loss/LAE ratio 67.9
Accident year loss/LAE ratio 69.5
Statutory Ratios
Loss/LAE ratio 67.9
Expense ratio 19.8
Combined ratio 87.7
1
Represents adjustments solely based on the Company’s corporate actuarial review.
2
In September 2004, the Company incurred favorable “other development” in its run-off businesses.
-4-
5. THE PROGRESSIVE CORPORATION AND SUBSIDIARIES
SUPPLEMENTAL INFORMATION
September 2004 Year-to-Date
($ in millions)
(unaudited)
Year-to-Date
Commercial
Personal Lines Auto Other Companywide
Agency Direct Total Business Businesses Total
Net Premiums Written $5,967.5 $2,847.4 $8,814.9 $1,191.8 $19.1 $10,025.8
% Growth in NPW 9% 16% 11% 16% (59)% 11%
Net Premiums Earned $5,776.5 $2,701.6 $8,478.1 $1,101.2 $25.9 $9,605.2
% Growth in NPE 13% 19% 15% 24% (51)% 16%
GAAP Ratios
Loss/LAE ratio 65.8 64.7 65.4 60.1 56.8 64.8
Expense ratio 20.1 20.6 20.3 19.1 46.2 20.2
Combined ratio 85.9 85.3 85.7 79.2 103.0 85.0
Actuarial Adjustments1
Reserve Decrease/(Increase)
Prior accident years $31.1
Current accident year (24.8)
Calendar year actuarial adjustment $5.3 $1.3 $6.6 $(.3) $-- $6.3
Prior Accident Years Development
Favorable/(Unfavorable)
Actuarial adjustment $31.1
All other development 44.3
Total development $75.4
Calendar year loss/LAE ratio 64.8
Accident year loss/LAE ratio 65.6
Statutory Ratios
Loss/LAE ratio 64.9
Expense ratio 19.4
Combined ratio 84.3
Statutory surplus2 $4,759.4
September September
Policies in Force 2004 2003 Change
(in thousands)
Agency – Auto 4,236 3,920 8%
Direct – Auto 2,050 1,800 14%
Other Personal Lines3 2,350 1,985 18%
Total Personal Lines 8,636 7,705 12%
Commercial Auto Business 413 356 16%
1
Represents adjustments solely based on the Company’s corporate actuarial review.
2
During September, the insurance subsidiaries paid cash dividends, net of capital contributions, of $979.6 million to the parent
company.
3
Includes insurance for motorcycles, recreation vehicles, mobile homes, watercraft, snowmobiles, homeowners and similar items.
-5-
6. THE PROGRESSIVE CORPORATION AND SUBSIDIARIES
BALANCE SHEET AND OTHER INFORMATION
(millions– except per share amounts)
(unaudited)
September
2004
CONDENSED GAAP BALANCE SHEET:1
Investments -
Available-for-sale:
Fixed maturities, at market (amortized cost: $9,534.0) $9,681.1
Equity securities, at market:
Preferred stocks (cost: $723.4) 747.2
Common equities (cost: $1,312.1) 1,686.7
Short-term investments, at amortized cost (market: $2,204.2) 2,204.2
Total investments2 14,319.2
Net premiums receivable 2,397.6
Deferred acquisition costs 460.5
Other assets 1,318.4
Total assets $18,495.7
Unearned premiums $4,326.5
Loss and loss adjustment expense reserves 5,156.0
Other liabilities2 1,592.0
Debt 1,290.2
Shareholders’ equity 6,131.0
Total liabilities and shareholders’ equity $18,495.7
Common Shares outstanding 217.0
Shares repurchased – September --
Average cost per share $--
Book value per share $28.25
Return on average shareholders’ equity 28.6%
Net unrealized pre-tax gains on investments $545.5
Debt to total capital ratio 17.4%
1
Pursuant to SFAS 113, “Accounting and Reporting for Reinsurance of Short-Duration and Long-
Duration Contracts,” loss and loss adjustment expense reserves are stated gross of reinsurance
recoverables on unpaid losses of $251.7 million.
2
Amounts include net unsettled security acquisitions of $101.3 million.
-6-
7. Monthly Commentary
♦
Growth continued to slow in the Company’s Personal Lines businesses. Eight markets had year-to-date net
premiums written growth of 20% or greater; these markets represented 14% of the total Personal Lines premiums.
Nineteen states (44% of total Personal Lines) grew less than 10%.
♦
Commercial Auto’s written premium growth was understated in September due to an inventory of unprocessed
applications.
♦
The Company continued to experience strong profitability. Four markets in which the Company writes Personal
Lines business were unprofitable for the month; however, excluding the effect of the hurricane-related losses, three
of the four markets would have been profitable. For the year-to-date period, all Personal Lines markets were
profitable.
♦
The Company continues to respond to the catastrophic, weather-related claims. As of October 12, 2004, over 80%
of the approximately 21,000 reported claims have been paid.
♦
The pretax recurring book yield of the investment portfolio was 3.9% for the month and 3.8% year-to-date.
♦ At September month-end, the net unrealized gains in the investment portfolio were $545.5 million, a decrease of
$97.9 million from year-end 2003. In the fixed-income portfolio, the duration was 2.9 years and the weighted
average credit quality remained AA+.
The Progressive group of insurance companies ranks third in the nation for auto insurance based on premiums written.
The companies that offer insurance directly (by phone at 1-800-PROGRESSIVE and online at progressive.com)
market their products and services through the Progressive Direct brand, while the companies that offer insurance
through more than 30,000 independent agencies and insurance brokers in the U.S. market their products and services
through the Drive Insurance from Progressive brand. The Common Shares of The Progressive Corporation, the
holding company, are publicly traded at NYSE:PGR.
Safe Harbor Statement under the Private Securities Litigation Reform Act of 1995: Statements in this release that are not
historical fact are forward-looking statements that are subject to certain risks and uncertainties that could cause actual events and
results to differ materially from those discussed herein. These risks and uncertainties include, without limitation, uncertainties
related to estimates, assumptions and projections generally; inflation and changes in economic conditions (including changes in
interest rates and financial markets); the accuracy and adequacy of the Company’s pricing and loss reserving methodologies;
pricing competition and other initiatives by competitors; the Company’s ability to obtain regulatory approval for requested rate
changes and the timing thereof; the effectiveness of the Company’s advertising campaigns; legislative and regulatory
developments; the outcome of litigation pending or that may be filed against the Company; weather conditions (including the
severity and frequency of storms, hurricanes, snowfalls, hail and winter conditions); changes in driving patterns and loss trends;
acts of war and terrorist activities; the Company’s ability to maintain the uninterrupted operation of its facilities, systems
(including information technology systems) and business functions; court decisions and trends in litigation and health care and
auto repair costs; and other matters described from time to time by the Company in releases and publications, and in periodic
reports and other documents filed with the United States Securities and Exchange Commission. In addition, investors should be
aware that generally accepted accounting principles prescribe when a company may reserve for particular risks, including
litigation exposures. Accordingly, results for a given reporting period could be significantly affected if and when a reserve is
established for a major contingency. Reported results, therefore, may appear to be volatile in certain accounting periods.
-7-