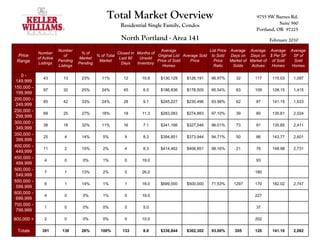
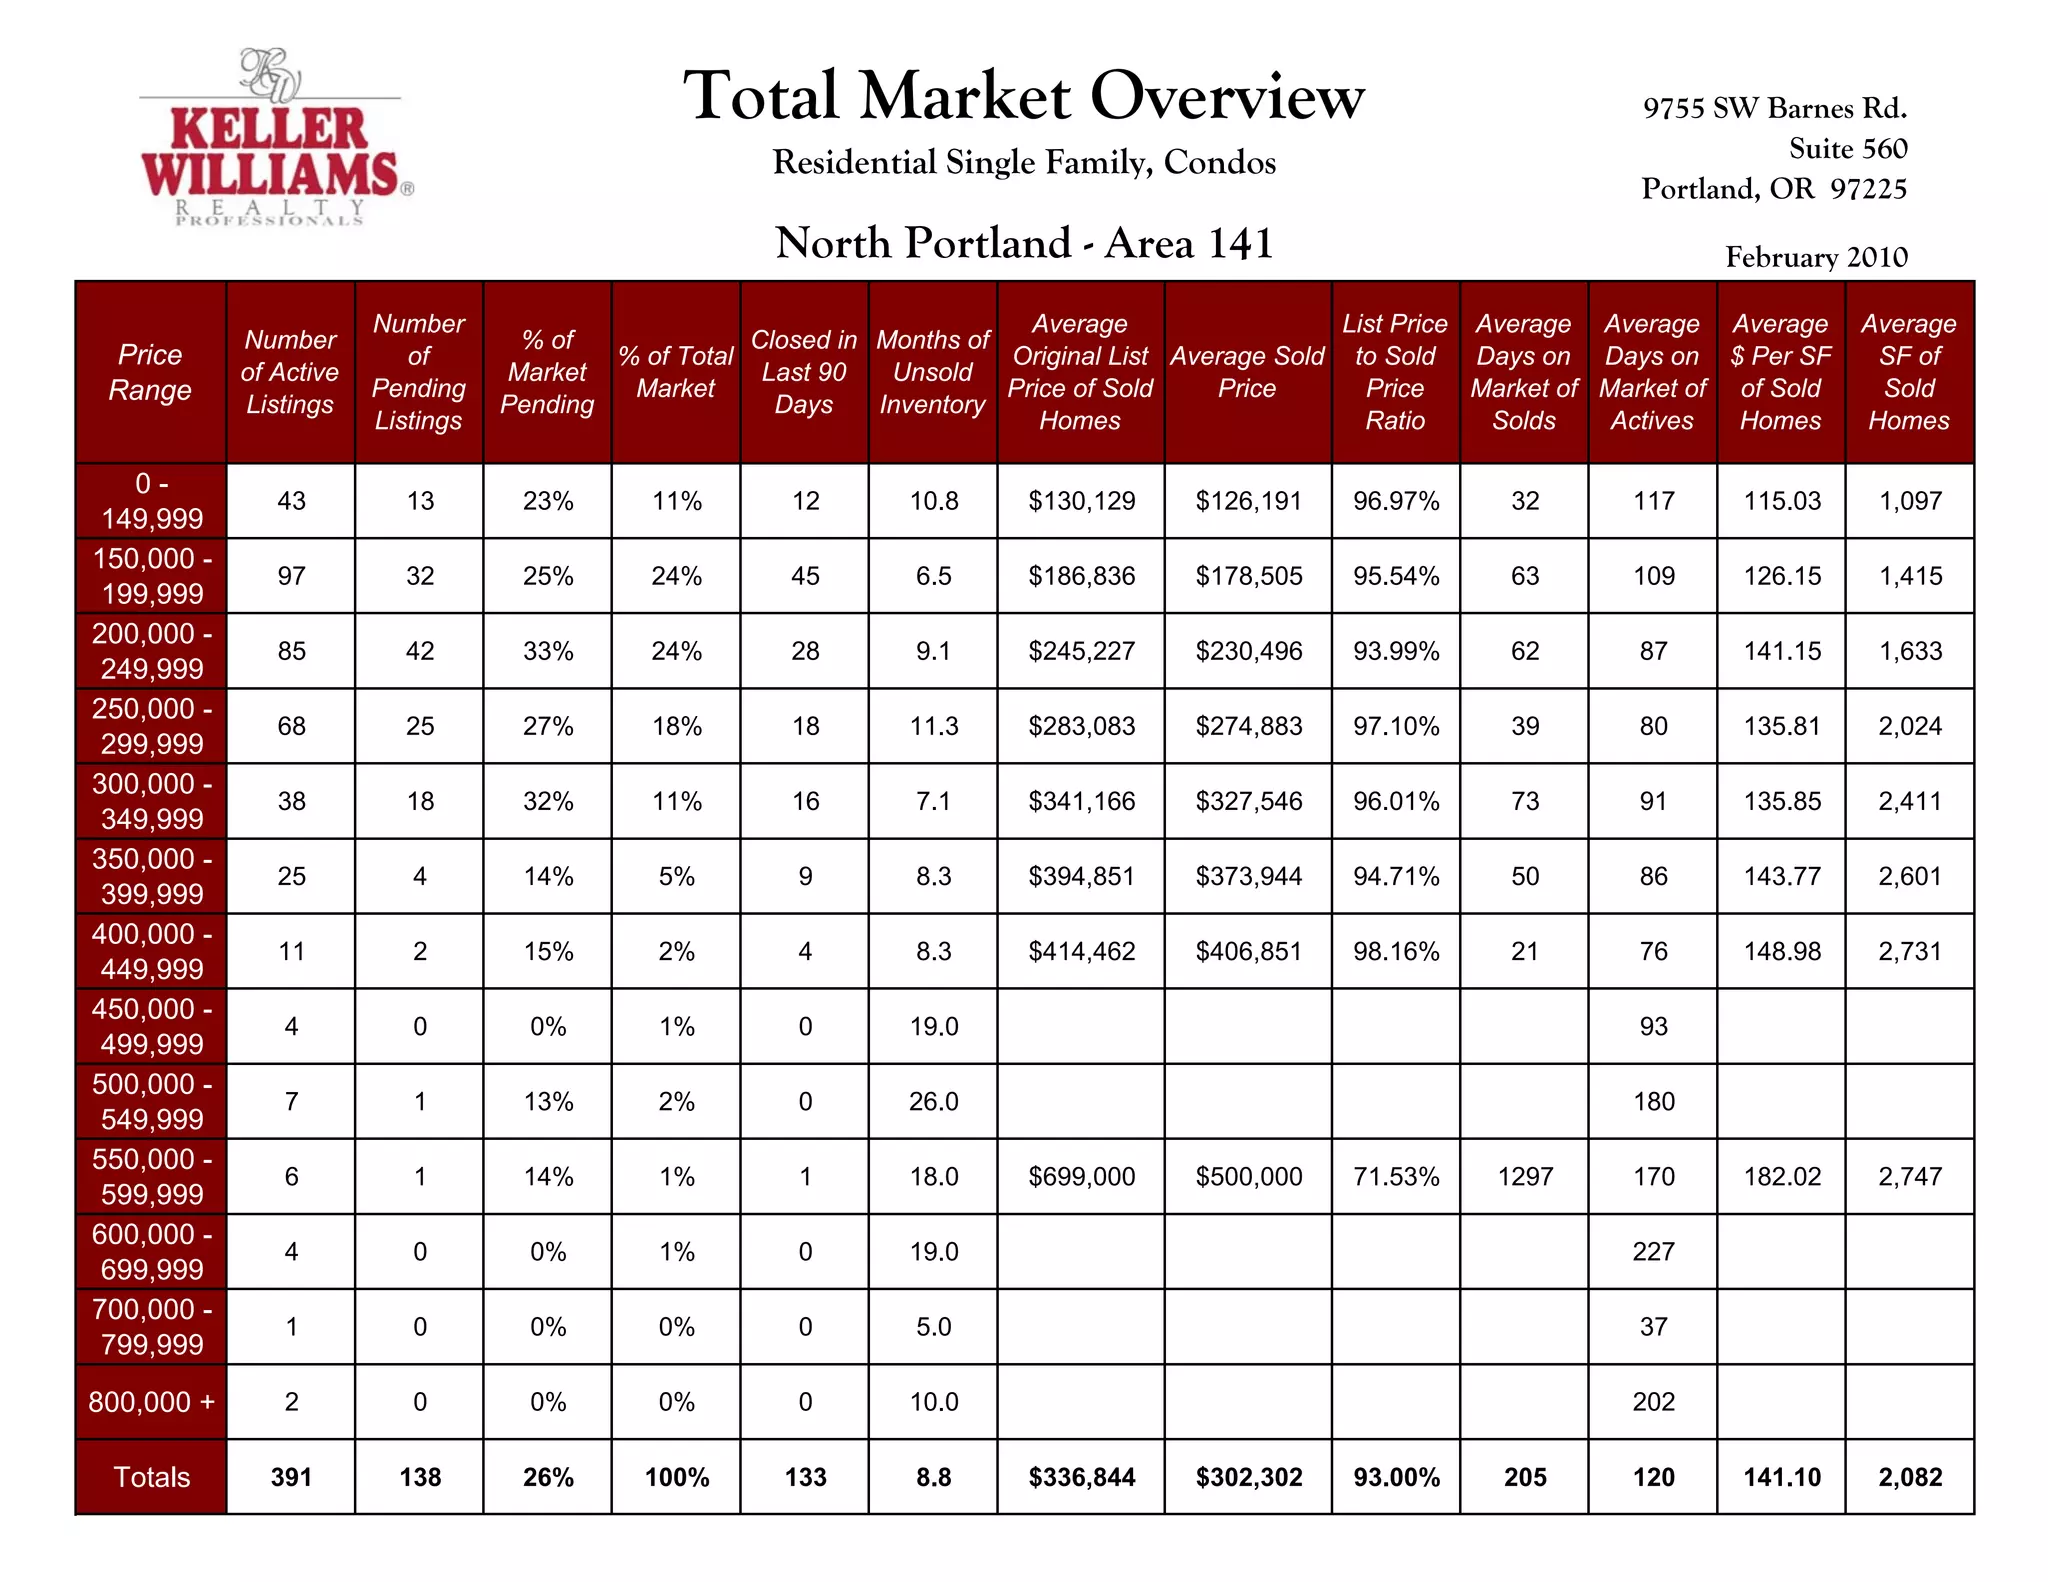
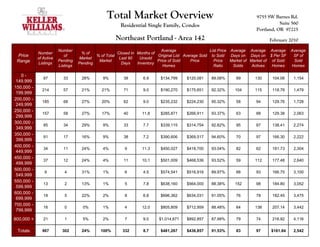
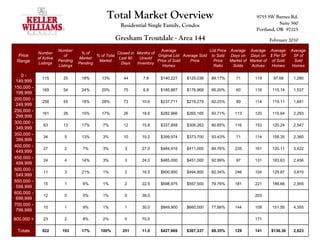
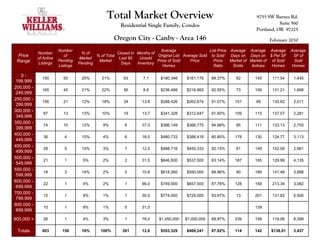
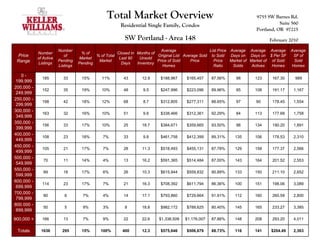
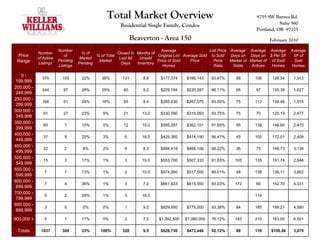
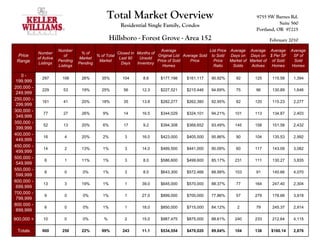
This document provides a summary of the residential housing market in three areas of Portland, Oregon in February 2010. It includes data on active and pending listings, homes sold, average prices, days on market and price per square foot for different price ranges. The number of active listings was highest in Southeast Portland at 1,217 and lowest in Northeast Portland at 967. Average original list prices and sold prices varied by area and price range, with higher end homes generally taking longer to sell.
This document provides a market overview of residential single family and condo properties for 4 areas in the Portland, Oregon region. It includes data on active and pending listings, homes sold in the last 90 days, average original and sold list prices, average days on market, and average price per square foot for various price ranges. The areas covered are North Portland, Northeast Portland, Southeast Portland, and Gresham Troutdale.
This document provides an overview of the residential real estate market in four areas of Portland, Oregon for November 2009. It includes data on active and pending listings, homes sold, average prices, days on market and price per square foot for different price ranges. The areas covered are North Portland, Northeast Portland, Southeast Portland and Gresham/Troutdale. Overall prices ranged from $122,720 to over $800,000 with average days on market of 4.4 to 4.9 days across the four regions.
This document provides a market overview of residential single family homes and condos in three areas of Portland, Oregon for December 2009. It includes data on active and pending listings, average list prices, average sold prices, average days on market, and average price per square foot for homes sold by price range in each area over the past 90 days. The areas covered are North Portland (Area 141), Northeast Portland (Area 142), and Southeast Portland (Area 143).
The document provides real estate market data for 14 areas in the Houston, Texas region for 2011 and 2012 year-to-date. Across all areas, average home prices, median home prices, and sales prices per square foot have generally increased from 2011 to 2012. The number of new listings and active listings have decreased in most areas from 2011 to 2012, while pending sales and sales-to-list price ratios have increased in many areas from 2011 to 2012. Days on market have decreased on average across the Houston region from 2011 to 2012.
This slide show shows the incredible volume of sales completed by Coldwell Banker C&C Properties in northern California. I am the Siskiyou County satellite agent for Coldwell Banker C&C Properties proudly representing properties from the Pacific to Nevada and from Anderson to Oregon.
The Austin market heated up since Winter 2007. Check out the latest Austin real estate market statistics from the Austin Board of REALTORS. Analyzed by Dee Copeland, broker-associate in Austin, Texas.
The document provides real estate sales data for Austin, Texas in February 2011. It shows that single family home sales remained steady year-over-year at 1,112 sales. The average and median home prices were relatively unchanged from the previous year at $244,382 and $193,000 respectively. Pending sales decreased 11% and new listings dropped 24% compared to February 2010.
This document provides an overview and business plan for Andy OnCall Chicagoland West, a home improvement franchise located in Chicago's western suburbs seeking $90,000 in growth capital. The business has been the highest grossing in the Andy OnCall network and aims to drive further growth through a digitally-focused strategy leveraging email, web advertising, and an enhanced online presence to lower customer acquisition costs. The target territory has over 1.1 million residents and $600 million annually spent on home improvements, and the business has already achieved $1 million in annual sales in its second year of operation.
The Chapel Hill-Carrboro Chamber of Commerce hosted its Orange County Development Briefing, 8-10 a.m, Tuesday, Sept. 20, 2011 at the Friday Center for Continuing Education in Chapel Hill.
Commercial and residential real estate professionals, planners and economic developers presented the latest trends about the local markets, new economic development initiatives, and the status of approved projects in Orange County and its municipalities at the fifth annual event.
Speakers included Mark Zimmerman of RE/MAX Winning Edge; John Morris of Morris Commercial; and Gordon Merklein, UNC’s executive director of real estate development.
The event is presented by Time Warner Cable Business Class and sponsored Duke Energy, The UPS Store and the 2011 Chamber Master Sponsors.
North Texas MLS Sales Activity May 2012Rick Michels
The document summarizes real estate data for North Texas in May 2012. It shows that single-family home sales increased 22% from the previous year while the average price rose 8% and days on market decreased 18%. Across other property types, sales and average prices generally increased from the previous year as well, while days on market decreased or remained steady. Pending sales and new listings also rose compared to May 2011.
The Dallas real estate market slowed in late 2007 due to issues in the mortgage market, particularly sub-prime loans. While inventory levels have risen to 90 days in some areas, well-priced homes in nice neighborhoods continue to see multiple offers. The average home price in Dallas in 2007 was $200,226, with the median at $148,442. Real estate professionals expect the market to stabilize within the next year if sellers price homes competitively.
The summary provides an overview of the key points from the Greensboro Housing Report for Q1 2010:
1) Existing home sales in Greensboro totaled 677 in Q1 2010, down 1.6% from Q4 2009 but up 27.2% from Q1 2009, with the average home price at $170,447, down 2.3% from last quarter.
2) Housing inventory increased 23.8% from last quarter and was up 10.3% from a year ago, resulting in a 5.9 months' supply of homes, well above the 3.3 months' supply in Q4 2009.
3) The neighborhoods with the most home sales were zip codes 27
The document summarizes the economic impacts of austerity measures in Canada. It argues that [1] austerity will likely lead to another recession as it has in other countries, [2] government debt ratios are manageable and deficits could be eliminated through fair tax measures instead of spending cuts, and [3] austerity disproportionately impacts working people and increases inequality. The response should expose the failures of neoliberalism and privatization, advocate for fair taxes, resist commodification of public services, and build alliances through mobilization and democratic participation.
A summary of the real estate market conditions in the Greater Houston Metropolitan broken down by areas including Sugar Land, The Woodlands, Galveston, Clear Lake, Memorial, Kingwood etc.
Market areas correspond to the geographical boundaries found on the area map.
Chicago Real Estate Market Data - Broken Down by Citybethrepta
The report provides statistics on housing market trends in various towns in the Chicagoland area between January 1, 2009 and December 31, 2009. It shows that during this period, average home sale prices declined substantially in most towns, with decreases ranging from 4.71% to 73.41%. Housing inventory levels also increased significantly across most areas. For example, months of supply increased from 7.74 to 9.78 in Arlington Heights. The report concludes that absorption rates declined and inventory levels rose sharply during 2009 compared to the previous year.
The report provides statistics on housing sales in various towns in the Chicagoland area between January 1, 2009 and December 31, 2009. It shows data such as average list prices, number of homes under contract and pending sales, number of sales in the last 12 months, average sale prices, and the percentage change in average sale prices compared to the previous year. For example, in Addison the average sale price decreased 17.01% from the previous year to $219,885, and the number of sales decreased 45.99% over the last 12 months. Overall the report indicates significant decreases in housing inventory levels, sales, and average sale prices across most towns in the Chicagoland area during 2009 compared
The report analyzes housing statistics for single family homes in the Chicagoland area from July 1, 2009 to June 30, 2010. It finds that during this period, average home sale prices decreased in most towns compared to the previous 12 months. The months of housing inventory increased in most towns as well, indicating lower housing demand. For example, in Addison the average sale price decreased 14.07% and months of inventory increased 46.01%. The report provides statistics on housing inventory levels, average list prices, homes under contract and pending sales, average sale prices, and months of housing supply for over 60 towns in the Chicagoland region.
This document provides real estate market data for 17 different areas in the Houston, Texas region for the year-to-date period of 2010, including statistics such as average and median home prices, price per square foot, sales to list price ratio, and housing inventory levels. It compares the 2010 YTD data to the same period in 2009 for each area, showing both numerical differences and percentage differences. The areas range from specific neighborhoods to broader geographic regions within the Houston metro.
This document summarizes real estate market data for 14 different areas in the Houston, Texas region for the year-to-date 2009 and 2010. It provides statistics on home sales, prices, inventory levels, and other metrics. Across most areas, home sales prices were up slightly from 2009 to 2010, while inventory levels also increased slightly on average. The percentage differences in key metrics like sales, prices, and inventory between 2009 and 2010 are also shown to provide comparisons across the two years.
- The document provides housing market data for the City of Toronto East region for July 2011 and year-to-date 2011, including sales, dollar volumes, average and median prices, new and active listings, and average days on market.
- It includes this data broken down by home type (detached, semi-detached, condo townhouse, etc.) and for three specific areas within Toronto East: E01, E02, and E03.
- The data shows strong home sales in July 2011 for the Toronto East region overall as well as increases in most home types from year-to-date 2011.
Ted Simpson presented on the state of commercial real estate markets in Los Angeles County. Key points included:
1) The industrial market has seen a big bounce back in 2010 with rising profits and job growth, though vacancies remain elevated.
2) The retail market saw rental rates stabilize in 2010 but vacancies remained high. Sales prices per square foot have fallen since their 2007 peak.
3) The office market saw record high vacancies in 2009 and negative absorption for nine consecutive quarters, though construction completions halted which will help limit further rising vacancies.
4) Overall the commercial real estate markets are recovering but vacancies remain well above historic averages and sustained job growth is needed for a full recovery.
The document provides a summary of housing market data for July 2011 and year-to-date 2011 for different regions within Toronto West, including statistics on home sales, prices, new listings, and more. For example, in Toronto W01 in July 2011 there were 68 total home sales with an average price of $475,938. Year-to-date totals are also given to compare against monthly figures.
Rick Brokaw has over 30 years of experience in the security alarm industry, starting as an install helper at Austronic Security and eventually becoming general manager. He later held regional operations manager roles at several large security companies before founding Vintage Security in 2001. As of 2012, Vintage Security has 15,000 customers, 80 employees across 2 offices, and generates $5 million in annual revenue, with a focus on the homebuilding and home technology markets in the Washington D.C. area.
Homes are selling and affordable due to low prices and payments. Interest rates are low but rising. Special loan programs allow financing repairs. California's growing population will increase housing demand and prices in the future. Renting long-term costs more than owning, even after accounting for maintenance and property taxes. Buying now provides an opportunity to build equity through appreciation over the next several years.
The document summarizes recent changes and data related to the US housing market. The FHA has tightened lending requirements by raising insurance fees, capping seller contributions, and requiring higher down payments for borrowers with poor credit. Paperwork requirements for loan modifications have been simplified. The FHA will also lift its 90-day requirement on foreclosure purchases for one year. Additionally, Obama has proposed $30 billion for small business loans through community banks.
- Closed home sales in the Portland, OR metro area decreased 22.3% in September 2010 compared to September 2009, while pending sales and new listings also declined.
- The average home sale price fell 3.5% and the median price dropped 0.6% in September 2010 year-over-year. Month-to-month, prices decreased 6.5% and 4% respectively.
- As of September 2010, there were 14,714 homes listed in the Portland metro market, which at the current sales rate would last 10.5 months to sell.
This document provides an overview of the recent state of the US housing market and real estate sector. It summarizes that home sales and prices have increased for four months in a row, housing inventory has decreased, and the overall economy appears to be on a slow track to recovery. It also reviews current mortgage rates, home affordability levels, and recent government programs affecting housing such as changes to loan modification eligibility and FHA funding.
This document provides a summary of recent developments in the US housing market in August 2009. It discusses signs of recovery such as rising home sales and prices. It also summarizes key housing market indicators like inventory, mortgage rates, and affordability. Recent government actions to help homeowners and first-time buyers are also outlined.
Laurus is a business consulting firm that assists IT vendors in selling more effectively in Asia Pacific. Their mission is to enable growth strategies for clients. Their vision is to help clients achieve leadership status in Asia Pacific and be the trusted partner of choice. They offer strategy planning, plan execution, and managed representation to assess markets, create business plans, recruit partners, provide sales support, and represent clients in the region.
The document outlines the extensive marketing strategies and services provided by The Hatch Homes Group real estate agency to get homes maximum exposure and top market value. They describe various online, print, and social media advertising methods as well as open houses, sphere of influence outreach, and weekly reporting to buyers. The Hatch Homes Group promotes itself as an experienced, educated team that will work persistently to care for clients' needs.
This document provides information about John Hatch Homes, a real estate team based in Portland, Oregon. It introduces the principal broker John Hatch and other team members, including brokers Clare Stevens, Angela Stevens, Barry Woodworth, and office manager Angie Purry. It also outlines the services provided by the team, such as selling homes for the highest price in the shortest time, developing a marketing plan, providing home inspections and warranties, and following up with clients and prospects. Testimonials from past clients praise the team for their experience, communication skills, and success in selling homes.
The document provides information about the real estate services offered by John and Melody Hatch of Hatch Homes Group. They offer professional photography, listing on the MLS, flyers, open houses, and a variety of online and print marketing strategies. The summary emphasizes their experience, education, and commitment to client satisfaction through effective marketing and communication.
This report includes MLS data for the past 36 months in Maricopa County only as provided by the FlexMLS system. Please note that searches fluctuate daily when running these reports;these figures were obtained on 9/2/12. A reminder that you need to meet with a real estate professionalto see how statistics impact the area where you are considering selling or buying – blended statistics will not be as accurate as a more detailed report that your real estate professional can provide to help you with your decision making.
The document provides real estate sales data for Austin, Texas for the month of January 2011. It shows that single family home sales increased 14% from the previous year with an average price of $251,799, up 2% from January 2010. Townhouse/condominium sales decreased 28% with an average price of $171,578, up 14% from the previous year. Overall real estate activity was down from the previous year according to pending sales, new listings, and active listings.
The report provides information on recent property sales in the suburb of Dalkeith, Western Australia. It finds that the median house price in Dalkeith is currently $2,405,000, with a 1-year return of -14% and 3-year return of -14%. Recent property sales in Dalkeith have ranged from $1,460,000 to $6,000,000.
The document provides an overview and analysis of the current state of the DFW real estate market. It discusses:
1) Sales data from 2008 showing declines across the region from the prior year in both number of sales and average sale price.
2) Current historically low interest rates due to government intervention, though jumbo rates have not fallen as much.
3) The DFW economy remains strong with job growth and corporate relocations, helping prop up real estate values compared to the rest of the US.
This document summarizes single-family residential real estate market data for 16 different areas in the Houston region for the year-to-date of 2009 and 2010. For each area, it provides statistics on sales, average and median home prices, price per square foot, percentage of homes sold at or above list price, cooperative sales, new listings, active listings, pending sales, and months of inventory. It compares the 2009 and 2010 year-to-date figures and calculates the percentage difference between the two years for each statistic. The areas range from specific neighborhoods to broader geographic regions around Houston.
Toronto Real Estate Statistics October 2010John Helfrich
The document summarizes housing market statistics for October 2010 in the Greater Toronto Area (GTA). Key points:
- Housing sales in October 2010 decreased 21% compared to October 2009, while the average selling price increased 5% to $443,729. Sales for the year so far were up 1% compared to the same period in 2009.
- Condominium apartments accounted for 42% of sales in Toronto and almost 60% of sales in central GTA districts. Detached homes accounted for over 90% of sales in surrounding regions.
- The median price in October 2010 was $366,000, up from $357,000 in October 2009. The outlook for interest rates and income growth is favorable
Toronto real estate market watch october 2010Vahab Jalali
The document summarizes housing market statistics for October 2010 in the Greater Toronto Area (GTA). Key points:
- Housing sales in October 2010 decreased 21% compared to October 2009, while the average selling price increased 5% to $443,729. Sales for the year so far were up 1% compared to the same period in 2009.
- Condominium apartments accounted for 42% of sales in Toronto and almost 60% of sales in central GTA districts. Detached homes accounted for over 90% of sales in surrounding regions.
- The median price in October 2010 was $366,000, up from $357,000 in October 2009. The outlook for interest rates and income growth is favorable
This document summarizes single-family residential real estate market data for 16 areas in the Houston, Texas region for March 2010. It provides year-to-date statistics for 2010 and 2009 including average and median home prices, price per square foot, percentage of homes sold at or above list price, sales of new and pending listings, and months of inventory. For each area, it calculates the difference and percentage difference between 2010 and 2009 for each statistic. The areas range from specific neighborhoods to broader geographic regions around Houston.
This document provides an overview of Caltrans District 7 construction projects for 2012. It includes statistics on the number and value of ongoing construction contracts across California districts. District 7 has 101 ongoing contracts worth $1.6 billion, accounting for 16.5% of statewide contracts. Several major projects in District 7 are highlighted, including improvements to the I-5, SR-110, and the Gerald Desmond Bridge replacement. Contact information is provided for finding additional details on specific contracts.
Dec 2020 Fraser Valley Real Estate Board PackageVicky Aulakh
- In December 2020, real estate sales in the Fraser Valley set a new record with 2,086 sales, an increase of 81.2% over the typical December sales. New listings were also near record levels.
- Despite months of slowdown due to the pandemic, total annual sales in 2020 were 12.4% above the 10-year average, with 19,926 total sales for the year.
- Benchmark home prices in December increased compared to both the previous month and the previous year for detached homes, townhomes, and apartments.
Home sales in the GTA set a new record for April 2021 at 13,663 sales, more than quadruple the sales in April 2020 during the first full month of the pandemic. While sales remained strong, there was a marked slowing in both transactions and new listings in April 2021 compared to March 2021. The average home price in April 2021 was $1,090,992, up 33% from April 2020 but flat compared to March 2021.
Fraser Valley Real Estate Board Statistics Package Jan 2021Vicky Aulakh
The Fraser Valley real estate market saw record-breaking home sales in January 2021, with 1,718 total sales representing a 76% increase from January 2020. While new listings rose 26% year-over-year, total active inventory was still down 18% from January 2020. The average number of days to sell a single-family detached home dropped to 35 days compared to 60 days in January 2020.
- Property sales in the Fraser Valley finished strong in December but total sales for 2019 were still lower than 2018, with 15,487 sales compared to 15,586 the prior year.
- Total dollar volume was also down, from $11.8 billion in 2018 to $11.2 billion in 2019.
- Inventory remained tight in December, with active listings 20.3% lower than the 10-year average and only 948 new listings added that month.
Fraser Valley Real Estate Board Statistics Package January 2020 Vicky Aulakh
- Home sales in the Fraser Valley region of BC were 6% above the 10-year average for January while new listings were 11% below average.
- 974 total property sales occurred in January, down 22% from December 2019 but up 24% from January 2019.
- Benchmark home prices increased slightly for detached homes, townhomes, and apartments compared to December 2019.
Website jan-apr 2012 florida keys real estate marketJamie Engel
Florida Keys real estate market statistics from January to April 2012 brought to you by Jamie Engel and Coldwell Banker Schmitt Real Estate Co in the Florida Keys.
This document provides monthly real estate statistics from January 2008 to October 2010 for single family homes, condominiums, income properties, land, and totals. The statistics include numbers of active listings, average list prices, properties under contract, properties sold, average days on market, and average and median sale prices. Overall, the data shows fluctuations in real estate listing and sale activity from year to year during this period.
This document provides a housing market analysis for Fairfax County for December 2008 data. It includes sales numbers, median sales prices, inventory levels, and other key metrics for various cities and areas within the county. The analysis shows that while total sales were up in December 2008 compared to the previous year, median sales prices and average sale prices were down between 18-26% year-over-year. Inventory levels were also down across most areas.
The document is a newsletter from John and Melody Hatch of HatchHomes Group providing weekly real estate marketing updates and statistics to their clients. It informs clients about new listings, sales, and pending properties in their neighborhood. It also shares feedback from virtual tours and explains any new relevant real estate information. The newsletter highlights that John and Melody Hatch are Platinum Club members of HomeGain, placing them in the top 1% of agents nationwide based on consumer reviews and sales volume.
The real estate market in the Portland metro area saw decreases in activity in November compared to previous months. Closed sales were down 1% from October but up slightly from November of the past two years. Pending sales were also higher than the past two Novembers. Inventory saw a small drop, which is positive for sellers. The brokerage expects a record number of sales in December despite the overall RMLS numbers due to increased buyer activity recently.
John and Melody Hatch of Hatch Homes provide services to help sellers sell their home for the most money in the shortest time. They have over 17 years of experience. The document outlines their seller's package which includes marketing the home through the real estate community, setting the appropriate price based on market factors, and coordinating the marketing. It details the home selling process and services provided such as market analysis, financing options, and home preparation recommendations.
- Residential real estate market in Portland, OR saw declines in October 2010 compared to October 2009, with closed sales down 35.7%, pending sales down 21.5%, and new listings down 9.4%
- Sale prices also declined, with average price down 2.4% and median price down 4.7% compared to October 2009
- Inventory levels rose to 10.7 months of supply in October 2010, up from 6.5 months in October 2009
The document discusses the benefits of exercise for mental health. Regular physical activity can help reduce anxiety and depression and improve mood and cognitive function. Exercise causes chemical changes in the brain that may help protect against mental illness and improve symptoms for those who already suffer from conditions like anxiety and depression.
- Home sales fell below year-ago levels for the first time in 14 months due to the expiration of the federal tax credit, though prices remained stable. Mortgage rates set new record lows.
- The new financial reform law establishes new regulations for mortgages, credit reports, credit/debit cards, and creates a Consumer Financial Protection Bureau.
- Buying a home with a 15-year mortgage allows buyers to build equity faster by paying off the loan sooner. Local lenders may offer more competitive rates than large banks.
- Housing activity remains above year-ago levels despite the expiration of the homebuyer tax credit. Home prices increased for the fourth consecutive month and inventory levels edged up slightly but remain below year-ago levels.
- Mortgage rates set a new record low in July and housing affordability remains high due to lower home prices and interest rates. However, concerns remain about the pace of the economic recovery and high unemployment.
- Regulators continue efforts to address predatory lending practices and protect consumers while the federal government maintains policies to support the economy. Consumers are advised to be cautious of new credit card practices that seek to circumvent new protections.
This document outlines an online marketing plan to maximize exposure for a listed home. It discusses how the internet is now the primary way that home buyers search for homes, with 90% using it to search and 36% finding their home online. The plan details using websites like Realtor.com to feature the client's listing prominently with photos, videos, and mobile apps to reach buyers online and drive them to contact the realtor. Status updates using tools like featured listings and performance reports are meant to optimize visibility and traffic to the client's listing.
This document provides links to school district directories for the Portland metropolitan area in Oregon, Lane County in Oregon, and Southwest Washington. It includes directories for the Clackamas, Gresham/Barlow, Multnomah, North Clackamas, NW Regional, and Portland school districts in Oregon as well as districts in Columbia River Gorge, Lane County, and over 15 districts in Southwest Washington. Additional links are provided for statewide school directories in Oregon and Washington as well as a national school directory.
The document summarizes recent data on the US housing market from the National Association of Realtors. It reports that existing home sales increased for the second month in a row in April, while home prices and inventory levels showed signs of stability compared to previous years. Mortgage rates dipped below 5% due to global economic factors. Affordability remains high compared to historical levels. The FHA is shifting responsibility for overseeing mortgage brokers to lenders in an effort to improve risk management.
The document discusses the benefits of exercise for mental health. Regular physical activity can help reduce anxiety and depression and improve mood and cognitive functioning. Exercise boosts blood flow, releases endorphins, and promotes changes in the brain which help enhance one's emotional well-being and mental clarity.
- The economic recovery is gaining traction slowly, with first quarter GDP growth of 3.2% indicating a sustainable recovery, though it remains subdued compared to past recessions. High unemployment and foreclosures continue to hamper a robust recovery.
- Existing home sales strengthened in March, up 6.5% from February and 16% from the previous year, with 44% of sales being first-time buyers. The median home price was up 0.4% from a year ago.
- Total housing inventory rose slightly but is down 1.8% from the previous year, indicating the market may bottom out in the next few months. Fannie Mae shortened the waiting period for a new mortgage after a short sale
The document provides an overview of recent developments in the US real estate market. It summarizes key data points like home sales, prices, inventory, and mortgage rates. It also outlines recent government actions to provide mortgage relief to unemployed homeowners and help underwater borrowers. New bills aim to stimulate hiring and the economy. The document concludes with tax tips for home energy efficiency upgrades.
The document summarizes recent developments in the US housing market. It discusses signs of recovery including lower mortgage rates and inventory. Government programs like the FDIC principal reduction program aim to help troubled homeowners. Jumbo mortgages are becoming more available again after tightening during the financial crisis. The document provides tips for homeowners regarding tax deductions and credits.
This document provides a summary of recent real estate market trends and government actions. Home sales increased in October while prices and inventory declined. Mortgage rates remain low boosting affordability. The government extended homebuyer tax credits and issued new guidelines for loan modifications and short sales to encourage recovery. Some economists expect unemployment and underemployment to remain high in the near term slowing overall growth.
Budding signs of economic recovery continued in October. GDP grew 3.5% in Q3, the first quarterly growth in over a year. Home sales jumped 9.4% in September due to the homebuyer tax credit. An extension of the tax credit passed through Congress in early November, expanding eligibility. The recovery is ongoing but unemployment, government debt, and trade imbalances still need addressing.
- The median home price in the Portland area declined 13.9% over the last year to $246,200 as of Q2 2009, continuing a weakening trend.
- Local job losses over the last year were sharp at -56,800 (-5.5%), contributing to weak housing demand.
- Mortgage rates remain low while affordability is improving, with the monthly mortgage payment-to-income ratio at a historically strong 15.4% in Q2 2009.
- Foreclosure rates on prime loans are low at 0.4% while rates on subprime and Alt-A loans show large local increases compared to a year ago but remain below national averages.
This document provides a summary of recent real estate market trends and government actions. It discusses signs of a slow economic recovery and stabilization in home prices. While home sales are improving, foreclosures remain high. The housing market relies on the first-time homebuyer tax credit and Fed mortgage purchases, though these programs may end soon. Sustained recovery requires a balanced housing inventory through price stabilization. Tips are provided for home sellers to make small, low-cost improvements.
This document summarizes recent trends in the US housing market and real estate industry. It finds that existing home sales increased for the fourth consecutive month in July, driven by first-time buyers. While home prices and inventory levels remain lower than last year, prices have stabilized and are rising slowly from early 2009 lows. Mortgage rates remain near historic lows, improving affordability. The economy may continue to face challenges but signs point to a recovery in 2010 supported by government programs.
This document outlines 6 reasons why using a realtor is beneficial when selling a home. It notes that (1) serious buyers look at for sale by owner listings to save on commission, but most end up using a realtor. It then discusses (2) how realtors can sell homes faster due to supply and demand factors. Next, it addresses (3) the difficulty for-sale-by-owners have in separating serious buyers from lookers. It also points out that (4) the longer a home takes to sell, the more money the seller can lose. Additionally, it claims that (5) realtors provide more marketing services leading to greater exposure and more prospects. Finally, it asserts that (6
More from Keller Williams Realty Professionals (20)
Living in an UBER World - June '24 Sales MeetingTom Blefko
June 2024 Lancaster County Sales Meeting for Berkshire Hathaway HomeServices Homesale Realty covering the following topics: 1. VA Suspends Buyer Agent Payment Plan (article), 2. Frequently Used Terms in title, 3. Zillow Showcase Overview, 4. QuickBuy commission promotion, 5. Documenting Cooperative Compensation, 6. NAR's Code of Ethics - Mass Media Solicitations, 7. Is it really cheaper to rent? 8. Do's and Don't's when Terminating the Agreement of Sale, 9. Living in an UBER World
The SVN® organization shares a portion of their new weekly listings via their SVN Live® Weekly Property Broadcast. Visit https://svn.com/svn-live/ if you would like to attend our weekly call, which we open up to the brokerage community.
Dholera Smart City Latest Development Status 2024.pdfShivgan Infratech
Explore the latest development status of Dholera Smart City in 2024. Discover the progress, infrastructure, and future plans of India's first greenfield smart city.
AVRUPA KONUTLARI ESENTEPE - ENGLISH - Listing TurkeyListing Turkey
Looking for a new home in Istanbul? Look no further than Avrupa Konutlari Esentepe! Our beautifully designed homes provide the perfect blend of luxury and comfort, making them the perfect choice for anyone looking for a high-quality home in the city.
With a wide range of apartment types available, from 1+1 to 4+1, we have something to suit every need and budget. Each apartment is designed with attention to detail and features spacious and bright living areas, making them the perfect place to relax and unwind after a long day.
One of the things that sets Avrupa Konutlari Esentepe apart from other developments is our focus on creating a community that is both comfortable and convenient. Our homes are surrounded by lush green spaces, perfect for enjoying a peaceful stroll or having a picnic with friends and family. Additionally, our complex includes a variety of social and recreational amenities, such as swimming pools, sports fields, and playgrounds, making it easy for residents to stay active and socialize with their neighbors.
https://listingturkey.com/property/avrupa-konutlari-esentepe/
Stark Builders: Where Quality Meets Craftsmanship!shuilykhatunnil
At Stark Builders our vision is to redefine the renovation experience by combining both stunning design and high quality construction skills. We believe that by delivering both these key aspects together we are able to achieve incredible results for our clients and ensure every project reflects their vision and enhances their lifestyle.
Although we are not all related by blood we have created a team of highly professional and hardworking individuals who share the common goal of delivering beautiful and functional renovated spaces. Our tight nit team are able to work together in a way where we pour our passion into each and every project as we have a love for what we do. Building is our life.
The SVN® organization shares a portion of their new weekly listings via their SVN Live® Weekly Property Broadcast. Visit https://svn.com/svn-live/ if you would like to attend our weekly call, which we open up to the brokerage community.
BEST FARMLAND FOR SALE | FARM PLOTS NEAR BANGALORE | KANAKAPURA | CHICKKABALP...knox groups real estate
welcome to knox groups real estate company in Bangalore. best farm land for sale near Bangalore and madhugiri . Managed farmland near Kanakapura and Chickkabalapur get know more details about the projects .Knox groups is a leading real estate company dedicated to helping individuals and businesses navigate the dynamic real estate market. With our extensive knowledge, experience, and commitment to excellence, we deliver exceptional results for our clients. Discover the perfect foundation for your agricultural aspirations with KNOX Groups' prime farm lands. These aren't just plots; they're the fertile grounds where vibrant crops flourish, livestock thrives, and unique agricultural ventures come to life. At KNOX, we go beyond selling land we curate sustainable ecosystems, ensuring that your journey toward agricultural success is seamless and prosperous.