Mris3rdquarter2009
•
0 likes•95 views

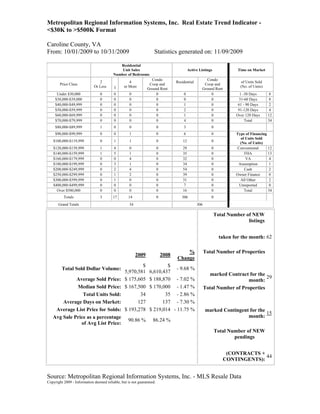
Caroline Virginia Housing Market Stats Information for 3rd quarter of 2009

Recommended
More Related Content
What's hot
What's hot (17)
Similar to Mris3rdquarter2009
Similar to Mris3rdquarter2009 (20)
More from Matthew Rathbun
More from Matthew Rathbun (20)
Recently uploaded
Recently uploaded (20)
Mris3rdquarter2009
- 1. Metropolitan Regional Information Systems, Inc. Real Estate Trend Indicator - <$30K to >$500K Format Caroline County, VA From: 10/01/2009 to 10/31/2009 Statistics generated on: 11/09/2009 Residential Unit Sales Active Listings Time on Market Number of Bedrooms Condo Condo 2 4 Residential of Units Sold Price Class Coop and Coop and Or Less 3 or More (No. of Units) Ground Rent Ground Rent Under $30,000 0 0 0 0 0 0 1 -30 Days 8 $30,000-$39,000 0 0 0 0 0 0 31-60 Days 8 $40,000-$49,999 0 0 0 0 1 0 61 - 90 Days 2 $50,000-$59,999 0 0 0 0 2 0 91-120 Days 4 $60,000-$69,999 0 0 0 0 1 0 Over 120 Days 12 $70,000-$79,999 0 0 0 0 4 0 Total 34 $80,000-$89,999 1 0 0 0 3 0 $90,000-$99,999 0 0 1 0 6 0 Type of Financing of Units Sold $100,000-$119,999 0 1 1 0 12 0 (No. of Units) $120,000-$139,999 1 4 0 0 29 0 Conventional 12 $140,000-$159,999 1 5 1 0 35 0 FHA 13 $160,000-$179,999 0 0 4 0 32 0 VA 4 $180,000-$199,999 0 3 1 0 34 0 Assumption 1 $200,000-$249,999 0 2 4 0 54 0 Cash 2 $250,000-$299,999 0 1 2 0 39 0 Owner Finance 0 $300,000-$399,999 0 1 0 0 31 0 All Other 2 $400,000-$499,999 0 0 0 0 7 0 Unreported 0 Over $500,000 0 0 0 0 16 0 Total 34 Totals 3 17 14 0 306 0 Grand Totals 34 306 Total Number of NEW listings taken for the month: 62 % Total Number of Properties 2009 2008 Change $ $ Total Sold Dollar Volume: - 9.68 % 5,970,581 6,610,437 marked Contract for the Average Sold Price: $ 175,605 $ 188,870 - 7.02 % 29 month: Median Sold Price: $ 167,500 $ 170,000 - 1.47 % Total Number of Properties Total Units Sold: 34 35 - 2.86 % Average Days on Market: 127 137 - 7.30 % Average List Price for Solds: $ 193,278 $ 219,014 - 11.75 % marked Contingent for the 15 Avg Sale Price as a percentage month: 90.86 % 86.24 % of Avg List Price: Total Number of NEW pendings (CONTRACTS + 44 CONTINGENTS): Source: Metropolitan Regional Information Systems, Inc. - MLS Resale Data Copyright 2009 - Information deemed reliable, but is not guaranteed.