Download to read offline
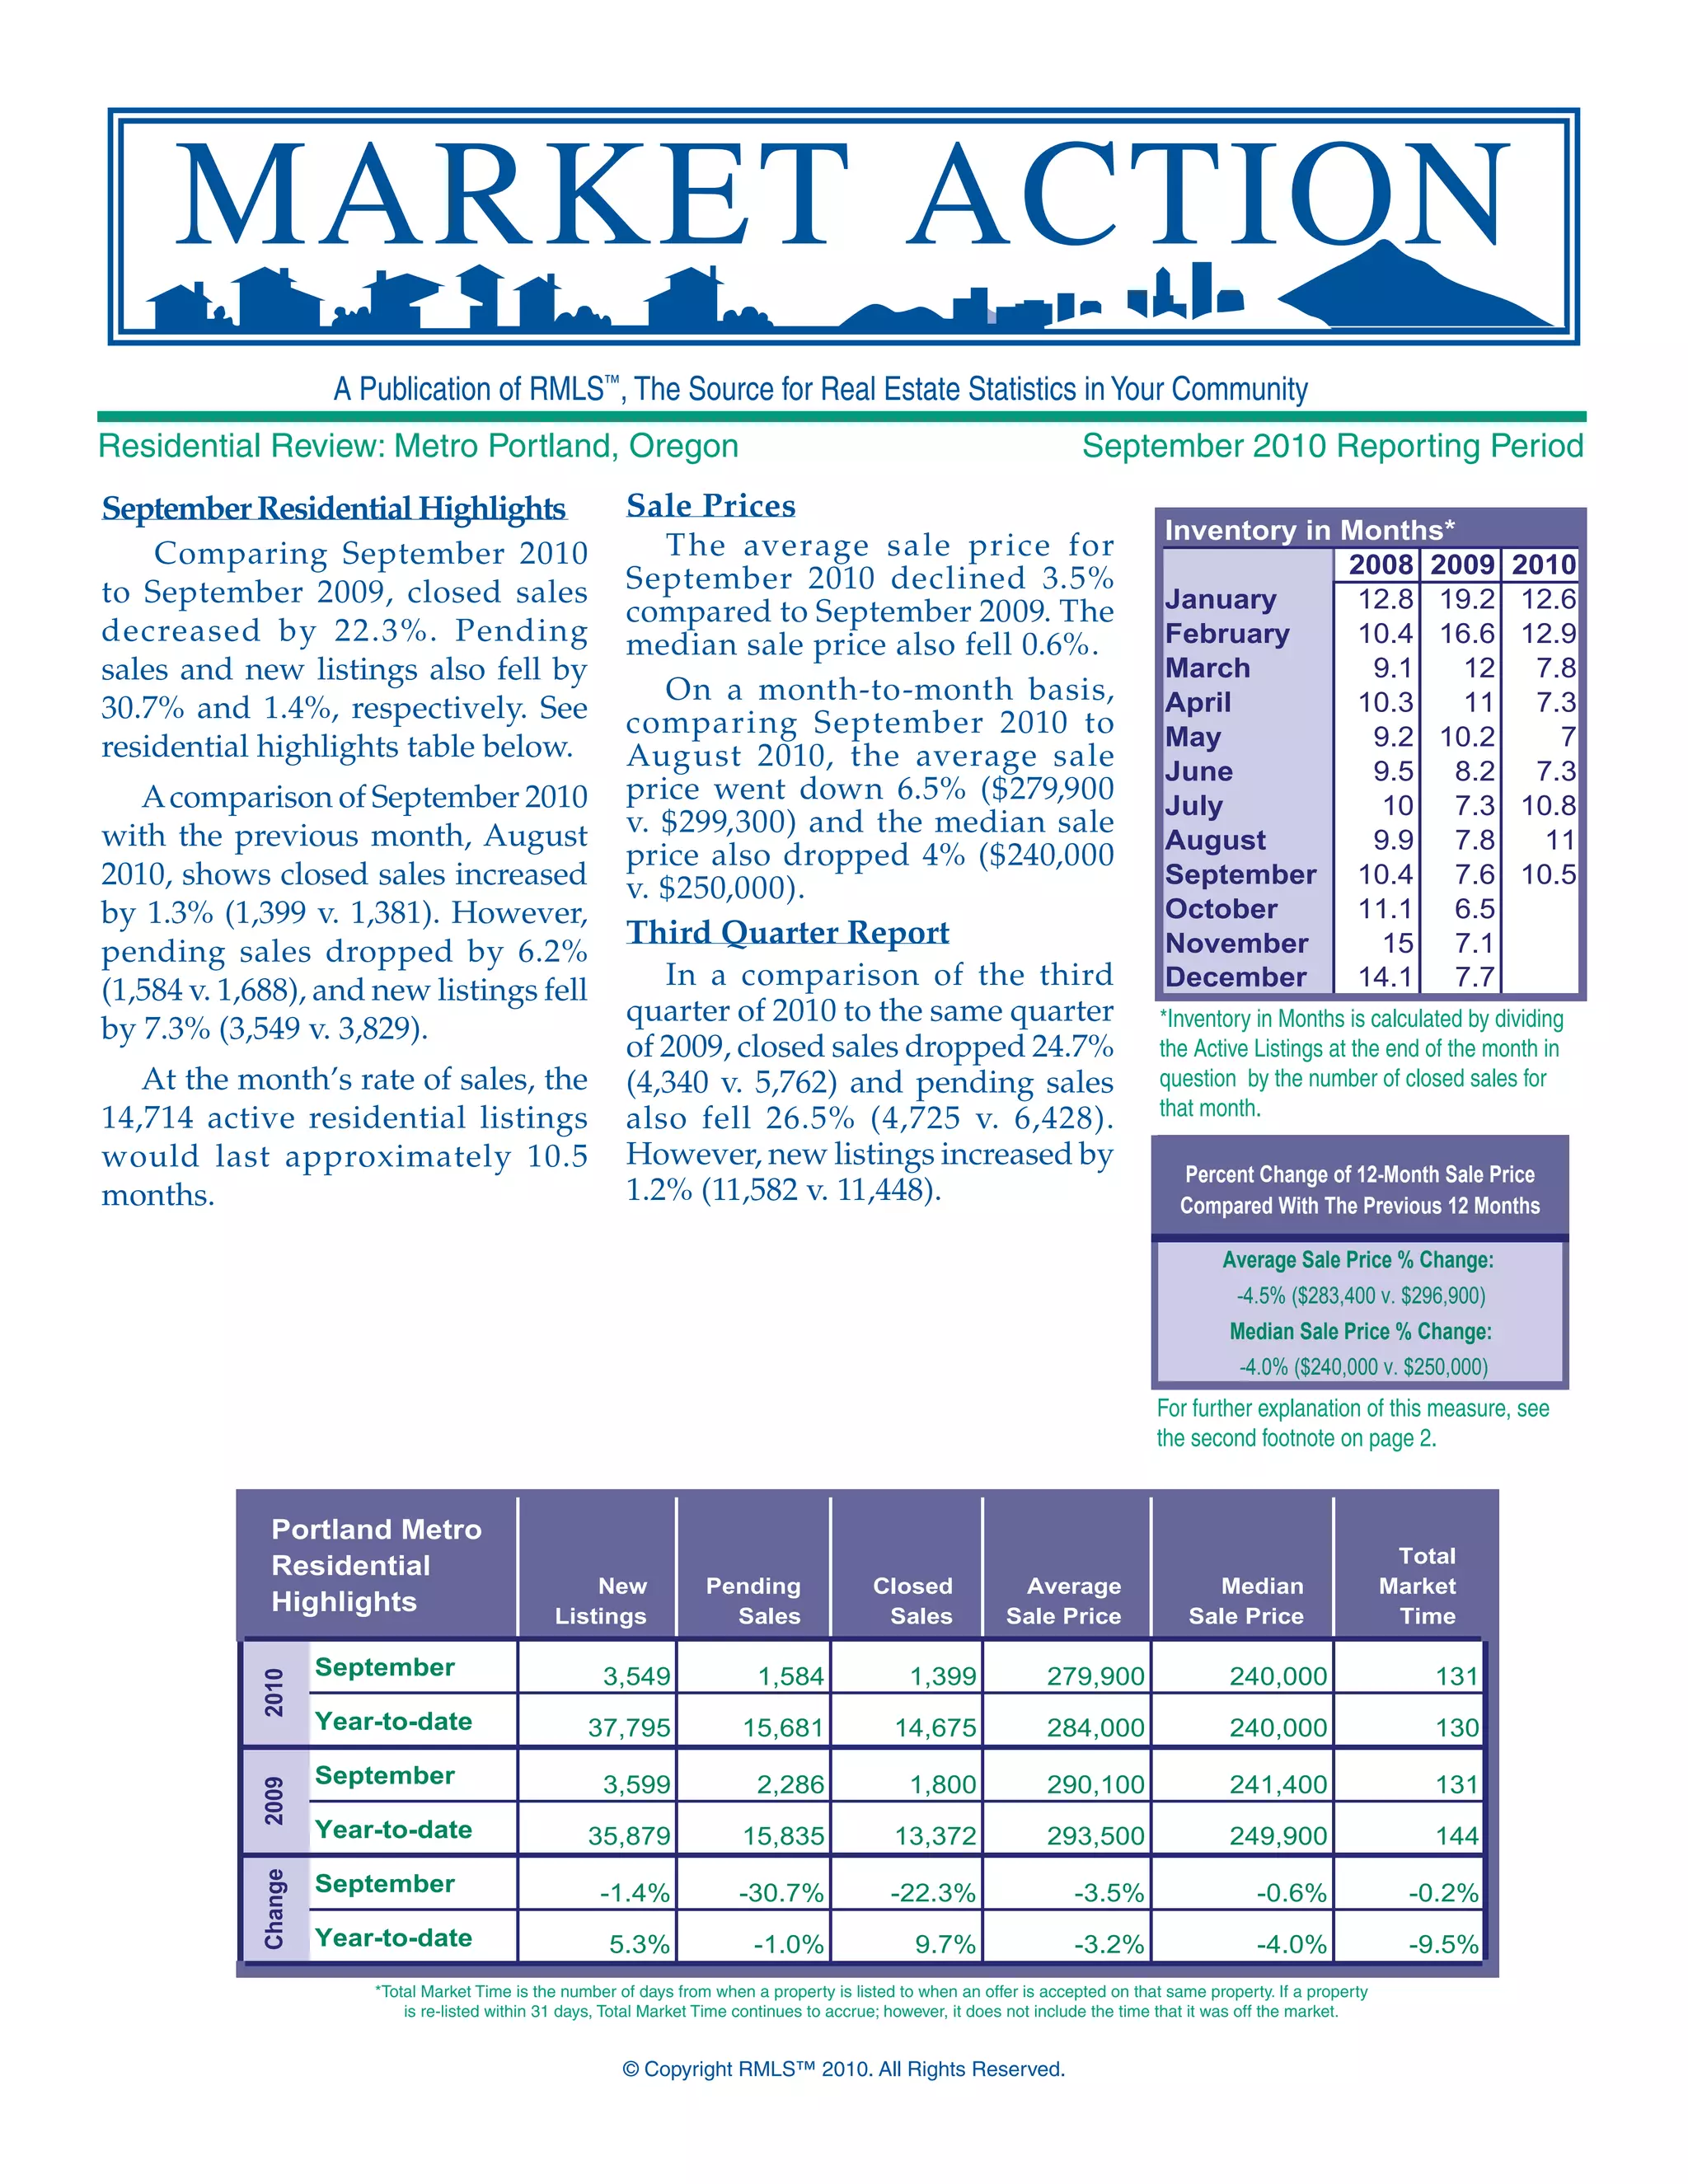
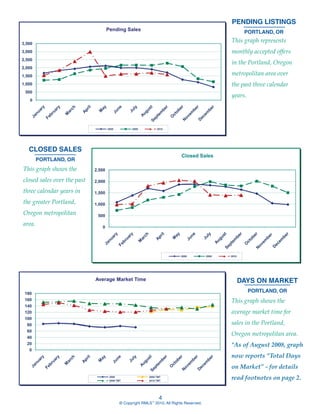
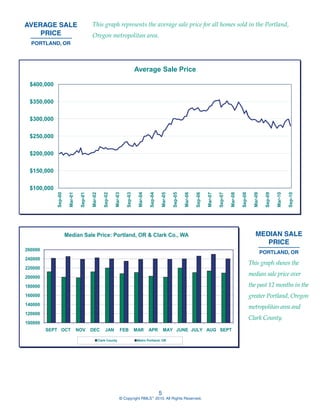

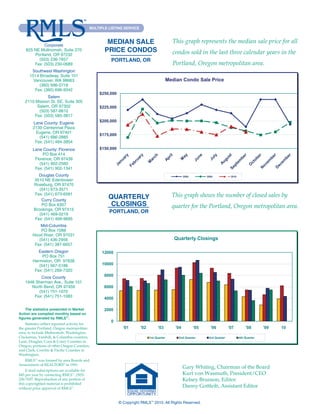

- Closed home sales in the Portland, OR metro area decreased 22.3% in September 2010 compared to September 2009, while pending sales and new listings also declined. - The average home sale price fell 3.5% and the median price dropped 0.6% in September 2010 year-over-year. Month-to-month, prices decreased 6.5% and 4% respectively. - As of September 2010, there were 14,714 homes listed in the Portland metro market, which at the current sales rate would last 10.5 months to sell.


![02 This Month In Real Estate February Us 2010[1]](https://cdn.slidesharecdn.com/ss_thumbnails/02thismonthinrealestatefebruaryus20101-100224074401-phpapp02-thumbnail.jpg?width=640&height=640&fit=bounds)


